art13 - saramet 257-264 - Farmacia
art13 - saramet 257-264 - Farmacia
art13 - saramet 257-264 - Farmacia

Create successful ePaper yourself
Turn your PDF publications into a flip-book with our unique Google optimized e-Paper software.
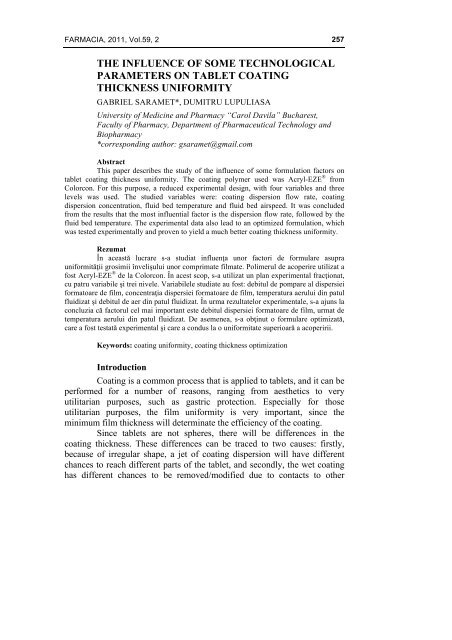
FARMACIA, 2011, Vol.59, 2<br />
THE INFLUENCE OF SOME TECHNOLOGICAL<br />
PARAMETERS ON TABLET COATING<br />
THICKNESS UNIFORMITY<br />
GABRIEL SARAMET*, DUMITRU LUPULIASA<br />
University of Medicine and Pharmacy “Carol Davila” Bucharest,<br />
Faculty of Pharmacy, Department of Pharmaceutical Technology and<br />
Biopharmacy<br />
*corresponding author: g<strong>saramet</strong>@gmail.com<br />
Abstract<br />
This paper describes the study of the influence of some formulation factors on<br />
tablet coating thickness uniformity. The coating polymer used was Acryl-EZE ® from<br />
Colorcon. For this purpose, a reduced experimental design, with four variables and three<br />
levels was used. The studied variables were: coating dispersion flow rate, coating<br />
dispersion concentration, fluid bed temperature and fluid bed airspeed. It was concluded<br />
from the results that the most influential factor is the dispersion flow rate, followed by the<br />
fluid bed temperature. The experimental data also lead to an optimized formulation, which<br />
was tested experimentally and proven to yield a much better coating thickness uniformity.<br />
Rezumat<br />
În această lucrare s-a studiat influenţa unor factori de formulare asupra<br />
uniformităţii grosimii învelişului unor comprimate filmate. Polimerul de acoperire utilizat a<br />
fost Acryl-EZE ® de la Colorcon. În acest scop, s-a utilizat un plan experimental fracţionat,<br />
cu patru variabile şi trei nivele. Variabilele studiate au fost: debitul de pompare al dispersiei<br />
formatoare de film, concentraţia dispersiei formatoare de film, temperatura aerului din patul<br />
fluidizat şi debitul de aer din patul fluidizat. În urma rezultatelor experimentale, s-a ajuns la<br />
concluzia că factorul cel mai important este debitul dispersiei formatoare de film, urmat de<br />
temperatura aerului din patul fluidizat. De asemenea, s-a obţinut o formulare optimizată,<br />
care a fost testată experimental şi care a condus la o uniformitate superioară a acoperirii.<br />
Keywords: coating uniformity, coating thickness optimization<br />
Introduction<br />
Coating is a common process that is applied to tablets, and it can be<br />
performed for a number of reasons, ranging from aesthetics to very<br />
utilitarian purposes, such as gastric protection. Especially for those<br />
utilitarian purposes, the film uniformity is very important, since the<br />
minimum film thickness will determinate the efficiency of the coating.<br />
Since tablets are not spheres, there will be differences in the<br />
coating thickness. These differences can be traced to two causes: firstly,<br />
because of irregular shape, a jet of coating dispersion will have different<br />
chances to reach different parts of the tablet, and secondly, the wet coating<br />
has different chances to be removed/modified due to contacts to other<br />
<strong>257</strong>
258<br />
FARMACIA, 2011, Vol.59, 2<br />
tablets or equipment, according to its position on the tablet. For those<br />
reasons, the film thickness tends to be smaller at tablet edges.<br />
Literature references describe some methods of determining the<br />
coating thickness: interferometry, spectroscopic methods (NIR - Near-<br />
Infrared spectroscopy, FTIR - Fourier transform infrared spectroscopy,<br />
Terahertz, X-Ray, fluorescence), Raman and even tomographic methods<br />
[1,2]. However, in order to describe local coating thickness, imaging<br />
methods appear to be more appropriate [3,4]. The imaging method<br />
described in this paper is based on commercially available macro<br />
photography equipment.<br />
Like all industrial processes, tablet coating can be optimized. This<br />
paper presents the influence of four technological variables on the coating<br />
uniformity.<br />
Materials and methods<br />
Materials<br />
Blank tablets (obtained in-house), Colorcon Opadry ® and Acryl-<br />
EZE ® (courtesy of Biofarm) as coating materials, Caleva Mini Coater/Drier<br />
2 for coating, Mettler precision scales, Canon EOS 500D digital camera<br />
with 105mm Sigma Macro lens for imaging (shot at f8), the GIMP graphic<br />
package for image analysis, OpenOffice for calculations.<br />
Experimental design<br />
The tablets used were in-house made, with no active ingredient. The<br />
dimensions were chosen to be as far from spherical as possible – namely<br />
12mm diameter, 0.4 g tablets, with an average thickness of 2.79 mm. The<br />
punches were beveled, causing the tablet faces to be beveled near the edges.<br />
For each experimental batch, 10 such tablets were used.<br />
The coating material, Acryl-Eze ® [5], is a product based on Eudragit<br />
L100-55 acrylic polymer, one of the most used coating materials [6,7].<br />
Since both the tablets and the coating material were white, before the<br />
coating, an intermediate, colored film of Opadry ® was applied, in order to<br />
facilitate the evaluation of the enteric coating. A fractionate experimental<br />
design was elaborated, optimizing the influence of four independent<br />
parameters (shown in Table I) on one dependent parameter.<br />
The independent parameters were: coating dispersion flow rate, fluid<br />
bed air speed, fluid bed temperature, coating dispersion concentration. The<br />
dependent parameter was the coating uniformity, measured as the ratio<br />
between edge thickness and face center thickness. The experimental design<br />
was based on a four factor/three level Taguchi plan matrix [8]. The
FARMACIA, 2011, Vol.59, 2<br />
independent factor levels were chosen so they mostly cover the usable range<br />
and are shown in Table I. The experimental design plan is shown in Table<br />
II. It will be noted that for X1 and X4, instead of using actual flow rates and<br />
airspeed, the displayed percentage on the Mini Coater/ Drier was used. This<br />
simplifies the decimal point estimations.<br />
Table I<br />
Independent variables<br />
Independent factors Symbol Level 1 Level 2 Level 3<br />
Pump flow rate (%)<br />
(Acryl-EZE ® dispersion<br />
flow rate)<br />
X1 40 70 100<br />
Acryl-EZE ® dispersion<br />
concentration (%)<br />
X2 8 15 20<br />
Fluid bed temperature<br />
X3 40 48 55<br />
(°C)<br />
Fluid bed air fan flow<br />
rate (%) (Fluid bed<br />
airspeed)<br />
X4 50 70 90<br />
Table II<br />
The matrix of experimental design<br />
Exp No Symbol X1 X2 X3 X4<br />
1 N1 40 8 40 50<br />
2 N2 40 15 48 70<br />
3 N3 40 20 55 90<br />
4 N4 70 8 48 90<br />
5 N5 70 15 55 50<br />
6 N6 70 20 40 70<br />
7 N7 100 8 55 70<br />
8 N8 100 15 40 90<br />
9 N9 100 20 48 50<br />
Imaging<br />
After coating, tablets were fractured and the fracture was<br />
photographed. On the digital images, the thickness (pixels) of the coating<br />
was measured, and homogeneity was calculated. For each tablet, at least<br />
four images were captured, each keeping in focus one “corner” of the<br />
fractured tablet. For each image, at least two measurements were attempted:<br />
on tablet edge and as close to the tablet center the depth of field allowed. In<br />
practice, during the fracture, the “corner” where the fracture ended was not<br />
in level with the rest of the fracture plane, and the coating usually peeled.<br />
Homogeneity (or uniformity) was calculated as the ratio minimum/<br />
maximum thickness for each image.<br />
259
260<br />
FARMACIA, 2011, Vol.59, 2<br />
Results and discussion<br />
The average of the approximately 30 measurements for each of the 9<br />
experiments are shown in Table III. Shown numbers are rounded to the fourth<br />
decimal, up to where detector sensibility was estimated to be significant.<br />
Table III<br />
Response (coating uniformity, rounded to 4 decimals)<br />
Exp Name Y<br />
N1 0.7279<br />
N2 0.9248<br />
N3 0.8762<br />
N4 0.9111<br />
N5 0.9327<br />
N6 0.8146<br />
N7 0.8887<br />
N8 0.8577<br />
N9 0.9164<br />
Average 0.8722<br />
Data analysis<br />
Each experiment generated a response. By using the Taguchi<br />
technique, the influence of each independent parameter was determined at<br />
each of the three levels. The results are shown in Table IV and graphically<br />
displayed in Figure 1. Since this technique offered three points of data for<br />
each parameter, quadratic functions that pass through these points could be<br />
determined and their maximums were calculated. Second-order Response<br />
Surface Methodology (RSM) is one of the frequently used techniques in<br />
experimental design [9,10], however a central composite design would have<br />
generated a much too large number of experiments. Therefore, the secondorder<br />
RSM was simplified to its core, the quadratic function.<br />
Table IV<br />
Factor influence matrix (rounded to 4 decimals)<br />
Factor Level Y<br />
X1 1 0.8430<br />
X1 2 0.8862<br />
X1 3 0.8876<br />
X2 1 0.8426<br />
X2 2 0.9051<br />
X2 3 0.8691<br />
X3 1 0.8000<br />
X3 2 0.9175<br />
X3 3 0.8992<br />
X4 1 0.8590<br />
X4 2 0.8760<br />
X4 3 0.8817
FARMACIA, 2011, Vol.59, 2<br />
On average, the initial experiments from the experimental plan<br />
yielded an uniformity of 0.872 with a maximum of 0.917 and a minimum of<br />
0.728. Based on independent factors’ influence on the response, the<br />
optimum values were calculated for each independent factor, using the<br />
quadratic function. Those values are shown in Table V. The values are also<br />
shown rounded to closest integer, since the settings on the coating machine<br />
allows only integer numbers. In order to verify this prediction, a final<br />
experiment was conducted, using these theoretical optimal values. The<br />
result is shown in Table VI.<br />
Table V<br />
Factor<br />
X value needed to<br />
optimize Y<br />
261<br />
Optimum calculated levels<br />
X value needed to<br />
optimize Y<br />
(rounded to integer)<br />
X1 86.0549 86<br />
X2 14.8208 15<br />
X3 50.3702 50<br />
X4 89.9354 90<br />
Figure 1<br />
The calculated influences of each factor at each level on the coating uniformity. X<br />
(1-4) are factors and L (1-3) are levels, as listed in Table I. Higher uniformity<br />
(closer to 1) is better.
262<br />
FARMACIA, 2011, Vol.59, 2<br />
Figure 2<br />
Imaging procedure. Fractured tablets were photographed as close to minimum<br />
focusing distance as possible, in order to increase test’s sensitivity. Crosshair<br />
marker is used to approximately center the tablet and to insure the focusing plane is<br />
as parallel as possible to the fracture plane.<br />
Table VI<br />
Final experiment – response (rounded to four decimals)<br />
Exp Name Y<br />
N10 0.9655<br />
The final experiment yielded an uniformity of 0.965. In order to<br />
improve the perception, it is useful to calculate how much the disuniformity<br />
was decreased. Starting with an average of 12% it was pushed to about 3%,<br />
a four times rate of success. Compared with the best experiment, it<br />
decreased from about 8% to 3%, again, almost 3 times.<br />
Imaging resolution. The camera’s sensor has a pixel size of<br />
0.0047mm according to the manufacturer data[11]. In other words, the<br />
image of a square of 1x1 millimeters is a square of 213/213 pixels. Diagonal<br />
measurements could be theoretically more complicated, due to Nyquist<br />
limit, but aliasing was not a problem in the measured images. However, this
FARMACIA, 2011, Vol.59, 2<br />
optical measurement technique allows to measure (and compare) only those<br />
parts of the images that are within the depth of field. Since in macro<br />
photography depth of field is necessarily very thin, thickness uniformity was<br />
considered a much more measurable response parameter than coating<br />
thickness itself. Also, due to this very thin depth of field, more sophisticated<br />
image analysis techniques [3] are difficult to conduct.<br />
The used combination of RSM and Taguchi design does offer<br />
significant advantages, for this particular case, the number of experiments<br />
was decreased from 81 (if we consider a full factorial design) or 27<br />
(principal component analysis design – centered faces) to 9 experiments. On<br />
the other hand, this simpler combination does not easily allow one to make<br />
predictions concerning the response of the optimization process, but only on<br />
the independent factors values.<br />
However, since by this technique, the heterogeneity of the coating<br />
was reduced in average four times, down to about 3% and a certain<br />
heterogeneity is inherent to the coating process, the experimental procedure<br />
can be considered successful.<br />
Conclusions<br />
Based on the combination of RSM and Taguchi, an experimental<br />
plan was drafted in order to optimize the coating thickness on<br />
pharmaceutical tablets. Four independent factors at three levels were<br />
considered. All four factors influence the coating uniformity, the most<br />
influential being the pump flow rate and the drying temperature. The quality<br />
of the coating was improved about four times, on average, compared to<br />
starting conditions.<br />
Acknowlegments<br />
This paper is partially supported by the Sectoral Operational Programme<br />
Human Resources Development, financed from the European Social Fund and by<br />
the Romanian Government under the contract number POSDRU/89/1.5/S/64109<br />
References<br />
1. Sovany T., Nikowitz K., Regdon G. Jr., Kasa P., Pintye-Hodi K., Raman spectroscopic<br />
investigation of film thickness, Polym.Test. 2009, 28, 770-772<br />
2. Sasic S., Determining the coating thickness of tablets by chiseling and image analysis, Int.<br />
J. Pharm. 2010, 397, 109-115<br />
3. Garcia-Munoz S., Gierer D. S., Coating uniformity assessment for colored immediate<br />
release tablets using multivariate image analysis, Int. J. Pharm. 2010, 395, 104-113<br />
4. Mozina M., Tomazevic D., Leben S., Pernus F., Likar B., Digital imaging as a process<br />
analytical technology tool for fluid-bed pellet coating process, Eur. J. Pharm. Sci. 2010,<br />
41, 156-162<br />
5. https://www.colorcon.com/literature/marketing/mr/Delayed%20Release/Acryl-<br />
EZE/English/pi_acryleze_prod_inf_v3_06_2009.pdf<br />
263
<strong>264</strong><br />
FARMACIA, 2011, Vol.59, 2<br />
6. Leucuta S. Tehnologie farmaceutica industriala, Editura Dacia, Cluj-Napoca, 2001, 312-<br />
322<br />
7. Popovici I., Lupuleasa D. et al, Tehnologie Farmaceutică vol 3, Editura Polirom, Iaşi,<br />
2009, 563-567<br />
8. Alexis J., Metoda Taguchi În Practica Industrială – Planuri de experienţe,, Editura<br />
Tehnică Bucureşti, 2009, 11-30, 143<br />
9. Bradley N, The Response Surface Methodology, master of science thesis, Indiana<br />
University of South Bend, 2007<br />
10. Gabrielsson J., Lindberg N-O., Lundstedt T., Multivariate methods in pharmaceutical<br />
applications, J. Chemometr. 2002, 16, 141-160<br />
11. http://www.canon.co.uk/for_home/product_finder/cameras/digital_slr/EOS_500D/index.a<br />
spx?specs=1<br />
12. Stanescu A., Ochiuz L., Cojocaru I., Popovici I., Lupuleasa D., The influence of different<br />
polymers on the pharmaco-technological characteristics of propiconazole nitrate<br />
bioadhesive oromucosal tablets, <strong>Farmacia</strong>, 2010, 58(3), 279-289<br />
13. Tomuta I., Vlase L., Popa A., Leucuta S.E., In vitro – in vivo evaluation of a novel drug<br />
delivery system for colonic targeting, <strong>Farmacia</strong>, 2010, 58(3), 368-377<br />
14. Popescu M.L., Dinu M., Toth O., Contributions to the pharmacognostical and<br />
phytobiological study on Leonorus cardiaca L. (Lamiaceae), <strong>Farmacia</strong>, 2009, 57(4), 424-<br />
431.<br />
Manuscript received: July 30 th 2010