Role of YAP/TAZ in mechanotransduction
Role of YAP/TAZ in mechanotransduction
Role of YAP/TAZ in mechanotransduction

You also want an ePaper? Increase the reach of your titles
YUMPU automatically turns print PDFs into web optimized ePapers that Google loves.
a<br />
mRNA expression<br />
c<br />
d<br />
RESEARCH ARTICLE<br />
<strong>YAP</strong>/<strong>TAZ</strong><br />
<strong>YAP</strong>/<strong>TAZ</strong><br />
100<br />
50<br />
0<br />
CTGF ANKRD1 4xGTIIC-lux<br />
90<br />
si<br />
Co.<br />
Unpatt.<br />
si<br />
YZ1<br />
si<br />
YZ2<br />
10,000 300 μm 2<br />
** ** **<br />
40<br />
kPa<br />
0.7<br />
kPa<br />
Micropillars<br />
60<br />
30<br />
0<br />
Cells seeded on stiff hydrogels or large islands show <strong>in</strong>creased cell<br />
spread<strong>in</strong>g but, at the same time, experience a broader cell–ECM contact<br />
area. To test whether <strong>YAP</strong>/<strong>TAZ</strong> are regulated by cell spread<strong>in</strong>g<br />
irrespectively <strong>of</strong> the total amount <strong>of</strong> ECM, we visualized <strong>YAP</strong>/<strong>TAZ</strong><br />
localization <strong>in</strong> MSC grown on the tip <strong>of</strong> closely arrayed fibronect<strong>in</strong>coated<br />
micropillars 12 : on these arrays, cells stretch from one micropillar<br />
to another, and assume a projected cell area comparable to cells<br />
plated on big islands (3,200 mm 2 on average, Fig. 1e); however, <strong>in</strong> these<br />
conditions, the actual area available for cell–ECM <strong>in</strong>teraction is only<br />
about 10% <strong>of</strong> their projected area (300 mm 2 on average, correspond<strong>in</strong>g<br />
to the smallest islands used <strong>in</strong> Fig. 1c). <strong>YAP</strong>/<strong>TAZ</strong> rema<strong>in</strong>ed nuclear on<br />
micropillars (Fig. 1e), <strong>in</strong>dicat<strong>in</strong>g that <strong>YAP</strong>/<strong>TAZ</strong> are primarily regulated<br />
by cell spread<strong>in</strong>g imposed by the ECM.<br />
<strong>YAP</strong>/<strong>TAZ</strong> sense cytoskeletal tension<br />
We then considered that cell spread<strong>in</strong>g entails activation <strong>of</strong> the small<br />
GTPase Rho that, <strong>in</strong> turn, regulates the formation <strong>of</strong> act<strong>in</strong> bundles,<br />
stress fibres and tensile actomyos<strong>in</strong> structures 2,3 . Indeed, cells on stiff<br />
ECM or big islands had more prom<strong>in</strong>ent stress fibres compared to<br />
Luciferase activity<br />
10,000 2,025 1,024 300 μm 2<br />
e<br />
<strong>YAP</strong>/<strong>TAZ</strong><br />
b<br />
<strong>YAP</strong>/<strong>TAZ</strong><br />
TOTO3<br />
Cell area<br />
(μm 2 )<br />
ECM area<br />
(μm 2 )<br />
Nuclear<br />
40 kPa 0.7 kPa <strong>YAP</strong>/<strong>TAZ</strong> (%)<br />
100<br />
50<br />
0<br />
40 0.7<br />
100<br />
75<br />
50<br />
25<br />
0<br />
6,000<br />
3,000 0<br />
6,000<br />
3,000<br />
0<br />
Nuclear 100<br />
500<br />
<strong>YAP</strong>/<strong>TAZ</strong> (%)<br />
Nuclear <strong>YAP</strong>/<strong>TAZ</strong> (%)<br />
Unpatt.<br />
10,000<br />
2,025<br />
1,024<br />
300<br />
300 μm2 Unpatt.<br />
Micropillars<br />
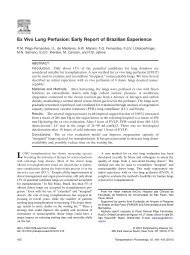
Figure 1 | <strong>YAP</strong>/<strong>TAZ</strong> are regulated by ECM stiffness and cell shape a, Realtime<br />
PCR analysis <strong>in</strong> MCF10A cells (CTGF and ANKRD1, coloured bars) and<br />
luciferase reporter assay <strong>in</strong> MDA-MB-231 cells (43GTIIC-lux, black bars) to<br />
measure <strong>YAP</strong>/<strong>TAZ</strong> transcriptional activity. Cells were transfected with the<br />
<strong>in</strong>dicated siRNAs (siCo., control siRNA; siYZ1 and siYZ2, two <strong>YAP</strong>/<strong>TAZ</strong><br />
siRNAs; see Supplementary Fig. 3) and grown on plastic, or plated on stiff<br />
(elastic modulus <strong>of</strong> 40 kPa) and s<strong>of</strong>t (0.7 kPa) fibronect<strong>in</strong>-coated hydrogels.<br />
Data are normalized to lane 1. n 5 4. b, Confocal immun<strong>of</strong>luorescence images<br />
<strong>of</strong> <strong>YAP</strong>/<strong>TAZ</strong> and nuclei (TOTO3) <strong>in</strong> human mesenchymal stem cells (MSC)<br />
plated on hydrogels. Scale bars, 15 mm. Graphs <strong>in</strong>dicate the percentage <strong>of</strong> cells<br />
with nuclear <strong>YAP</strong>/<strong>TAZ</strong>. (n 5 3). c, On top: grey patterns show the relative size<br />
<strong>of</strong> micropr<strong>in</strong>ted fibronect<strong>in</strong> islands on which cells were plated. Outl<strong>in</strong>e <strong>of</strong> a cell<br />
is shown superimposed to the leftmost unpatterned area (Unpatt.). Below:<br />
confocal immun<strong>of</strong>luorescence images <strong>of</strong> MSC plated on fibronect<strong>in</strong> islands <strong>of</strong><br />
decreas<strong>in</strong>g sizes (mm 2 ). Scale bars, 15 mm. Graph provides quantifications.<br />
(n 5 8). See also Supplementary Fig. 8. d, Confocal immun<strong>of</strong>luorescence<br />
images <strong>of</strong> <strong>YAP</strong>/<strong>TAZ</strong> <strong>in</strong> HMVEC plated as <strong>in</strong> c. Scale bars, 15 mm. See also<br />
Supplementary Fig. 9. e, On top: grey dots exemplify the distribution <strong>of</strong><br />
fibronect<strong>in</strong> on micropillar arrays, shown superimposed with the outl<strong>in</strong>e <strong>of</strong> a<br />
cell. Below: representative immun<strong>of</strong>luorescence <strong>of</strong> <strong>YAP</strong>/<strong>TAZ</strong> <strong>in</strong> MSC plated on<br />
rigid micropillars. Scale bars, 15 mm. Graphs, quantification <strong>of</strong> the projected cell<br />
area, total ECM contact area, and nuclear <strong>YAP</strong>/<strong>TAZ</strong> <strong>in</strong> MSC plated on<br />
unpatterned fibronect<strong>in</strong>, micropillars and 300 mm 2 islands. (n 5 4). All error<br />
bars are s.d. (*P , 0.05; **P , 0.01; Student’s t-test is used throughout).<br />
Experiments were repeated n times with duplicate biological replicates.<br />
**<br />
those plated on s<strong>of</strong>t ECM or small islands (Supplementary Figs 9 and<br />
10). As shown <strong>in</strong> Fig. 2a, we found that Rho and the act<strong>in</strong> cytoskeleton<br />
are required to ma<strong>in</strong>ta<strong>in</strong> nuclear <strong>YAP</strong>/<strong>TAZ</strong> <strong>in</strong> MSC. As a control,<br />
<strong>in</strong>hibition <strong>of</strong> Rac1-GEFs (guan<strong>in</strong>e nucleotide exchange factors), or<br />
disruption <strong>of</strong> microtubules, did not alter <strong>YAP</strong>/<strong>TAZ</strong> localization<br />
(Fig. 2a). Similar results were obta<strong>in</strong>ed also <strong>in</strong> HMVEC and MEC<br />
(not shown). Crucially, <strong>in</strong>hibition <strong>of</strong> Rho and <strong>of</strong> the act<strong>in</strong> cytoskeleton<br />
also <strong>in</strong>hibited <strong>YAP</strong>/<strong>TAZ</strong> transcriptional activity, as assayed by<br />
expression <strong>of</strong> endogenous target genes (Fig. 2b) and by luciferase<br />
reporter assays (Fig. 2c). Conversely, trigger<strong>in</strong>g F-act<strong>in</strong> polymerization<br />
and stress fibres formation by overexpression <strong>of</strong> activated diaphanous<br />
prote<strong>in</strong> (DIAPH1) promoted <strong>YAP</strong>/<strong>TAZ</strong> activity (Supplementary Fig.<br />
12).<br />
We then asked whether <strong>YAP</strong>/<strong>TAZ</strong> are regulated by the ratio <strong>of</strong><br />
monomeric/filamentous act<strong>in</strong>, as others observed for MAL/SRF 13 .<br />
To <strong>in</strong>crease monomeric G-act<strong>in</strong>, we overexpressed the R62D mutant<br />
act<strong>in</strong> 13 , but this was <strong>in</strong>sufficient to <strong>in</strong>hibit <strong>YAP</strong>/<strong>TAZ</strong> (Fig. 2c).<br />
Moreover, <strong>in</strong>creas<strong>in</strong>g the amount <strong>of</strong> F-act<strong>in</strong> either by overexpress<strong>in</strong>g<br />
the F-act<strong>in</strong> stabiliz<strong>in</strong>g V159N act<strong>in</strong> mutant or by serum stimulation 13<br />
had no effect on <strong>YAP</strong>/<strong>TAZ</strong> activity (Supplementary Fig. 13) or nuclear<br />
localization (data not shown). As a control, <strong>in</strong> the same experimental<br />
set-up, MAL/SRF activity was <strong>in</strong>stead clearly modulated<br />
a Control C3 Lat.A<br />
b<br />
<strong>YAP</strong>/<strong>TAZ</strong><br />
c<br />
Luciferase activity<br />
NSC23766<br />
Noco<br />
4xGTIIC-lux<br />
125<br />
100<br />
75<br />
50<br />
25<br />
0<br />
e<br />
Luciferase activity<br />
Co.<br />
Lat.A<br />
4xGTIIC-lux<br />
Co.<br />
Y27632<br />
Blebbist.<br />
Act<strong>in</strong> R62D<br />
180 | NATURE | VOL 474 | 9 JUNE 2011<br />
©2011<br />
Macmillan Publishers Limited. All rights reserved<br />
<strong>YAP</strong>/<strong>TAZ</strong><br />
40<br />
30<br />
20<br />
10<br />
0<br />
d<br />
<strong>YAP</strong>/<strong>TAZ</strong><br />
f<br />
<strong>YAP</strong>/<strong>TAZ</strong><br />
Nuclear <strong>YAP</strong>/<strong>TAZ</strong> (%)<br />
Control<br />
100<br />
75<br />
50<br />
25<br />
0<br />
Rigid<br />
pillars<br />
Co.<br />
C3<br />
Lat.A<br />
NSC<br />
Noco.<br />
Elastic<br />
pillars<br />
Nuclear<br />
<strong>YAP</strong>/<strong>TAZ</strong> (%)<br />
mRNA expression<br />
Y27632 Blebbist.<br />
100<br />
80<br />
60<br />
40<br />
20 0<br />
Nuclear<br />
<strong>YAP</strong>/<strong>TAZ</strong> (%)<br />
100<br />
50<br />
0<br />
Co.<br />
100<br />
50<br />
0<br />
Rigid<br />
Elastic<br />
CTGF<br />
ANKRD1<br />
**<br />
**<br />
C3<br />
Lat.A<br />
Co.<br />
Y27632<br />
Blebbist.<br />
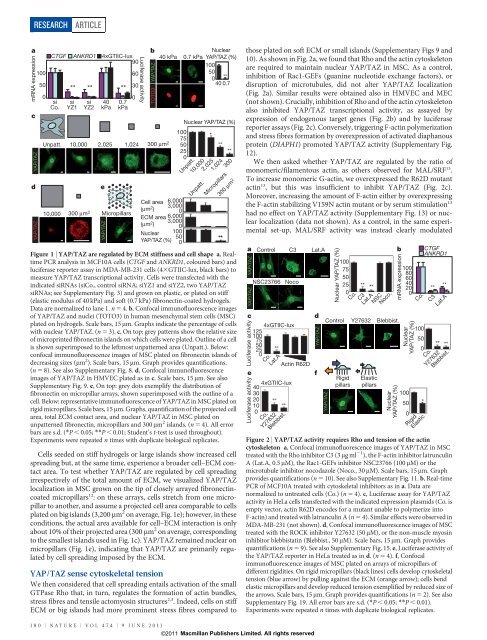
Figure 2 | <strong>YAP</strong>/<strong>TAZ</strong> activity requires Rho and tension <strong>of</strong> the act<strong>in</strong><br />
cytoskeleton a, Confocal immun<strong>of</strong>luorescence images <strong>of</strong> <strong>YAP</strong>/<strong>TAZ</strong> <strong>in</strong> MSC<br />
treated with the Rho <strong>in</strong>hibitor C3 (3 mgml 21 ), the F-act<strong>in</strong> <strong>in</strong>hibitor latruncul<strong>in</strong><br />
A (Lat.A, 0.5 mM), the Rac1-GEFs <strong>in</strong>hibitor NSC23766 (100 mM) or the<br />
microtubule <strong>in</strong>hibitor nocodazole (Noco., 30 mM). Scale bars, 15 mm. Graph<br />
provides quantifications (n 5 10). See also Supplementary Fig. 11. b, Real-time<br />
PCR <strong>of</strong> MCF10A treated with cytoskeletal <strong>in</strong>hibitors as <strong>in</strong> a. Data are<br />
normalized to untreated cells (Co.) (n 5 4). c, Luciferase assay for <strong>YAP</strong>/<strong>TAZ</strong><br />
activity <strong>in</strong> HeLa cells transfected with the <strong>in</strong>dicated expression plasmids (Co. is<br />
empty vector, act<strong>in</strong> R62D encodes for a mutant unable to polymerize <strong>in</strong>to<br />
F-act<strong>in</strong>) and treated with latruncul<strong>in</strong> A (n 5 4). Similar effects were observed <strong>in</strong><br />
MDA-MB-231 (not shown). d, Confocal immun<strong>of</strong>luorescence images <strong>of</strong> MSC<br />
treated with the ROCK <strong>in</strong>hibitor Y27632 (50 mM), or the non-muscle myos<strong>in</strong><br />
<strong>in</strong>hibitor blebbistat<strong>in</strong> (Blebbist., 50 mM). Scale bars, 15 mm. Graph provides<br />
quantifications (n 5 9). See also Supplementary Fig. 15. e, Luciferase activity <strong>of</strong><br />
the <strong>YAP</strong>/<strong>TAZ</strong> reporter <strong>in</strong> HeLa treated as <strong>in</strong> d. (n 5 4). f, Confocal<br />
immun<strong>of</strong>luorescence images <strong>of</strong> MSC plated on arrays <strong>of</strong> micropillars <strong>of</strong><br />
different rigidities. On rigid micropillars (black l<strong>in</strong>es) cells develop cytoskeletal<br />
tension (blue arrow) by pull<strong>in</strong>g aga<strong>in</strong>st the ECM (orange arrow); cells bend<br />
elastic micropillars and develop reduced tension exemplified by reduced size <strong>of</strong><br />
the arrows. Scale bars, 15 mm. Graph provides quantifications (n 5 2). See also<br />
Supplementary Fig. 19. All error bars are s.d. (*P , 0.05; **P , 0.01).<br />
Experiments were repeated n times with duplicate biological replicates.