Mondi Limited
Mondi Limited
Mondi Limited

You also want an ePaper? Increase the reach of your titles
YUMPU automatically turns print PDFs into web optimized ePapers that Google loves.
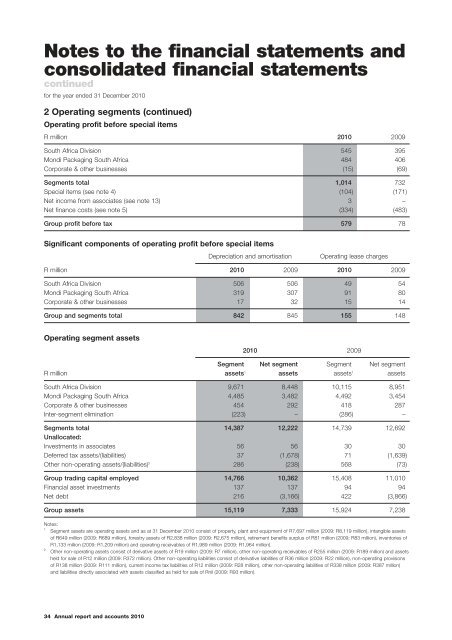
Notes to the financial statements and<br />
consolidated financial statements<br />
continued<br />
for the year ended 31 December 2010<br />
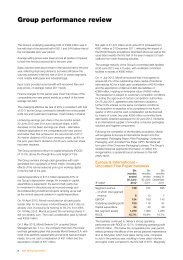
2 Operating segments (continued)<br />
Operating profit before special items<br />
R million 2010 2009<br />
South Africa Division 545 395<br />
<strong>Mondi</strong> Packaging South Africa 484 406<br />
Corporate & other businesses (15) (69)<br />
Segments total 1,014 732<br />
Special items (see note 4) (104) (171)<br />
Net income from associates (see note 13) 3 –<br />
Net finance costs (see note 5) (334) (483)<br />
Group profit before tax 579 78<br />
Significant components of operating profit before special items<br />
Depreciation and amortisation Operating lease charges<br />
R million 2010 2009 2010 2009<br />
South Africa Division 506 506 49 54<br />
<strong>Mondi</strong> Packaging South Africa 319 307 91 80<br />
Corporate & other businesses 17 32 15 14<br />
Group and segments total 842 845 155 148<br />
Operating segment assets<br />
2010 2009<br />
Segment Net segment Segment Net segment<br />
R million assets 1 assets assets 1 assets<br />
South Africa Division 9,671 8,448 10,115 8,951<br />
<strong>Mondi</strong> Packaging South Africa 4,485 3,482 4,492 3,454<br />
Corporate & other businesses 454 292 418 287<br />
Inter-segment elimination (223) – (286) –<br />
Segments total 14,387 12,222 14,739 12,692<br />
Unallocated:<br />
Investments in associates 56 56 30 30<br />
Deferred tax assets/(liabilities) 37 (1,678) 71 (1,639)<br />
Other non-operating assets/(liabilities) 2 286 (238) 568 (73)<br />
Group trading capital employed 14,766 10,362 15,408 11,010<br />
Financial asset investments 137 137 94 94<br />
Net debt 216 (3,166) 422 (3,866)<br />
Group assets 15,119 7,333 15,924 7,238<br />
Notes:<br />
1 Segment assets are operating assets and as at 31 December 2010 consist of property, plant and equipment of R7,697 million (2009: R8,119 million), intangible assets<br />
of R649 million (2009: R689 million), forestry assets of R2,838 million (2009: R2,675 million), retirement benefits surplus of R81 million (2009: R83 million), inventories of<br />
R1,133 million (2009: R1,209 million) and operating receivables of R1,989 million (2009: R1,964 million).<br />
2 Other non-operating assets consist of derivative assets of R19 million (2009: R7 million), other non-operating receivables of R255 million (2009: R189 million) and assets<br />
held for sale of R12 million (2009: R372 million). Other non-operating liabilities consist of derivative liabilities of R36 million (2009: R22 million), non-operating provisions<br />
of R138 million (2009: R111 million), current income tax liabilities of R12 million (2009: R28 million), other non-operating liabilities of R338 million (2009: R387 million)<br />
and liabilities directly associated with assets classified as held for sale of Rnil (2009: R93 million).<br />
34 Annual report and accounts 2010