Financial statements - Mondi
Financial statements - Mondi
Financial statements - Mondi

Create successful ePaper yourself
Turn your PDF publications into a flip-book with our unique Google optimized e-Paper software.
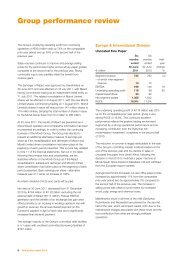
Notes to the combined and<br />
consolidated financial <strong>statements</strong><br />
continued<br />
for the year ended 31 December 2010<br />
2 Operating segments (continued)<br />
Non-current non-financial assets<br />
2010 2009<br />
Non-current Net Non-current Net<br />
non-financial Segment segment non-financial Segment segment<br />
E million assets 1 assets assets assets 1 assets assets<br />
Africa<br />
South Africa 2 1,253 1,584 1,344 1,074 1,346 1,163<br />
Rest of Africa 13 25 21 10 19 16<br />
Africa total 1,266 1,609 1,365 1,084 1,365 1,179<br />
Western Europe<br />
Austria 392 752 667 398 735 529<br />
United Kingdom 2 80 135 113 162 231 173<br />
Rest of western Europe 434 714 543 401 605 492<br />
Western Europe total 906 1,601 1,323 961 1,571 1,194<br />
Emerging Europe<br />
Poland 580 702 583 600 704 631<br />
Slovakia 492 547 466 544 588 543<br />
Rest of emerging Europe 392 536 394 380 524 425<br />
Emerging Europe total 1,464 1,785 1,443 1,524 1,816 1,599<br />
Russia 896 1,020 961 742 865 836<br />
North America 56 92 74 46 74 65<br />
Asia and Australia 20 39 36 49 121 88<br />
Group total 4,608 6,146 5,202 4,406 5,812 4,961<br />
Notes:<br />
1<br />
Non-current non-financial assets are non-current assets and consist of property, plant and equipment, intangible assets and forestry assets, but exclude retirement<br />
benefits surplus, deferred tax assets and non-current financial assets.<br />
2<br />
These non-current non-financial assets, segment assets and net segment assets, which total E1,333 million, E1,719 million and E1,457 million respectively<br />
(2009: E1,236 million, E1,577 million and E1,336 million respectively), are attributable to the countries in which the Group’s parent entities are domiciled.<br />
96 Annual report and accounts 2010