2013/2014 Konsepbegroting en begrotingsverwante beleide
2013/2014 Konsepbegroting en begrotingsverwante beleide
2013/2014 Konsepbegroting en begrotingsverwante beleide

Create successful ePaper yourself
Turn your PDF publications into a flip-book with our unique Google optimized e-Paper software.
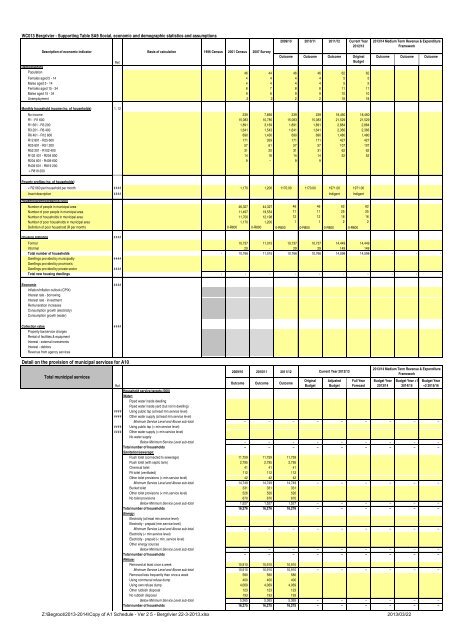
WC013 Bergrivier - Supporting Table SA9 Social, economic and demographic statistics and assumptions<br />
2009/10 2010/11 2011/12 Curr<strong>en</strong>t Year<br />
2012/13<br />
Description of economic indicator<br />
Basis of calculation 1996 C<strong>en</strong>sus 2001 C<strong>en</strong>sus 2007 Survey<br />
Outcome Outcome Outcome Original<br />
Ref.<br />
Budget<br />
Demographics<br />
Population 46 44 46 46 62 62<br />
Females aged 5 - 14 4 4 4 4 5 5<br />
Males aged 5 - 14 4 4 4 4 5 5<br />
Females aged 15 - 34 8 7 8 8 11 11<br />
Males aged 15 - 34 9 8 9 9 10 10<br />
Unemploym<strong>en</strong>t 2 2 2 2 18 18<br />
Monthly household income (no. of households) 1, 12<br />
No income 239 7,856 239 239 18,460 18,460<br />
R1 - R1 600 15,083 10,785 15,083 15,083 21,529 21,529<br />
R1 601 - R3 200 1,891 3,169 1,891 1,891 2,884 2,884<br />
R3 201 - R6 400 1,641 1,543 1,641 1,641 2,366 2,366<br />
R6 401 - R12 800 690 1,430 690 690 1,480 1,480<br />
R12 801 - R25 600 171 359 171 171 427 427<br />
R25 601 - R51 200 57 61 57 57 107 107<br />
R52 201 - R102 400 31 20 31 31 62 62<br />
R102 401 - R204 800 14 18 14 14 52 52<br />
R204 801 - R409 600 9 – 9 9<br />
R409 601 - R819 200<br />
> R819 200<br />
Poverty profiles (no. of households)<br />
< R2 060 per household per month #### 1,170 1,200 1170.00 1170.00 1971.00 1971.00<br />
Insert description #### Indig<strong>en</strong>t Indig<strong>en</strong>t<br />
Household/demographics (000)<br />
Number of people in municipal area 46,327 44,327 46<br />
46<br />
62<br />
Number of poor people in municipal area 11,497 19,554 11<br />
11<br />
25<br />
Number of households in municipal area 11,700 12,198 12<br />
12<br />
16<br />
Number of poor households in municipal area 1,170 1,200 1<br />
1<br />
2<br />
Definition of poor household (R per month) 0-R800 0-R800 0-R800 0-R800 0-R800 0-R800<br />
Housing statistics ####<br />
Outcome Outcome Outcome<br />
Formal 10,737 11,015 10,737 10,737 14,449 14,449<br />
Informal 29 - 29 29 149 149<br />
Total number of households - 10,766 11,015 10,766 10,766 14,598 14,598 - - -<br />
Dwellings provided by municipality ####<br />
Dwellings provided by province/s<br />
Dwellings provided by private sector ####<br />
Total new housing dwellings - - - - - - - - - -<br />
Economic ####<br />
Inflation/inflation outlook (CPIX)<br />
Interest rate - borrowing<br />
Interest rate - investm<strong>en</strong>t<br />
Remuneration increases<br />
Consumption growth (electricity)<br />
Consumption growth (water)<br />
Collection rates ####<br />
Property tax/service charges<br />
R<strong>en</strong>tal of facilities & equipm<strong>en</strong>t<br />
Interest - external investm<strong>en</strong>ts<br />
Interest - debtors<br />
Rev<strong>en</strong>ue from ag<strong>en</strong>cy services<br />
Detail on the provision of municipal services for A10<br />
Total municipal services<br />
2009/10 2010/11 2011/12<br />
Ref.<br />
Outcome Outcome Outcome<br />
####<br />
Household service targets (000)<br />
Water:<br />
Piped water inside dwelling<br />
Piped water inside yard (but not in dwelling)<br />
Using public tap (at least min.service level)<br />
#### Other water supply (at least min.service level)<br />
Minimum Service Level and Above sub-total –<br />
–<br />
–<br />
#### Using public tap (< min.service level)<br />
#### Other water supply (< min.service level)<br />
No water supply<br />
Below Minimum Service Level sub-total –<br />
–<br />
–<br />
Total number of households<br />
Sanitation/sewerage:<br />
–<br />
–<br />
–<br />
Flush toilet (connected to sewerage) 11,759 11,759 11,759<br />
Flush toilet (with septic tank) 2,795 2,795 2,795<br />
Chemical toilet 41<br />
41<br />
41<br />
Pit toilet (v<strong>en</strong>tilated) 112<br />
112<br />
112<br />
Other toilet provisions (> min.service level) 42<br />
42<br />
42<br />
Minimum Service Level and Above sub-total 14,749 14,749 14,749<br />
Bucket toilet 331<br />
331<br />
331<br />
Other toilet provisions (< min.service level) 526<br />
526<br />
526<br />
No toilet provisions 670<br />
670<br />
670<br />
Below Minimum Service Level sub-total 1,527 1,527 1,527<br />
Total number of households<br />
Energy:<br />
Electricity (at least min.service level)<br />
Electricity - prepaid (min.service level)<br />
16,276 16,276 16,276<br />
Minimum Service Level and Above sub-total<br />
Electricity (< min.service level)<br />
Electricity - prepaid (< min. service level)<br />
Other <strong>en</strong>ergy sources<br />
–<br />
–<br />
–<br />
Below Minimum Service Level sub-total –<br />
–<br />
–<br />
Total number of households<br />
Refuse:<br />
–<br />
–<br />
–<br />
Removed at least once a week 10,910 10,910 10,910<br />
Minimum Service Level and Above sub-total 10,910 10,910 10,910<br />
Removed less frequ<strong>en</strong>tly than once a week 580<br />
580<br />
580<br />
Using communal refuse dump 400<br />
400<br />
400<br />
Using own refuse dump 4,069 4,069 4,069<br />
Other rubbish disposal 123<br />
123<br />
123<br />
No rubbish disposal 193<br />
193<br />
193<br />
Below Minimum Service Level sub-total 5,365 5,365 5,365<br />
Total number of households 16,275 16,275 16,275<br />
Z:\Begroot\<strong>2013</strong>-<strong>2014</strong>\Copy of A1 Schedule - Ver 2 5 - Bergrivier 22-3-<strong>2013</strong>.xlsx <strong>2013</strong>/03/22<br />
Original<br />
Budget<br />
–<br />
–<br />
–<br />
–<br />
–<br />
–<br />
–<br />
–<br />
–<br />
–<br />
–<br />
–<br />
Curr<strong>en</strong>t Year 2012/13<br />
Adjusted<br />
Budget<br />
–<br />
–<br />
–<br />
–<br />
–<br />
–<br />
–<br />
–<br />
–<br />
–<br />
–<br />
–<br />
Full Year<br />
Forecast<br />
62<br />
25<br />
16<br />
2<br />
–<br />
–<br />
–<br />
–<br />
–<br />
–<br />
–<br />
–<br />
–<br />
–<br />
–<br />
–<br />
<strong>2013</strong>/14 Medium Term Rev<strong>en</strong>ue & Exp<strong>en</strong>diture<br />
Framework<br />
<strong>2013</strong>/14 Medium Term Rev<strong>en</strong>ue & Exp<strong>en</strong>diture<br />
Framework<br />
Budget Year<br />
<strong>2013</strong>/14<br />
–<br />
–<br />
–<br />
–<br />
–<br />
–<br />
–<br />
–<br />
–<br />
–<br />
–<br />
–<br />
Budget Year +1<br />
<strong>2014</strong>/15<br />
–<br />
–<br />
–<br />
–<br />
–<br />
–<br />
–<br />
–<br />
–<br />
–<br />
–<br />
–<br />
Budget Year<br />
+2 2015/16<br />
–<br />
–<br />
–<br />
–<br />
–<br />
–<br />
–<br />
–<br />
–<br />
–<br />
–<br />
–