Final Interventions Report - DWA Home Page
Final Interventions Report - DWA Home Page
Final Interventions Report - DWA Home Page

Create successful ePaper yourself
Turn your PDF publications into a flip-book with our unique Google optimized e-Paper software.
Water Reconciliation Strategy Study for the Large Bulk Water Supply Systems: Greater Bloemfontein Area i<br />
Aurecon Project No: 402992<br />
Water Reconciliation Strategy Study for the Large Bulk<br />
Water Supply Systems: Greater Bloemfontein Area<br />
Prepared by: Aurecon (SA) (Pty) Ltd<br />
Aurecon Centre<br />
1 Century City Drive<br />
Waterford Precinct<br />
Century City<br />
Cape Town<br />
7441<br />
South Africa<br />
INTERVENTIONS REPORT<br />
Tel: 021 526 9400<br />
Fax: 021 526 9500<br />
FINAL<br />
June 2012<br />
Prepared for: Directorate: National Water Resource Planning<br />
Department of Water Affairs<br />
Private Bag X313<br />
Pretoria<br />
0001<br />
South Africa<br />
Tel: 012 336 7500<br />
Fax: 012 324 6592<br />
<strong>Interventions</strong> <strong>Report</strong> June 2012
Water Reconciliation Strategy Study for the Large Bulk Water Supply Systems: Greater Bloemfontein Area iii<br />
This report is to be referred to in bibliographies as:<br />
Department of Water Affairs, South Africa. 2012. <strong>Interventions</strong> <strong>Report</strong> for the Large Bulk Water Supply<br />
Systems of the Greater Bloemfontein Area. Prepared by Aurecon in association with GHT Consulting<br />
Scientists and ILISO Consulting as part of the Water Reconciliation Strategy Study for the Large Bulk Water<br />
Supply Systems: Greater Bloemfontein Area. <strong>DWA</strong> <strong>Report</strong> No. P WMA 14/C520/00/0910/03<br />
<strong>Interventions</strong> <strong>Report</strong> June 2012
Water Reconciliation Strategy Study for the Large Bulk Water Supply Systems: Greater Bloemfontein Area iv<br />
Water Reconciliation Strategy Study for the Large Bulk<br />
Water Supply Systems: Greater Bloemfontein Area<br />
<strong>Report</strong> Name<br />
Study <strong>Report</strong>s<br />
<strong>DWA</strong><br />
<strong>Report</strong> Number<br />
Aurecon<br />
<strong>Report</strong> Number<br />
Inception P WMA 14/C520/00/0910/01 402992/6231<br />
Preliminary Reconciliation Strategy P WMA 14/C520/00/0910/02 402992/6232<br />
<strong>Interventions</strong> <strong>Report</strong> P WMA 14/C520/00/0910/03 402992/6233<br />
Water Quality Assessment P WMA 14/C520/00/0910/04 402992/6234<br />
Reconciliation Strategy P WMA 14/C520/00/0910/05 402992/6235<br />
<strong>Interventions</strong> <strong>Report</strong> June 2012
Water Reconciliation Strategy Study for the Large Bulk Water Supply Systems: Greater Bloemfontein Area v<br />
ACKNOWLEDGEMENTS<br />
P van Niekerk <strong>DWA</strong><br />
J van Rooyen <strong>DWA</strong><br />
J Rademeyer <strong>DWA</strong><br />
D Ristic <strong>DWA</strong><br />
F Fourie <strong>DWA</strong><br />
J van Wyk <strong>DWA</strong><br />
T Makombe <strong>DWA</strong><br />
T Masike <strong>DWA</strong><br />
P Pyke <strong>DWA</strong><br />
P Herbst <strong>DWA</strong><br />
B Mwaka <strong>DWA</strong><br />
T Ntili <strong>DWA</strong><br />
P Ramunenyiwa <strong>DWA</strong><br />
LR Tloubatla <strong>DWA</strong><br />
AG Visser <strong>DWA</strong><br />
B Malakoane Bloem Water<br />
MD Kgwale Bloem Water<br />
M Tuck Bloem Water<br />
L E van Oudtshoorn Bloem Water<br />
L Ntoyi Mangaung Municipality<br />
M Tsomela Mangaung Municipality<br />
K Mokhoabane Mangaung Municipality<br />
G Fritz Mangaung Municipality<br />
N Knoetze Orange-Riet WUA and Lower Modder WUA<br />
C Wessels Kalkveld WUA<br />
Mr Moshounyane Department of Rural Development and Land Reform<br />
R Jacobs Free State Agriculture<br />
H Grobler Free State Agriculture<br />
<strong>Interventions</strong> <strong>Report</strong> June 2012
Water Reconciliation Strategy Study for the Large Bulk Water Supply Systems: Greater Bloemfontein Area vi<br />
TABLE OF CONTENTS<br />
<strong>Page</strong> No<br />
1. BACKGROUND ..................................................................................................... 1<br />
1.1 SCOPE OF THE PROJECT .......................................................................................................... 1<br />
1.2 STUDY AREA ................................................................................................................................ 1<br />
2. CURRENT INFRASTRUCTURE ............................................................................ 3<br />
2.1 THE GREATER BLOEMFONTEIN AREA WATER SUPPLY SYSTEM ......................................... 3<br />
2.1.1 The Caledon – Bloemfontein Transfer ............................................................................ 3<br />
2.1.2 The Maselspoort Scheme ............................................................................................... 3<br />
2.1.3 The Novo Transfer Scheme ............................................................................................ 5<br />
2.2 POTABLE WATER BULK INFRASTRUCTURE ............................................................................ 5<br />
2.3 MAJOR WASTEWATER TREATMENT WORKS .......................................................................... 5<br />
3. AVAILABLE SUPPLY ............................................................................................ 6<br />
3.1 SURFACE WATER ........................................................................................................................ 6<br />
3.1.1 Caledon River Sub-catchment ........................................................................................ 6<br />
3.1.2 Modder River Sub-catchment ......................................................................................... 6<br />
3.1.3 Riet River Sub-catchment ............................................................................................... 7<br />
3.1.4 Upper Orange River ....................................................................................................... 7<br />
3.1.5 Lesotho ........................................................................................................................ 7<br />
3.2 GROUN<strong>DWA</strong>TER .......................................................................................................................... 7<br />
3.3 SUMMARY OF WATER RESOURCES SERVING THE GREATER<br />
BLOEMFONTEIN AREA ................................................................................................................ 7<br />
4. WATER REQUIREMENTS................................................................................... 10<br />
4.1 EXISTING REQUIREMENTS ...................................................................................................... 10<br />
4.1.1 Urban Water Requirements of the Greater Bloemfontein Area ..................................... 10<br />
4.1.2 Breakdown of Urban Consumption ............................................................................... 12<br />
4.1.3 Agricultural Water Requirements .................................................................................. 13<br />
4.2 FUTURE WATER REQUIREMENT ............................................................................................. 15<br />
4.2.1 Understanding growth in Water Requirements ............................................................. 15<br />
4.2.2 Population Growth Rates .............................................................................................. 15<br />
4.2.3 Economic Growth Rates ............................................................................................... 16<br />
4.2.4 Future Water Requirement Scenarios .......................................................................... 16<br />
4.2.5 Agricultural Water Requirements .................................................................................. 18<br />
5. WATER BALANCE .............................................................................................. 19<br />
5.1 THE ORANGE RIVER SYSTEM ................................................................................................. 19<br />
5.2 THE GREATER BLOEMFONTEIN AREA ................................................................................... 20<br />
6. ISSUES WHICH COULD IMPACT ON THE RECONCILIATION OF SUPPLY<br />
AND REQUIREMENT .......................................................................................... 21<br />
7. INTERVENTIONS SELECTED FOR PRELIMINARY EVALUATION ................. 22<br />
7.1 PROCESS ................................................................................................................................... 22<br />
7.2 OBJECTIVES OF THE PRELIMINARY SCREENING WORKSHOP ........................................... 22<br />
7.3 SCREENING WORKSHOP STARTER DOCUMENT .................................................................. 22<br />
<strong>Interventions</strong> <strong>Report</strong> June 2012
Water Reconciliation Strategy Study for the Large Bulk Water Supply Systems: Greater Bloemfontein Area vii<br />
7.4 ATTENDANCE AT WORKSHOP ................................................................................................. 23<br />
7.5 SELECTION CRITERIA ............................................................................................................... 23<br />
7.5.1 Methodology ................................................................................................................. 23<br />
7.5.2 Costing ...................................................................................................................... 24<br />
7.5.3 Outcomes of Preliminary Screening Workshop ............................................................ 24<br />
7.5.4 Refinement of Selected Potential <strong>Interventions</strong> ............................................................ 24<br />
8. SELECTED POTENTIAL INTERVENTIONS ....................................................... 25<br />
A1 & A2 EFFICIENT USE OF WATER AND LOSS MANAGEMENT ......................................................... 28<br />
B1. RANGE OF INTERVENTIONS .................................................................................................... 34<br />
B2. AGRICULTURAL IRRIGATION AUDIT UPSTREAM OF MASELSPOORT<br />
WEIR WITH IMPROVEMENT FOR CATCHMENT C52A ............................................................ 38<br />
C1. UTILISING SURPLUS CAPACITY IN THE ORANGE RIVER BY PUMPING TO<br />
KNELLPOORT DAM FROM GARIEP DAM ................................................................................. 43<br />
C2. UTILISING SURPLUS CAPACITY IN THE ORANGE RIVER BY PUMPING TO<br />
KNELLPOORT DAM FROM VANDERKLOOF DAM ................................................................... 46<br />
C3. UTILISING SURPLUS CAPACITY IN THE ORANGE RIVER BY PUMPING TO<br />
KNELLPOORT DAM FROM BOSBERG / BOSKRAAI DAM ........................................................ 49<br />
C4. MODIFICATIONS TO WELBEDACHT DAM: EXTEND SCOUR OPERATIONS &<br />
LOWER OUTLETS ...................................................................................................................... 53<br />
C5. MODIFICATIONS TO CALEDON-MODDER SYSTEM ................................................................ 55<br />
C6. POLIHALI DAM – LESOTHO HIGHLANDS PHASE 2 ................................................................. 61<br />
D1. PLANNED DIRECT RE-USE – NEW NORTH EASTERN ........................................................... 66<br />
D2. PLANNED INDIRECT RE-USE - TRANSFER TO<br />
UPSTREAM OF MOCKES DAM ................................................................................................. 68<br />
D3. PLANNED INDIRECT RE-USE – KRUGERSDRIFT DAM ........................................................... 70<br />
D4. PLANNED DIRECT RE-USE – BLOEMSPRUIT .......................................................................... 72<br />
D5. RE-USE OF TREATED EFFLUENT – DIRECT USE: IRRIGATION ............................................ 74<br />
E. GROUN<strong>DWA</strong>TER ........................................................................................................................ 77<br />
E1. IKGOMOTSENG AQUIFER ......................................................................................................... 80<br />
E2. BLOEMFONTEIN AQUIFER ........................................................................................................ 83<br />
E3. THABA NCHU AQUIFER ............................................................................................................ 87<br />
E4, 5, 6, AND 7. TOWN GROUN<strong>DWA</strong>TER INTERVENTIONS ............................................................... 90<br />
E4. REDDERSBURG TOWN GROUN<strong>DWA</strong>TER INTERVENTIONS .................................................. 91<br />
E5. EDENBURG TOWN GROUN<strong>DWA</strong>TER INTERVENTIONS ......................................................... 94<br />
E6. DEWETSDORP TOWN GROUN<strong>DWA</strong>TER INTERVENTIONS .................................................... 97<br />
E7. WEPENER TOWN GROUN<strong>DWA</strong>TER INTERVENTIONS ......................................................... 100<br />
E8. GROUN<strong>DWA</strong>TER INTERVENTIONS BASED ON WELLFIELDS NEXT TO / IN THE<br />
VICINITY OF PIPELINE – DE HOEK RESERVOIR ................................................................... 103<br />
E9. GROUN<strong>DWA</strong>TER INTERVENTIONS BASED ON WELL FIELDS NEXT TO / IN THE<br />
VICINITY OF PIPELINE – LIEUKOP OFF-TAKE CHAMBER .................................................... 105<br />
F. WATER TRADING ..................................................................................................................... 108<br />
SECTION G ..................................................................................................................... 110<br />
G1. TUNNEL FROM CALEDON ....................................................................................................... 111<br />
G2. NEW DAM ON THE CALEDON RIVER ..................................................................................... 112<br />
G3. TRANSFER OF MINE WATER .................................................................................................. 113<br />
9. REFERENCES ................................................................................................... 114<br />
<strong>Interventions</strong> <strong>Report</strong> June 2012
Water Reconciliation Strategy Study for the Large Bulk Water Supply Systems: Greater Bloemfontein Area viii<br />
TABLES<br />
Table 3.1: Summary of Primary Surface Water Resources ........................................................................ 8<br />
Table 3.2: Adjustment of the Yield to Incorporate Recent Operating Information and Hydrology ................ 8<br />
Table 3.3: Factors with Potential to Influence Net System Yields ............................................................... 9<br />
Table 4.1: Metered Bulk Water Consumption for Towns Supplied with Water from<br />
the Greater Bloemfontein System (Excluding Groundwater) .................................................... 10<br />
Table 5.1: Orange River Water Balance ................................................................................................... 19<br />
FIGURES<br />
Figure 1.1: Study Area ................................................................................................................................. 2<br />
Figure 2.1: Greater Bloemfontein Water Supply Scheme ............................................................................ 4<br />
Figure 4.1: Metered Bulk Water Supplied from the Greater Bloemfontein System ..................................... 11<br />
Figure 4.2: MMM Water Consumption ....................................................................................................... 12<br />
Figure 4.3: Current Water Use for Bloemfontein ........................................................................................ 12<br />
Figure 4.4: Current Water Use for Botshabelo ........................................................................................... 13<br />
Figure 4.5: Current Water Use for Thaba Nchu ......................................................................................... 13<br />
Figure 4.6: Registered Water Use and Resource Allocation in the Quaternary Catchments Surrounding<br />
the Greater Bloemfontein Area ................................................................................................ 14<br />
Figure 4.7: Water Requirement Scenarios for the Study Area ................................................................... 17<br />
Figure 5.1: Surface Water Balance for Study Area .................................................................................... 20<br />
Aurecon electronic file reference: P:\Projects\402992 Bloem Recon\FINAL REPORTS\<strong>Interventions</strong> <strong>Report</strong>.docx<br />
<strong>Interventions</strong> <strong>Report</strong> June 2012
Water Reconciliation Strategy Study for the Large Bulk Water Supply Systems: Greater Bloemfontein Area 1<br />
1. BACKGROUND<br />
1.1 Scope of the Project<br />
In order to prevent the anticipated shortages in water supply to the Greater Bloemfontein Area, the<br />
Department of Water Affairs (<strong>DWA</strong>) initiated a Reconciliation Strategy Study to explore supply and demand<br />
side interventions that can be implemented to meet anticipated future water requirements. The purpose of<br />
the Reconciliation Strategy Study was thus to develop an implementation plan of action to ensure that the<br />
supply of water can meet present and future requirements. The Strategy thus provides a programme of<br />
studies and other investigations that need to take place so that the necessary interventions are timeously<br />
investigated to the appropriated level of detail.<br />
The objective of this study is to develop a strategy that will set out a course of action to ensure adequate<br />
and sustainable reconciliation of future water requirements in the Greater Bloemfontein Area for at least 25<br />
years. This study:<br />
1. Investigated future water requirements scenarios for the Greater Bloemfontein Area;<br />
2. Investigated possible water conservation and water demand management (WC/WDM) interventions,<br />
groundwater interventions, re-use of treated effluent, and possible future surface water resource<br />
development options;<br />
3. Investigated possible scenarios for reconciling the requirements for water with the available<br />
resources; and<br />
4. Provides recommendations for development and implementation of interventions and actions<br />
required.<br />
This report describes the interventions that were investigated.<br />
1.2 Study Area<br />
The study area comprises those areas served by the large bulk water supply systems which serve the<br />
Greater Bloemfontein Area, which includes Bloemfontein, Thaba Nchu, Botshabelo, Wepener,<br />
Dewetsdorp, Reddersburg, and Edenburg. Furthermore, the future water requirements of the rural villages<br />
surrounding Thaba Nchu, which currently receive water from groundwater sources, werel also be taken<br />
into consideration. In addition to the urban and rural water requirements, agricultural water requirements<br />
also formed part of this study, as these water requirements also impact on the reconciliation of supply and<br />
requirement. The study area is shown in Figure 1.1.<br />
<strong>Interventions</strong> <strong>Report</strong> June 2012
Water Reconciliation Strategy Study for the Large Bulk Water Supply Systems: Greater Bloemfontein Area 2<br />
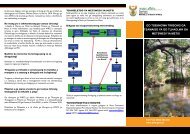
Figure 1.1: Study Area<br />
The boundary of the Primary Study Area was<br />
developed using the municipal boundary of MLM<br />
and secondary catchments within which<br />
Bloemwater operates<br />
The boundary of the Secondary Study Area<br />
includes the secondary catchments draining<br />
into the Caledon River<br />
<strong>Interventions</strong> <strong>Report</strong> June 2012
Water Reconciliation Strategy Study for the Large Bulk Water Supply Systems: Greater Bloemfontein Area 3<br />
2. CURRENT INFRASTRUCTURE<br />
2.1 The Greater Bloemfontein Area Water Supply System<br />
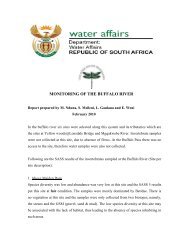
Bloem Water is the main supplier of bulk potable water to urban centres in the Modder / Riet subcatchment.<br />
In order to meet current water requirements, water is transferred from the Orange and Caledon<br />
River Systems. The main transfer water supply schemes are: (1) the Caledon – Bloemfontein transfer<br />
which supplies Bloemfontein, Dewetsdorp, and small users from Welbedacht Dam, (2) the Maselspoort<br />
Scheme, and (3) the Caledon – Modder (also known as the Novo Transfer Scheme) which supplies water<br />
via the Rustfontein Treatment Works to Bloemfontein, Botshabelo, and Thaba Nchu. A brief description of<br />
these transfer schemes is provided in the following sections. The bulk water supply system serving the<br />
Greater Bloemfontein Area is shown in Figure 2.1.<br />
2.1.1 The Caledon – Bloemfontein Transfer<br />
The Caledon-Bloemfontein pipeline was commissioned in 1974 to supply potable water from the<br />
Welbedacht Dam on the Caledon River to Bloemfontein, Botshabelo, Thaba Nchu, Dewetsdorp,<br />
Reddersburg, and Edenburg. As sediment deposition has significantly reduced the yield from Welbedacht<br />
Dam, Knellpoort Dam was commissioned to supplement the supply. Situated just downstream of<br />
Welbedacht Dam is the Welbedacht Water Treatment Works (WTW) with a capacity of 145 Ml/day. This<br />
water is pumped after purification via a 6.5 km pressure pipeline and a 106 km gravity pipeline to<br />
Bloemfontein. The average capacity of the pipeline is 1.7 m 3 /s and the maximum capacity 1.85 m 3 /s. This<br />
infrastructure is owned and operated by Bloem Water.<br />
2.1.2 The Maselspoort Scheme<br />
The Maselspoort Scheme includes the Maselspoort WTW (110 Ml/day) and the Maselspoort Weir, which is<br />
located on the Modder River downstream of Mockes Dam (which is downstream of the Rustfontein Dam).<br />
The Maselspoort WTW supplies approximately 25% of Bloemfontein’s water needs and is owned and<br />
operated by the Mangaung Metropolitan Municipality (MMM).<br />
<strong>Interventions</strong> <strong>Report</strong> June 2012
Water Reconciliation Strategy Study for the Large Bulk Water Supply Systems: Greater Bloemfontein Area 4<br />
Figure 2.1: Greater Bloemfontein Water Supply Scheme<br />
<strong>Interventions</strong> <strong>Report</strong> June 2012
Water Reconciliation Strategy Study for the Large Bulk Water Supply Systems: Greater Bloemfontein Area 5<br />
2.1.3 The Novo Transfer Scheme<br />
The Novo Transfer Scheme, which became operational in 1998, includes Tienfontein Pump Station, a<br />
pipeline and canal from Tienfontein pump station to the Knellpoort Dam, Knellpoort Dam, and the Novo<br />
Pump Station and pipeline.<br />
.<br />
The Novo pump station, which is situated on the northern side of the Knellpoort Dam, transfers water from<br />
Knellpoort Dam to the Modder River (current installed capacity is approximately 1.5 m 3 /s), via a 20 km<br />
pipeline running from Knellpoort Dam to the headwaters of the Modder River. From the outfall of the Novo<br />
pipeline water flows down the Modder River to Rustfontein Dam, a distance of ± 50 km. Water stored in<br />
Rustfontein Dam is treated at the Rustfontein WTW and pumped to Botshabelo/Thaba Nchu or<br />
Bloemfontein. As an alternative, water can be released from Rustfontein Dam to flow downstream into<br />
Mockes Dam from where it can be abstracted at the Maselspoort Weir, treated at Maselspoort WTW, and<br />
pumped to Bloemfontein. The above infrastructure is owned by <strong>DWA</strong> and operated by Bloem Water.<br />
2.2 Potable Water Bulk Infrastructure<br />
Bloem Water supplies about 100 million m 3 /a to about 580 000 people and is the main supplier of bulk<br />
potable water to the urban centres in the Modder / Riet River sub-catchment. The total current capacity of<br />
reservoirs serving the Greater Bloemfontein is 425 Ml (this includes Mangaung Municipality reservoirs). The<br />
capacity of Bloem Water’s bulk reservoirs is 278 Ml.<br />
The Thaba Nchu and Botshabelo reservoirs have capacities of 156 Ml and 52 Ml respectively.<br />
Bloem Water, together with Mangaung Metropolitan Municipality, owns and operates four WTW with<br />
associated infrastructure, namely: Welbedacht WTW (145 Ml/d), Rustfontein WTW (100 Ml/d), Groothoek<br />
WTW (18 Ml/d) and Maselspoort WTW (110 Ml/d).<br />
2.3 Major Wastewater Treatment Works<br />
The following Wastewater Treatment Works (WWTW) serve Bloemfontein/Mangaung:<br />
a) Bloemspruit (56 Ml/day);<br />
b) Sterkwater (10.2 Ml/day);<br />
c) Welvaart (6 Ml/day);<br />
d) Bainsvlei (5 Ml/day);<br />
e) Northern Works (1 Ml/day); and<br />
f) Bloemdustria (
Water Reconciliation Strategy Study for the Large Bulk Water Supply Systems: Greater Bloemfontein Area 6<br />
3. AVAILABLE SUPPLY<br />
3.1 Surface Water<br />
Nearly 70% of the total surface runoff, which would flow through the Upper Orange Water Management<br />
Area (WMA) under natural conditions, originates from Lesotho and just more than 30% from within the<br />
WMA. The surface water resources, both within the WMA and in Lesotho, are well developed and have a<br />
high degree of utilisation.<br />
The two largest dams in this WMA are the Gariep and Vanderkloof dams, which reduce the incidence of<br />
floods in the Lower Orange WMA by about 50%. Other major dams are the Welbedacht and Knellpoort<br />
dams in the Caledon catchment and the Krugersdrift, Rustfontein, and Kalkfontein dams in the Modder-Riet<br />
River catchment. A description of the major dams per sub-catchment is provided in the following sections.<br />
3.1.1 Caledon River Sub-catchment<br />
The Welbedacht Dam is situated on the Caledon River and supplies water to urban users in Bloemfontein,<br />
Botshabelo, Dewetsdorp, and various other smaller users, as well as irrigators downstream of Welbedacht<br />
Dam along the Caledon River. The irrigators downstream of Welbedacht Dam have no claim to any water<br />
stored in Welbedacht Dam. Only the inflow can be released for irrigation purposes. The Welbedacht WTW<br />
at Welbedacht Dam supplies water via the Caledon-Bloemfontein pipeline to Bloemfontein, Botshabelo, and<br />
other minor consumers.<br />
Due to the decreasing yield of the Welbedacht Dam as a result of siltation and the increasing demand on<br />
the Caledon-Bloemfontein Regional Water Supply Scheme, the <strong>DWA</strong> supplemented the yield of the<br />
Welbedacht Dam by constructing the Knellpoort off-channel storage dam on the Rietspruit, a tributary of the<br />
Caledon River. Knellpoort Dam is supplied with water from the Caledon River by the Tienfontein Pump<br />
station. Water pumped from the Caledon River into Knellpoort Dam is then released back into the Caledon<br />
River to allow abstraction at Welbedacht Dam by Bloem Water all year round. Furthermore, the Novo<br />
Transfer pump station is located at the Knellport Dam and is able to transfer water into the Modder River,<br />
which supplied the Rustfontein and Mockes Dams.<br />
Since 1973, when Welbedacht Dam was completed, the dam has lost more than 90% of its storage<br />
capacity due to the high siltation rates. Since there is minimal storage capacity in Welbedacht Dam, the<br />
Tienfontein pumps must operate at a high reliability on a run-of-river basis to supply Knellpoort Dam. The<br />
current pumps have a total discharge of approximately 2.5 m 3 /s (design 3 m 3 /s) and have experienced high<br />
maintenance costs as a result of fine debris and sediment which reach the pumps.<br />
Tienfontein pump station is seen as the most critical component of the water supply infrastructure supplying<br />
Bloem Water with raw water, as Bloem Water receives approximately 70% of its water supply from<br />
Welbedacht Dam (via Tienfontein Pump station and Knellpoort Dam).<br />
3.1.2 Modder River Sub-catchment<br />
Krugersdrift Dam is located on the Modder River and supplies water for irrigation purposes to the Modder<br />
River Government Water Scheme. More than 50 weirs are constructed in the Modder River between the<br />
dam wall and the confluence with the Riet River.<br />
Mockes Dam on the Modder River supplies water to Bloemfontein via the Maselspoort WTW. Groothoek<br />
Dam is located on the Kgabanyane River, a tributary of the Modder River, and supplies water to Thaba<br />
Nchu.<br />
<strong>Interventions</strong> <strong>Report</strong> June 2012
Water Reconciliation Strategy Study for the Large Bulk Water Supply Systems: Greater Bloemfontein Area 7<br />
Rustfontein Dam is located on the Modder River and forms the major storage reservoir in the Modder River.<br />
Water is released from Rustfontein Dam to supplement the abstraction from Mockes Dam and currently<br />
provides the major portion of water supplied to Bloemfontein at Maselspoort.<br />
3.1.3 Riet River Sub-catchment<br />
Tierpoort Dam is situated on a tributary of the Riet River upstream of Kalkfontein Dam and supplies water<br />
to the Tierpoort Irrigation Board through a network of unlined canals.<br />
Kalkfontein Dam is on the Riet River and supplies water for irrigation through a network of canals and<br />
syphons to the Riet River Government Water Scheme. Urban water is also supplied to the towns<br />
Koffiefontein and Jacobsdal through the canal system.<br />
3.1.4 Upper Orange River<br />
The Gariep Dam and the Vanderkloof Dam are the two largest reservoirs in South Africa and are both<br />
situated in the Upper Orange River. These two reservoirs form the main component of the Orange River<br />
Project and are utilised to supply water to urban and irrigation users. They are also used for hydro power<br />
generation and flood control.<br />
3.1.5 Lesotho<br />
The Katse Dam in the Senqu sub-area is used for transfer of water to the Upper Vaal WMA. Mohale Dam,<br />
in the same sub-area, is also used to transfer water to the Upper Vaal WMA. Metlolong Dam in, which is<br />
under construction in Lesotho on a tributary of the Caledon River, will be completed in 2013. It will supply<br />
water to Maseru and surrounding towns.<br />
3.2 Groundwater<br />
Groundwater is currently not utilised for the supply of potable water to Bloemfontein. However, groundwater<br />
is used by individuals for irrigation of gardens in residential areas and groundwater is used extensively for<br />
agricultural purposes in the Bainsvlei / Kalkveld area and in the area to the south-west of Bloemfontein.<br />
Groundwater is also utilised by small industry for bottling of water as well as micro irrigation of vegetables<br />
and nurseries (garden centres), which are in close proximity to the city limits.<br />
Small towns and communities in the vicinity of Bloemfontein, such as Dewetsdorp, Reddersburg, Edenburg,<br />
Wepener, and Excelsior, are partially dependent on groundwater for drinking and domestic purposes.<br />
Groundwater is therefore considered as an essential resource, specifically for the smaller towns.<br />
3.3 Summary of Water Resources Serving the Greater Bloemfontein Area<br />
The Greater Bloemfontein area currently utilises surface water from three primary sources, namely the<br />
Welbedacht/Knellpoort system, Rustfontein Dam and Mockes Dam. The historical firm yields of these<br />
sources of raw water (excluding river and other conveyance losses) have been determined in previous<br />
studies and verified in this study to be as shown in Table 3.1, where the registered water use is also<br />
shown.<br />
<strong>Interventions</strong> <strong>Report</strong> June 2012
Water Reconciliation Strategy Study for the Large Bulk Water Supply Systems: Greater Bloemfontein Area 8<br />
Table 3.1: Summary of Primary Surface Water Resources<br />
Source Registered Water Use (Mm 3 ) Yield (Mm 3 )<br />
Rustfontein Dam 9.74<br />
Mockes Dam 14.8<br />
8<br />
Groothoek Dam 0.74<br />
Welbedacht/Knellpoort System 37 92<br />
Totals 62.28 100<br />
In the current study, the yield analyses conducted in previous studies were first verified and, after that, the<br />
yield model was modified to take account of more recent information on the operation of the system and<br />
additional hydrological data.<br />
The determination of the yield of the combined system is complex and is affected by the assumptions made<br />
about losses in the system and the way in which the system is operated. The yield analysis is described in<br />
detail in the Reconciliation Strategy <strong>Report</strong>, and only the more important results are presented here.<br />
Table 3.2: Adjustment of the Yield to Incorporate Recent Operating Information and Hydrology<br />
Impact<br />
Model Adjustment<br />
on Yield<br />
Implement Tienfontein Pump operation described in "Extension of the capacity of the Novo<br />
Transfer Scheme - Study (EB/2009/5) by V&V Consulting Engineers. According to this<br />
-7<br />
report the pumps transfer 1 m 3 /s when the inflow reaches 4 m 3 /s, 2 m 3 /s when the inflow<br />
reaches 6 m 3 /s and 3 m 3 /s when the inflows reached 10 m 3 /s.<br />
Replace Welbedacht's average WTW capacity of 124 Ml/d with the equivalent seasonal<br />
-4 capacity that is lower in summer (100 Ml/d due to siltation problems) and higher in winter<br />
(145 Ml/d).<br />
-3 Introduce 10% conveyance loss on the pipeline from Welbedacht to Bloemfontein<br />
-3 Reduce Welbedacht live storage from 11.7 to 6.6 million m 3<br />
Replace Caledon System upstream of Welbedacht with a present day streamflow sequence<br />
developed during the Orasecom Study - kindly provided by Bennie Haasbroek. The<br />
-3 demands downstream of Welbedacht from the Orange River System Analysis were retained<br />
while the Orasecom Study was checking why the new demands(14 million m 3 /a) were<br />
significantly lower than the earlier demands (35 million m 3 /a)<br />
Implement Knellpoort Pump operation described in "Extension of the capacity of the Novo<br />
Transfer Scheme - Study (EB/2009/5) by V&V Consulting Engineers. According to this<br />
3<br />
report the transfer varies from 1.5 m 3 /s when the storage level in Knellpoort is above<br />
RL1436 m and 1.67 m 3 /s at RL1452.1 m.<br />
Model 35 million m<br />
1<br />
3 /a irrigation located d/s Welbedacht Dam d/s of the dam (as opposed to<br />
u/s) and release all water up to 2 m 3 /s flowing into Welbedacht when Knellpoort +<br />
Rustenberg Storage > 150 Mm 3 , reduce to 25% (0.5 m 3 /s) when less<br />
-16 Total net impact<br />
When various operational constraints and the estimated environmental water requirements downstream of<br />
Welbedacht Dam, as well as existing and proposed agricultural water requirements, which include the<br />
water requirements for resource poor farmers, are taken into account, the combined historical firm yield<br />
shown in Table 3.1 is reduced by 16 million m 3 /a to 84 million m 3 /a. The factors contributing to this<br />
reduction are shown in Table 3.2.<br />
<strong>Interventions</strong> <strong>Report</strong> June 2012
Water Reconciliation Strategy Study for the Large Bulk Water Supply Systems: Greater Bloemfontein Area 9<br />
There are a number of factors which have potential influences on the available yield of the Greater<br />
Bloemfontein System and therefore potential impacts on the water availability and reconciliation of supply<br />
and requirement. These factors are shown in Table 3.3 below together with the potential consequential<br />
impact on the available system yield.<br />
Table 3.3: Factors with Potential to Influence Net System Yields<br />
Factor which could Influence Available Yield<br />
Impact of Metolong Dam. Metolong Dam which is situated on a tributary of<br />
the Caledon River will start impounding water in approximately mid-2012.<br />
This will have an impact on the flows into the Caledon River and will<br />
subsequently reduce the amount of yield available.<br />
Impact of Environmental Water Requirement: When the EWR<br />
requirements are implemented on the Caledon River, there will be less<br />
surplus water available to transfer to Knellpoort Dam and therefore there will<br />
be a reduction in the overall yield of the system<br />
Capacity of Welbedacht WTP: Due to the high turbidity of the raw water,<br />
especially during flood events it is not possible to operate Welbedacht WTP<br />
at full capacity throughout the year. A discussion with the operator of the<br />
WTP suggested that the WTP could operate at full capacity of 145 Ml/d in<br />
winter, but only managed an output of between 90 and 100 Ml/d in summer<br />
when the silt load in the river was higher. The yield could be increase if the<br />
WTP was operated a full capacity all year round<br />
Operation of Knellpoort Dam: Due to the high electricity costs of pumping<br />
surplus water from the Caledon River into Knellpoort Dam, Knellpoort Dam<br />
has in the past been operated up to a maximum capacity of approximately<br />
60%. This operational rule would decrease the available yield of the system<br />
Risk of non supply as a result of continuous failure (bursts) on the<br />
Welbedacht pipeline:<br />
Impact on Yield<br />
(million m 3 /a)<br />
<strong>Interventions</strong> <strong>Report</strong> June 2012<br />
-1<br />
-2.21<br />
+7.06<br />
The construction of Metolong Dam and the implementation of the Environmental Water Requirements are<br />
two interventions which will be implemented in the short term. It is therefore proposed that the impact on<br />
the yield of these two interventions is factored into the scenario planning and should ultimately form the<br />
baseline available yield. For planning purposes the historical firm yield of the system with these<br />
interventions in place was therefore assumed to be 81 million m 3 /a.<br />
-3.3<br />
-6.86
Water Reconciliation Strategy Study for the Large Bulk Water Supply Systems: Greater Bloemfontein Area 10<br />
4. WATER REQUIREMENTS<br />
4.1 Existing Requirements<br />
4.1.1 Urban Water Requirements of the Greater Bloemfontein Area<br />
Bulk water consumption data (2006 to 2009) provided by Bloem Water (BW) and MMM is summarised in<br />
Table 4.1. Groundwater is utilised by some of the smaller towns to augment water supply. The abstraction<br />
of groundwater for bulk water supply has not been included in Table 4.1.<br />
Table 4.1: Metered Bulk Water Consumption for Towns Supplied with Water from the Greater<br />
Bloemfontein System (Excluding Groundwater)<br />
Year/<br />
Supplier<br />
2008 2009 2010 2011<br />
BW MMM Total BW MMM Total BW MMM Total BW MMM Total<br />
Town million m 3 /a million m 3 /a million m 3 /a million m 3 /a<br />
Bloemfontein 40.66 20.31 60.97 35.83 30.13 65.97 37.1 27.71 64.82 37.91 22.72 60.63<br />
Botshabelo 8.18 8.18 9.21 9.21 7.87 7.87 10.06 10.06<br />
Thaba Nchu 5.14 5.14 4.64 4.64 6.04 6.04 6.3 6.3<br />
Excelsior 0.17 0.17 0.16 0.16 0.19 0.19 0.17 0.17<br />
Wepener 0.80 0.80 0.82 0.82 0.75 0.75 0.74 0.74<br />
Dewetsdorp 0.84 0.84 0.92 0.92 0.96 0.96 0.76 0.76<br />
Reddersburg 0.85 0.85 0.86 0.86 0.69 0.69 0.43 0.43<br />
Edenburg 0.53 0.53 0.53 0.53 0.53 0.53 0.43 0.43<br />
Total 57.19 20.31 77.48 52.97 30.13 83.11 54.13 27.71 81.84 56.80 22.72 79.52<br />
Mangaung Metropolitan Municipality purchases approximately two thirds of its potable water form Bloem<br />
Water. Table 4.1 shows the amount of bulk water which was supplied from the Bloem Water System and<br />
from MMM’s own sources for the period 2008 through to 2011. From Table 4.1 it is evident that the water<br />
supplied to smaller towns accounts for only 4% of the total bulk water consumption.<br />
Figure 4.1 below shows the bulk water supplied from the Greater Bloemfontein System from 1992 through<br />
to 2011. With the exception of the period 1999 through to 2001 and the last two years there has been a<br />
year on year positive growth in water requirement.<br />
<strong>Interventions</strong> <strong>Report</strong> June 2012
Water Reconciliation Strategy Study for the Large Bulk Water Supply Systems: Greater Bloemfontein Area 11<br />
Figure 4.1: Metered Bulk Water Supplied from the Greater Bloemfontein System<br />
The following is noted with regard to the historical water consumption for Bloemfontein and surrounds<br />
since 1993:<br />
Period of 1993 to 1999: An average annual increase in water consumption of approximately 9% per<br />
annum possibly triggered by an improvement in levels of service and delivery of basic services through<br />
the Government’s various infrastructure programs. In addition, a significant number of people from<br />
surrounding areas (urban and rural centres) relocated to Bloemfontein for employment and other<br />
economic opportunities.<br />
Period of 2003 to 2009: An average annual increase in water consumption of approximately 5.8% per<br />
annum. This could possibly be attributed to a growth in local economy, supported by an improvement<br />
in levels of services in the poorer communities through various government projects like the<br />
eradication of the bucket system, provision of on-site water projects, and numerous low income<br />
housing projects.<br />
Period of 2010 to 2011: A decrease in water requirement possibly due to above average rainfall in the<br />
two years, and also potentially the implementation of Water Conservation/Water Demand<br />
Management.<br />
The average long term growth rate in the water requirement for the period 1993 through to 2011<br />
(18 year period) was 5% per annum.<br />
Figure 4.2 below shows the annual system input volume of MMM (bulk purchases from Bloem Water as<br />
well as Maselspoort production) as well as the authorised consumption. The difference between the bulk<br />
water purchases and the authorised consumption (billed authorised and unbilled authorised) represents the<br />
apparent and real losses in the system.<br />
<strong>Interventions</strong> <strong>Report</strong> June 2012
Water Reconciliation Strategy Study for the Large Bulk Water Supply Systems: Greater Bloemfontein Area 12<br />
Figure 4.2: MMM Water Consumption<br />
The following conclusions can be drawn from Figure 4.2.<br />
1) Losses have increased significantly since 2006.<br />
2) The real and apparent losses in the system are 30 million m 3 /a. This represents approximately 37.5%<br />
of the annual system input volume.<br />
3) Authorised water consumption has been growing at an average rate of 3% per annum over the<br />
period 2007 through to 2010 and on average by 1.7 % over the period 2005 through to 2010.<br />
4.1.2 Breakdown of Urban Consumption<br />
Figure 4.3, Figure 4.4 and Figure 4.5 provide a breakdown of potable water use as derived from the<br />
2006/07 Water Service Development Plan for Bloemfontein, Botshabelo, and Thaba Nchu. More recent<br />
figures were unfortunately not available. In the Bloemfontein area, “unaccounted for water” constitutes 39%<br />
of the total annual consumption. The second largest water consumption, accounting for 37% of the total<br />
annual consumption, is “residential use”. Thirteen percent of the water is used for commercial purposes,<br />
8.5% is classified as other, and 2% for industrial water.<br />
Figure 4.3: Current Water Use for Bloemfontein<br />
<strong>Interventions</strong> <strong>Report</strong> June 2012
Water Reconciliation Strategy Study for the Large Bulk Water Supply Systems: Greater Bloemfontein Area 13<br />
In Botshabelo, the largest proportion of the current water use is residential use, representing 40.5% of the<br />
total use. “Unaccounted for water” comprises 31% of the total metered bulk water supplied. Commercial<br />
use accounts for 20% and other supply accounts for 8%.<br />
Figure 4.4: Current Water Use for Botshabelo<br />
In Thaba Nchu, physical losses (unaccounted for water) accounts for 94% of the total water use, while<br />
residential and commercial use accounts for 3.5% respectively.<br />
Figure 4.5: Current Water Use for Thaba Nchu<br />
4.1.3 Agricultural Water Requirements<br />
For the purposes of this study, agricultural water requirements were considered in two areas, namely:<br />
1) in the Modder-Riet Catchment upstream of Krugersdrift Dam; and<br />
2) along the Caledon River.<br />
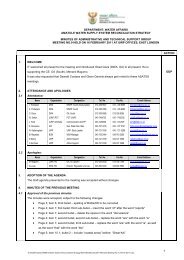
Figure 4.6 shows the registered water use and resource allocation in the quaternary catchments<br />
surrounding the Greater Bloemfontein Area. Based on the allocations to the different water sectors<br />
(agriculture and urban), it is evident that the two sectors do not share any allocation from dams situated<br />
within the Modder-Riet Catchment upstream of Krugersdrift Dam.<br />
In terms of the yield modelling of the Welbedacht/Knellpoort System, the existing agricultural water<br />
requirements along the Caledon River, both upstream and downstream of Welbedacht Dam, and the<br />
proposed water requirements of the resource poor farmers, were taken into account.<br />
<strong>Interventions</strong> <strong>Report</strong> June 2012
Water Reconciliation Strategy Study for the Large Bulk Water Supply Systems: Greater Bloemfontein Area 14<br />
Figure 4.6: Registered Water Use and Resource Allocation in the Quaternary Catchments Surrounding the Greater Bloemfontein Area<br />
<strong>Interventions</strong> <strong>Report</strong> June 2012
Water Reconciliation Strategy Study for the Large Bulk Water Supply Systems: Greater Bloemfontein Area 15<br />
4.2 Future Water Requirement<br />
4.2.1 Understanding growth in Water Requirements<br />
The prediction of water requirements for master planning purposes, or for a study of this nature, is usually<br />
based on the primary drivers of water demand, which are population growth and local economic growth.<br />
These two factors are interlinked to some extent, as economic growth may stimulate population growth as a<br />
result of migration from the rural areas or other urban area with a poor economy. There are also numerous<br />
other factors that can impact future water requirements, and specifically for the Greater Bloemfontein area,<br />
these may include:<br />
Change in the level of service, as improvements in the water services, sanitation, and health<br />
awareness will most likely impact on future requirement scenarios. Typical initiatives in the study<br />
area include the eradication of water and sanitation backlogs linked to the UN Millennium Goals, as<br />
well as the delivery of houses to the poor to meet SA National target with regard to housing.<br />
The impact of HIV/AIDS is a significant factor, with the highest occurrence in the rural areas of South<br />
Africa.<br />
Improvement in water management in terms of water meter coverage, the extent and accuracy of<br />
meter reading and billing, and the effectiveness of credit control policies.<br />
The historic growth in water requirement has not been consistent, and has fluctuated quite significantly.<br />
The water growth has included periods of negative or relatively flat growth possibly as a result of above<br />
average rainfall being experienced in these specific years.<br />
Water use, when expressed on a per capita basis, is in the region of 200 litres per person per day. There<br />
are uncertainties, however, associated with the future population growth rate figures as described below.<br />
4.2.2 Population Growth Rates<br />
Population growth rates are based on the birth rate, mortality rate, and migration. The following sources<br />
and references were found which described the historic and possible future population growth rates.<br />
Information taken from the IDP report 2007/2008 for Mangaung Metropolitan Municipality indicates<br />
that the future population growth rate for Bloemfontein will be 3.1% per annum. The growth in<br />
population between 1996 and 2001 based on 2001 Census figures for the Bloemfontein areas was<br />
estimated to be 3.1% per annum.<br />
A report entitled “Identification of Bulk Engineering Infrastructure in Support of Housing Development<br />
in Mangaung, Masterplan prepared for Mangaung Metropolitan Municipality determined that the<br />
anticipated population growth figures for Bloemfontein up to 2030 would be 1% per annum<br />
Population projection scenarios were also developed for the All Towns study for Central Region<br />
(June 2009). This study proposed two alternative population growth scenarios, a High Population<br />
Growth Scenario and a Low Population Growth Scenario. The high population growth scenario<br />
translates to an aggregate population growth rate for Bloemfontein, Botshebelo and Thaba Nchu of<br />
1% per annum, whilst the low population growth scenario translates to an aggregate population<br />
growth rate of 0% per annum<br />
Migration is proportional to economic growth rate, implying a strong economic growth will result in<br />
“immigration” whereas a decline in economic growth will result in “emigration”. Migration figures that<br />
could be relevant to the study area were sourced from Provincial trends as abstracted from the “2009<br />
StatsSA Mid-Year Projections for the Orange Free State Province (2006 to 2011 Projection)”.<br />
Migration affects the rural and smaller towns more significantly, as a result of people seeking<br />
economic and employment opportunities in the larger urban centres. Migration is assumed to vary<br />
between 0.00% and 0.25% for Bloemfontein and Botshabelo, assuming more people migrating to,<br />
and residing in these towns. For the smaller towns with less economic opportunity, the migration<br />
<strong>Interventions</strong> <strong>Report</strong> June 2012
Water Reconciliation Strategy Study for the Large Bulk Water Supply Systems: Greater Bloemfontein Area 16<br />
rates vary from between -0.4% and 0.0%. The assumption is that current residents could be leaving<br />
the smaller towns to reside and seek opportunities in the larger centres.<br />
The impact of HIV/AIDS is a significant factor when estimating population projections, and more<br />
specifically, its influence on the mortality rate. The impact of HIV/Aids relevant to the Study area has<br />
been based on National statistics, where the highest occurrence is in the rural areas of South Africa.<br />
The mortality rate as a result of HIV/Aids has been assumed to be as high as 0.4% for the urban<br />
towns, and as high as 0.75% for the rural towns and villages.<br />
4.2.3 Economic Growth Rates<br />
Bloemfontein is currently the largest urban centre, followed by Botshabelo and Thaba Nchu and most public<br />
and private investment will be in these areas. The latest Integrated Development Plan (IDP) projects that<br />
Bloemfontein will remain the focus for future development as it is predicted that Bloemfontein will house<br />
approximately 65% of the total population by 2016.<br />
The economy of the MMM plays a significant role in the Motheo District economy (92,5%) as well as the<br />
Free State economy (25,5%), but it is relatively small when compared to the national economy (1,6%).<br />
Of importance is the relatively small share of the local agriculture, mining and manufacturing sectors<br />
compared to the province and the country. Mining’s small share is understandable as the Mangaung area<br />
competes with the Goldfields area, which is very strong in mining, however the share of agriculture and<br />
manufacturing is disturbingly low. On the other hand, the tertiary sector of the local economy is very<br />
significant within the context of the province.<br />
Approximately 87% of economic production in the MMM area occurs in Bloemfontein while only 7% and 6%<br />
respectively occur in Botshabelo and Thaba Nchu.<br />
The overall annual economic growth rate for the Mangaung area was 3.59% between 2001 and 2004 and a<br />
significantly higher growth of 9.5% occurred between 2004 and 2007. In Bloemfontein an economic growth<br />
rate between 2004 and 2007 of 9.86% was recorded compared with 8.55% in Botshabelo, while that of<br />
Thaba Nchu was considerably less at 5.08% per annum. This confirms the fact that the Bloemfontein<br />
economy is and will be increasing its proportional share of the economy.<br />
While community services contribute to over a third of Mangaung’s economy, other prominent sectors<br />
include finance, retail and trade, transport, and manufacturing. The remaining sectors such as agriculture<br />
and mining are very small and make a minor contribution to the local economy. Community services<br />
contributes 35% to the city’s economy, transport 13%, finance 18%, agriculture 4%, manufacturing 8%,<br />
trade 16%, utilities 3% and construction 3%.<br />
Growth in the transport sector, given the strategic central location of Bloemfontein, is likely to be stimulated<br />
by increasing economic activity elsewhere in the country.<br />
4.2.4 Future Water Requirement Scenarios<br />
The following assumptions were made for the development of the future water requirement scenarios from<br />
the Greater Bloemfontein Water Supply System.<br />
High Growth Water Requirement Scenario will take place on account of high population growth<br />
rate and high economic growth rates. Given the relatively low population projection growth rates<br />
and the contrasting relatively high historic growth in water requirements (the authorised billed and<br />
unbilled water consumption figures for the last 3 years have grown at a rate of 3% per annum) it<br />
was decided to use long term historical growth rate of 3% per annum as the basis for the high<br />
growth scenario.<br />
<strong>Interventions</strong> <strong>Report</strong> June 2012
Water Reconciliation Strategy Study for the Large Bulk Water Supply Systems: Greater Bloemfontein Area 17<br />
Low Growth Water Requirement Scenario will take place on account of low population growth<br />
and low economic growth. It was decided to base the low growth scenario on a growth in water<br />
requirement of 1% per annum.<br />
Figure 4.7 presents the proposed high and low water requirement scenarios. The actual water requirement<br />
is also shown on the graph. The high and low water requirement projections have been projected from the<br />
2009 base for the following reasons:<br />
There were significant summer rains in the 2011 and this may have resulted in a depressed<br />
demand.<br />
It is still too early to ascertain whether or not the drop in 2010 can be ascribed to structural reasons<br />
(e.g. improved metering, WC/WDM) or is as a result of climatic influences.<br />
It is conservative to plan from a higher base. As future years actual water requirements become<br />
known, the base from which the projections are made can always be changed.<br />
Figure 4.7: Water Requirement Scenarios for the Study Area<br />
Important Qualification<br />
High Growth Scenario (3%)<br />
Actual Water Requirement<br />
Low Growth Scenario (1% p.a.)<br />
It is important to note that the water requirement scenarios presented above were developed during a<br />
global economic crisis. The global recession and a slow recovery from this recession are likely to have<br />
significant implications for water requirement growth projections for the Greater Bloemfontein Water Supply<br />
System.<br />
The implications of the recession for the strategy to meet future water requirements are as follows:<br />
The economic uncertainty increases uncertainty concerning the growth in water requirements.<br />
Water use must be continuously and carefully monitored;<br />
Future scenarios/projections need to be revised frequently, based on updated information;<br />
Planning to increase water availability needs to be as flexible as possible; and<br />
<strong>Interventions</strong> that are more flexible in terms of timing should be favoured, all other considerations<br />
being equal.<br />
<strong>Interventions</strong> <strong>Report</strong> June 2012
Water Reconciliation Strategy Study for the Large Bulk Water Supply Systems: Greater Bloemfontein Area 18<br />
4.2.5 Agricultural Water Requirements<br />
The only expected growth in irrigation requirements is the allocation of 12 000 ha to resource poor farmers.<br />
The effect of the 12 000 ha (4 000 ha for the Upper Orange WMA, 4 000 ha for the Lower Orange WMA,<br />
and 4 000 ha for the Fish-Tsitsikamma WMA) is estimated to be in the region of 114 m³/a. The<br />
Implementation Strategy for the development of 3 000 ha irrigation in the Free State Province indicates that<br />
there is ± 200 ha available near Ficksburg (Caledon River) and ± 2 000 ha available next to the Orange-<br />
Riet Canal, which starts at the Vanderkloof Dam. The agricultural water requirement for the 200 ha near<br />
Ficksburg was taken into account in the determination of the available yield.<br />
<strong>Interventions</strong> <strong>Report</strong> June 2012
Water Reconciliation Strategy Study for the Large Bulk Water Supply Systems: Greater Bloemfontein Area 19<br />
5. WATER BALANCE<br />
5.1 The Orange River System<br />
The Upper Orange WMA is a component of the extended Orange and Vaal River System. This has been<br />
the subject of various water balance and reconciliation studies. The latest water balance from the Orange<br />
River system indicated a surplus of 333 million m³/a for the year 2000. This surplus yield reduced to 158<br />
million m³/a in 2003 when Mohale Dam was commissioned, due to the fact that more water could be<br />
transferred out of the system to the Upper Vaal WMA. Although the Mohale Dam increased the local yield<br />
in the Upper Orange, the increase in yield is transferred to the Upper Vaal WMA and cannot be used in the<br />
Upper or Lower Orange WMAs. The effect of Mohale Dam can be seen in that the surplus yield is reduced<br />
from 333 million m³/a to 158 million m³/a.<br />
When the effect of the 12 000 ha earmarked for resource poor farmers is taken into account, the surplus of<br />
158 million m³/a will reduce further to only 44 million m³/a. This surplus is reserved for the growth in<br />
demands in the urban, industrial, and mining sectors in the Upper Orange WMA, the Lower Orange, and<br />
the Fish to Tsitsikamma WMAs.<br />
The future Polihali Dam site is situated on the Senqu River approximately 1.5 km downstream of the<br />
confluence of the Senqu and Khubelu Rivers. Polihali Dam would increase the water delivered from<br />
Lesotho Highlands Water Project to the high value industries in the Vaal catchment, but would, in the long<br />
term, result in a reduction in the water available at downstream Gariep and Vanderkloof dams. It is<br />
envisaged that the Polihali Dam would reduce the yield of the Orange River downstream by approximately<br />
283 million m 3 . This is based on the assumption that overall yield of the system increases by 182 million<br />
m 3 /a but an additional 465 million m 3 /a might be transferred to Gauteng, causing a shortfall of 283 million<br />
m 3 /a (465 – 182 = 283).<br />
Table 5.1 shows a mass water balance of the Upper Orange WMA.<br />
Table 5.1: Orange River Water Balance<br />
Surplus Yield<br />
(million m 3 )<br />
Year 2000 Surplus Yield 333<br />
Less Transfer to Gauteng from Mohale Dam (impact on Orange River) -175<br />
Net available yield 158<br />
Less Allocation for Resource Poor Farmers -114<br />
Net current available yield for growth in urban water requirements 44<br />
Less growth in urban, industrial, and mining sectors in the Upper Orange WMA, the<br />
Lower Orange, and the Fish to Tsitsikamma WMAs (NWRS 2025 base case)<br />
-90<br />
Net deficit in Yield in 2025 -46<br />
Less Transfer to Gauteng from Polihali Dam (impact on Orange River in 2053) -283<br />
Anticipated net deficit in 2053 (will be higher with additional growth in urban<br />
water requirements)<br />
-329<br />
The Upper Orange WMA has a large commitment to support the local water requirements and transfers to<br />
the Upper Vaal WMA, the Fish to Tsitsikamma WMA, as well as release obligations to the Lower Orange<br />
WMA. A number of augmentation interventions have been identified to provide additional yield to the<br />
Orange River System to make up the envisaged shortfall caused by transfers from Polihali Dam to the<br />
Gauteng area. Some of the interventions identified include: using the lower level storage in Vanderkloof<br />
Dam; the construction of Bosberg/Boskraai Dams; and the raising of Gariep Dam.<br />
<strong>Interventions</strong> <strong>Report</strong> June 2012
Water Reconciliation Strategy Study for the Large Bulk Water Supply Systems: Greater Bloemfontein Area 20<br />
It is the intention of the <strong>DWA</strong> to initiate a separate reconciliation strategy study on the Orange River<br />
System, which will draw on the information from the Greater Bloemfontein Reconciliation Strategy Study.<br />
5.2 The Greater Bloemfontein Area<br />
The anticipated surplus yield in the Orange River System (including the Caledon River) is approximately 44<br />
million m³/a. According to the Internal Strategic Perspective for the Upper Orange River WMA, this surplus<br />
is reserved for the growth in demands in the urban, industrial, and mining sectors in the Upper Orange<br />
WMA, the Lower Orange, and the Fish to Tsitsikamma WMAs.<br />
It is not anticipated that there will be any further growth in agricultural water requirements in the Greater<br />
Bloemfontein Area (with the exception of the allocation made to the resource poor farmers). As the<br />
agricultural sector and urban sector in the Greater Bloemfontein Area and surrounds do not share any yield<br />
from a common surface water resource, it is possible to undertake a reconciliation of supply and<br />
requirement based on the current urban water requirements and available yield of the surface water<br />
schemes serving the Greater Bloemfontein area and surrounds.<br />
Figure 5.1 illustrates the comparison of available surface water supply and current water requirements for<br />
the High and Low water requirement scenarios in the Greater Bloemfontein Area. The current water<br />
requirement (based on 2009 data) is approximately 83 million m 3 /a while the available supply is 84 million<br />
m 3 /a (Historical Firm Yield).<br />
High Growth Scenario (3%)<br />
Figure 5.1: Surface Water Balance for Study Area<br />
Low Growth Scenario (1% p.a.)<br />
It appears that the 2009 water requirement was in balance with available supply (historical firm yield)<br />
and any increase in use (as predicted by the high and low water requirement scenarios) would put the<br />
system at risk. The higher the growth in water requirements, the higher the risk would be. It is clear<br />
that measures to increase the surety of supply need to be implemented as soon as possible. This<br />
includes measures to increase the supply of water as well as WC/WDM measures to reduce the<br />
demand.<br />
<strong>Interventions</strong> <strong>Report</strong> June 2012
Water Reconciliation Strategy Study for the Large Bulk Water Supply Systems: Greater Bloemfontein Area 21<br />
6. ISSUES WHICH COULD IMPACT ON THE RECONCILIATION OF SUPPLY<br />
AND REQUIREMENT<br />
There are a number of issues which could impact on the reconciliation of supply and requirement in the<br />
longer term. These issues are listed below:<br />
Sedimentation;<br />
Surface and groundwater quality;<br />
Migration of people from the rural areas to the urban centres, particularly Bloemfontein;<br />
Impact of HIV/Aids;<br />
Illegal use of water;<br />
Effectiveness of WC/WDM; and<br />
Existing bulk water supply infrastructure capacity i.e. bulk water pipelines and water treatment works.<br />
<strong>Interventions</strong> <strong>Report</strong> June 2012
Water Reconciliation Strategy Study for the Large Bulk Water Supply Systems: Greater Bloemfontein Area 22<br />
7. INTERVENTIONS SELECTED FOR PRELIMINARY EVALUATION<br />
7.1 Process<br />
The Greater Bloemfontein Reconciliation Strategy study has produced a long-term strategy for the<br />
management of reconciling water supply with demands. Following the determination of the water balance,<br />
the Strategy followed a step-wise process to identify the most favourable interventions, or groups of<br />
interventions, to meet possible future water requirement scenarios. The process is listed below:<br />
Step 1: Identification of interventions<br />
Step 2: Preliminary screening of interventions<br />
Step 3: Key stakeholder review of selected interventions<br />
Step 4: Scenario planning process<br />
Step 5: Review of selected scenarios by the Study Steering Committee 1<br />
Step 6: Obtaining public feedback on the scenarios<br />
Step 7: Implementing interventions and initiating studies of interventions<br />
This document records details of the interventions that were identified in Step 1 and describes the<br />
procedure followed in Step 2, where the preliminary screening of interventions was achieved by means of a<br />
Preliminary Screening Workshop.<br />
Based on the outcomes of the Preliminary Screening Workshop, a preliminary list of interventions that<br />
needed to be investigated further at reconnaissance/pre-feasibility level was documented in the Inception<br />
<strong>Report</strong> which, in turn, informed the first draft of the Preliminary Strategy. A second workshop, held later in<br />
the Study, helped inform the final Strategy. The final strategy includes a list of studies that the <strong>DWA</strong> should<br />
undertake in order to ensure an ongoing reconciliation of supply and requirement.<br />
7.2 Objectives of the Preliminary Screening Workshop<br />
The Preliminary Screening Workshop was intended to present potential interventions in terms of timing,<br />
cost, and yield. Combinations of different interventions were also considered to devise the set of best<br />
possible alternatives to meet the water requirements of the Greater Bloemfontein Area. The objectives of<br />
the initial screening workshop were to:<br />
Assess the acceptability of the various interventions identified in previous studies in terms of<br />
technical, financial, environmental, and social criteria;<br />
Ascertain which intervention or combinations thereof would warrant further investigations at<br />
reconnaissance or pre-feasibility level, and what aspects should be investigated in this study;<br />
Augment the existing information with specialist inputs from the <strong>DWA</strong> and other key stakeholders;<br />
and<br />
Identify any other issues/concerns of stakeholders which could impact on the reconciliation of supply<br />
and requirement.<br />
7.3 Screening Workshop Starter Document<br />
A Screening Workshop Starter Document was drawn up to provide information for discussion purposes.<br />
The content was based on available documentation which could be used for strategic level decisions. The<br />
workshop participants provided further information and critically reviewed the information contained in the<br />
Starter Document.<br />
1 The Study Steering Committee includes representatives from <strong>DWA</strong> Head Office and <strong>DWA</strong> Regional Office, Mangaung Metropolitan<br />
Municipality, Motheo District Municipality, Naledi Municipality, Bloem Water, Department of Agriculture, Department of Rural<br />
Development and Land Reform, and water user associations.<br />
<strong>Interventions</strong> <strong>Report</strong> June 2012
Water Reconciliation Strategy Study for the Large Bulk Water Supply Systems: Greater Bloemfontein Area 23<br />
For certain of the options presented in the document, an attempt was made to estimate the yields after<br />
allowance for the best available estimate of the Reserve. It is however acknowledged that provisional<br />
Reserve estimates present a degree of uncertainty. Nevertheless, an attempt was made to at least show a<br />
reasonable order of magnitude of its potential impact.<br />
The purpose of the Starter Document was to provide adequate background material to facilitate informed<br />
discussion at the Screening Workshop in order to confirm the development options that may warrant further<br />
investigation. This report is based on the Starter Document, but the original data on potential interventions<br />
that was contained in that document has been replaced, wherever possible, by more reliable information<br />
that became available in the course of developing the Strategy.<br />
7.4 Attendance at workshop<br />
The workshop attended by identified <strong>DWA</strong> staff, the consultant team and supporting specialists, officials<br />
from Bloem Water, representatives from MMM, representatives from the irrigation boards / WUAs, and<br />
members of the Study Steering Committee.<br />
7.5 Selection criteria<br />
7.5.1 Methodology<br />
The screening of the various interventions was based on a number of criteria, namely:<br />
Potential scheme yields, inclusive of the impact of the Reserve;<br />
Updated financial cost estimates and unit reference values (URVs);<br />
Socio-economic impacts; and<br />
Environmental impacts.<br />
Non-starter (also known as “red flag”) interventions were identified, and criteria under which such<br />
interventions would be considered again were also identified. Each criterion was assigned a colour-coded<br />
rating, based on how favourable the intervention was rated for that particular criterion.<br />
A three tier rating system, as follows, was used:<br />
Favourable<br />
Moderately favourable<br />
Unfavourable<br />
The following diagram illustrates three hypothetical cases:<br />
SCHEME<br />
NAME<br />
CRITERIA<br />
URV Socio-economic Environmental Comments<br />
Scheme 1 Red flag intervention<br />
Scheme 2 Further investigation<br />
Scheme 3 URV unfavourable<br />
<strong>Interventions</strong> <strong>Report</strong> June 2012
Water Reconciliation Strategy Study for the Large Bulk Water Supply Systems: Greater Bloemfontein Area 24<br />
Those operations which appeared to be obvious non-starters were flagged. Comment was also made as to<br />
the extent of available information and whether the technology had been successfully utilised previously or<br />
elsewhere in the country or internationally.<br />
7.5.2 Costing<br />
Where possible, capital costs were based on costs available from previous studies. These costs were<br />
then escalated based on Contract Price Adjustment (CPA) indices to be representative of the base year<br />
costs (June 2009).<br />
An evaluation period of 50 years was selected for all water augmentation schemes, for determination of<br />
URVs. Discount rates of 6%, 8%, and 10% were used in URV calculations, to cater for funding by both<br />
MLM and the <strong>DWA</strong>. Multiplication factors were applied to allow for additional costs as follows:<br />
Preliminary and General costs of 20% were first added to the capital costs;<br />
A 10% Contingency sum was then added to the previous sub-total;<br />
A 15% Professional fees/site supervision sum was further added to the previous sub-total, to get the<br />
total construction cost estimate;<br />
The total construction cost estimate was spread over the first two financial years in the URV<br />
calculation; and<br />
VAT is excluded in URV calculations<br />
Equipment replacement periods for pumps (mechanical and electrical), pipelines, etc and desalination<br />
membranes were not considered.<br />
Capital costing and determination of URVs was undertaken at a conceptual level. Potential future electricity<br />
increases were not allowed for in URV calculations. Demand profile was assumed to be constant. Cost of<br />
electricity was assumed to be 35c/kWh for Eskom and 58c/kWh for Centlec (the local distributer). The<br />
Centlec supply was assumed for the water re-use options.<br />
7.5.3 Outcomes of Preliminary Screening Workshop<br />
The proceedings of the Preliminary Screening Workshop are bound into this document as Appendix 1. The<br />
comments and recommendations made at the workshop were taken into account when refining proposed<br />
interventions and developing reconciliation scenarios during the remainder of the study.<br />
7.5.4 Refinement of Selected Potential <strong>Interventions</strong><br />
After the Preliminary Screening Workshop, selected interventions were refined by improving cost estimates<br />
and carrying out more detailed determinations of the effects that the interventions would have on the yield<br />
of the water resources system if implemented. The refined interventions, as used for the final scenarios, are<br />
described in the remainder of this document. Details of estimates of capital and operating and maintenance<br />
costs for the interventions are contained in Appendix 2 and the calculation of unit reference values is shown<br />
in Appendix 3.<br />
<strong>Interventions</strong> <strong>Report</strong> June 2012
Water Reconciliation Strategy Study for the Large Bulk Water Supply Systems: Greater Bloemfontein Area 25<br />
8. SELECTED POTENTIAL INTERVENTIONS<br />
SECTION A: Urban Water Conservation and Demand Management<br />
A1: Efficient use of water<br />
A2: Loss management<br />
SECTION B: Agricultural Water Conservation and Demand Management<br />
B1: A range of <strong>Interventions</strong> is described<br />
B2: Agricultural Irrigation Audit Upstream of Maselspoort - Weir with Improvement for<br />
Catchment C52A<br />
SECTION C: Surface Water <strong>Interventions</strong><br />
C1: Utilising surplus capacity in the Orange River system by pumping to Knellpoort Dam from Gariep<br />
Dam<br />
C2: Utilising surplus capacity in the Orange River system by pumping to Knellpoort Dam from<br />
VanderKloof Dam<br />
C3: Utilising surplus capacity in the Orange River system by pumping to Knellpoort Dam from Bosberg /<br />
Boskraai Dam<br />
C4: Modifications to Welbedacht Dam: Extend scour operations & Lower Outlets<br />
C5: Modifications to Caledon Modder System.<br />
C6: Polihali Dam – Lesotho Highlands Phase 2<br />
SECTION D: Re-use of treated effluent<br />
D1: Planned direct re-use – New North Eastern<br />
D2: Planned indirect re-use – Transfer to upstream of Mockes Dam<br />
D3: Planned indirect re-use – Krugersdrift Dam<br />
D4: Planned direct re-use – Bloemspruit<br />
D5: Re-use of treated effluent – Direct use: irrigation<br />
SECTION E: Groundwater<br />
E1: Ikgomotseng aquifer<br />
E2: Bloemfontein aquifer<br />
E3: Thaba Nchu aquifer<br />
E4: Reddersburg aquifer<br />
E5: Edenburg aquifer<br />
E6: Dewetsdorp aquifer<br />
E7: Wepener aquifer<br />
E8a: Well field developments along the route of the existing pipelines: De Hoek Reservoir (Caledon<br />
pipeline)<br />
E8b: Well field developments along the route of the existing pipelines: Lieukop Off-take Chamber<br />
(Botshabelo / Thaba Nchu pipeline)<br />
SECTION F: Water trading<br />
F1: Water Trading<br />
<strong>Interventions</strong> <strong>Report</strong> June 2012
Water Reconciliation Strategy Study for the Large Bulk Water Supply Systems: Greater Bloemfontein Area 26<br />
SECTION G: Other options<br />
G1: Tunnel from Caledon River to the Modder River<br />
G2: Mine water pumped to Bloemfontein<br />
G3: Alternative storage in the Caledon River<br />
<strong>Interventions</strong> <strong>Report</strong> June 2012
Water Reconciliation Strategy Study for the Large Bulk Water Supply Systems: Greater Bloemfontein Area 27<br />
SECTION A<br />
URBAN WATER<br />
CONSERVATION AND DEMAND<br />
MANAGEMENT<br />
<strong>Interventions</strong> <strong>Report</strong> June 2012
Water Reconciliation Strategy Study for the Large Bulk Water Supply Systems: Greater Bloemfontein Area 28<br />
A1 & A2 Efficient Use of Water and Loss Management<br />
1. INTRODUCTION<br />
As water is a scarce resource, it needs to be used in an efficient and effective manner. Legislation has<br />
been put in place in South Africa to ensure that this requirement is met. Through WC/WDM, the objective is<br />
to ensure the optimal use of water and to minimise water wastage. This can be achieved through a number<br />
of initiatives as listed below, and presented in more detail in this document:<br />
• Improved efficiency<br />
– Efficient appliances: (washing machines, toilet cisterns etc)<br />
– Low flow shower heads<br />
– Water efficient gardens<br />
• Loss management<br />
– Pressure management<br />
– Retrofitting and removal of wasteful devices<br />
– Improved management (sectorisation, metering, billing, legislation)<br />
– Mains replacement<br />
– Leak detection and repair<br />
Inefficient usage is attributed to the fact that water is often used for the service derived from it, rather than<br />
for the water itself. As gardening and toilet flushing (including continuous toilet leaks into the sewerage<br />
system) represent most of the total domestic demand, they are key focus areas for targeting inefficiencies.<br />
If a user does not pay for high consumption of water, due to no or inaccurate metering or insufficient credit<br />
control, that user tends to waste water. Industries and large bulk users would also be target sectors.<br />
The various WC/WDM options are presented as individual options in this document. However, one or a<br />
combination of the above options would be appropriate to achieve an objective in a particular area.<br />
Therefore the respective WC/WDM options should not be considered individually, but rather as a part of an<br />
overall strategy, to achieve a specific objective.<br />
2. INTERVENTION DESCRIPTION<br />
MMM has developed strategies to reduce its unaccounted-for water which is in excess of 40%. There are<br />
four major themes, each theme covering a number of strategies.<br />
Network Losses Strategy<br />
Strategy 1: Development of preventative maintenance strategy<br />
Strategy 2: Implementation of pressure management systems<br />
Strategy 3: Embarking on regular communication to capacitate communities<br />
System Losses Strategy<br />
Strategy 4: Continuous data analyses of account data<br />
Strategy 5: Zoning of the MMM water network with zone meters<br />
Strategy 6: Identify the erven with legal connections without meters<br />
Strategy 7: Identify wrong meter reading or meter tampering<br />
<strong>Interventions</strong> <strong>Report</strong> June 2012
Water Reconciliation Strategy Study for the Large Bulk Water Supply Systems: Greater Bloemfontein Area 29<br />
Behind-Watermeter Losses Strategy<br />
Strategy 8: Educate community on how to perform first line inspections<br />
Strategy 9: Repair any leaks found on site and depending on the pro poor policy<br />
Strategy 10: Focus on improving the quality of service delivered<br />
Willingness to Pay Strategy<br />
Strategy 11: Restrict supply for non payment and excessive use<br />
Strategy 12: investigate technologies for controlling/ dispensing water consumption.<br />
MMM is currently struggling with the full implementation of these strategies. One of the reasons behind this<br />
is that the strategies to address the real and apparent losses are not easy to achieve, as water and<br />
sanitation services has not been captured in a management information systems. A typical management<br />
information systems will include information such as consumer billing data, geographical information<br />
systems (GIS), pressure management information from the pressure reducing valves (PRVs), water flows,<br />
losses and depths in reservoirs, water balances, information from zone meters and other essential services<br />
such as customer relations management.<br />
An estimate of the water use in the Bloemfontein, Botshabelo, and Thaba Nchu areas for the 2006/2007<br />
financial year is given in the table below (information sourced from the WSDP, 2006/2007). The<br />
unaccounted for water (UAW) is 30.87 million m 3 /a, which represents 41% of the bulk water supplied to the<br />
area.<br />
Detailed breakdown for water use in Bloemfontein, Botshabelo and Thaba Nchu Areas (2006/07)<br />
Water sector Use (million m 3 /a)<br />
Bulk Water Supplied 74.95<br />
Metered domestic/commercial and industrial water use 44.08<br />
Actual 41% UAW 30.87<br />
A breakdown of the authorised consumption and water losses within the Bloemfontein/Mangaung area, for<br />
the 2007/2008 financial year, is given in the table below. The total bulk water supplied to the<br />
Bloemfontein/Mangaung area was 62 million m 3 /a. The water losses amounted to 23.7 million m 3 /a (or 39%<br />
of total bulk water supplied to this area).<br />
For the purposes of this Interim Reconciliation Strategy, the WC/WDM interventions have been divided up<br />
into three categories, namely:<br />
Reduction in Bloem Water UAW<br />
Loss management (MLM)<br />
Improved efficiency (MLM)<br />
<strong>Interventions</strong> <strong>Report</strong> June 2012
Water Reconciliation Strategy Study for the Large Bulk Water Supply Systems: Greater Bloemfontein Area 30<br />
Unaccounted for Water – Bloemfontein/Mangaung Area (2007/2008 FY)<br />
Input volume<br />
62.04 million<br />
m 3 /a<br />
Authorised<br />
consumption<br />
(estimated)<br />
38.65 million m 3 /a<br />
62.3%<br />
Water losses<br />
(unaccounted for<br />
water)<br />
23.40 million m 3 /a<br />
3. REDUCTION IN BLOEM WATER UAW<br />
Billed authorised<br />
consumption<br />
32.26 million m 3 /a<br />
52.0%<br />
Unbilled authorised<br />
consumption<br />
6.38 million m 3 /a<br />
10.3%<br />
Apparent losses<br />
7 million m 3 /a<br />
30%<br />
Real losses<br />
16.4 million m 3 /a<br />
70%<br />
Billed metered connections<br />
Billed unmetered connections<br />
Unbilled metered connections<br />
(Free Basic Water)<br />
Unbilled unmetered<br />
connections (communal taps)<br />
Unavoidable losses<br />
Illegal connections<br />
Metering inaccuracies<br />
Mains leaks<br />
Reservoirs overflows<br />
Service connection leaks<br />
Revenue<br />
generating water<br />
32.26 million m 3 /a<br />
52.0%<br />
Non-revenue<br />
generating water<br />
29.78 million m 3 /a<br />
48.0%<br />
The bulk water losses for Bloem Water have been calculated as the difference between the volume of<br />
water abstracted from the various sources and the volume of water sold to consumers. Representatives<br />
from Bloem Water have indicated that their total overall losses are in the vicinity of 12% of the bulk water<br />
treated.The table below unpacks the water losses in the bulk water system network of Bloem Water.<br />
Detailed Breakdown of Water Losses in the Bulk System Network of Bloem Water (BW)<br />
(million m 3 /a)<br />
Financial Year<br />
2005 2006 2007 2008 2009<br />
Bulk water supplied from BW's WTWs 53.13 55.27 59.33 62.40 54.82<br />
Less: Bulk meters to MMM 46.20 49.24 52.05 53.99 49.68<br />
Less: Supply to other Local Authorities 2.01 2.34 3.01 3.20 3.29<br />
Bloem Water Conveyance loss downstream of WTP 4.93 3.69 4.27 5.21 1.85<br />
% water loss downstream of WTP 9.6% 7.0% 7.6% 8.8% 3.6%<br />
Bloem Water abstraction from Source 54.91 58.01 62.60 65.87 57.13<br />
Loss in WTW 1.78 2.74 3.25 3.47 2.30<br />
% water loss in WTW 3.2% 4.7% 5.2% 5.3% 4.0%<br />
Bloem Water Total water loss 6.71 6.43 7.52 8.68 4.15<br />
% Total water loss 12.2% 11.1% 12.0% 13.2% 7.3%<br />
It would appear that conveyances losses are in the order of 7% to 9% per annum. Bloem Water has an<br />
active database monitoring system, where the water losses of the different supply systems are monitored<br />
and respective reports are generated. Each of the regional managers within Bloem Water is responsible for<br />
managing their system water losses. The current levels of water losses do not appear inordinately high.<br />
A significant portion of this water loss could also be attributed to the regular bursts which occur on the<br />
Caledon-Bloemfontein pipeline, which is approximately 50 years old.<br />
<strong>Interventions</strong> <strong>Report</strong> June 2012
Water Reconciliation Strategy Study for the Large Bulk Water Supply Systems: Greater Bloemfontein Area 31<br />
The water loss in the WTWs is in the order of 4% to 5% of the source abstracted volume. The most<br />
significant part of this loss can be attributed to the high sediment loads in the Caledon River, abstracted at<br />
Welbedacht Dam and treated at Welbedacht WTW.<br />
For the purposes of this study it was assumed that no significant water saving could be made through<br />
targeting water losses in the Bloem Water’s supply system.<br />
4. LOSS MANAGEMENT<br />
A 2003/2004 estimate of water consumption in the Bloemfontein/Mangaung area, where the UAW (water<br />
losses) amounted to 23.7 million m 3 /a (or 39% of total bulk water supplied), put the apparent losses at<br />
7.1 million m 3 /a (30% of the total water loss) and the real losses at 16.6 million m 3 /a (70% of the total water<br />
loss). The UAW in the Bloemfontein/Mangaung area of supply for the 2007/2008 financial year was<br />
estimated to be in the region of 23.4 million m 3 /a. For the purposes of this Strategy it was conservatively<br />
assumed that in 2007/2008 a saving of 14.5 million m 3 /a through water loss management could realistically<br />
be achieved for the Bloemfontein/Mangaung area of supply. Examples of water loss management<br />
interventions are given below:<br />
Pressure management;<br />
Retrofitting and removal of wasteful devices;<br />
Improved management (sectorisation, metering, billing, legislation);<br />
Mains replacement; and<br />
Leak detection and repair.<br />
5. IMPROVED EFFICIENCY<br />
The estimated authorised consumptive water use within the Bloemfontein area is estimated to be<br />
38.6 million m 3 /a. It has been assumed that with improved efficiency the town of Bloemfontein could reduce<br />
its authorised consumptive use by 15% or by 5.8 million m 3 /a. It was further assumed that a 15% saving<br />
could also be achieved on the future water requirements projections. Examples of interventions/actions<br />
which could lead to an improved efficiency are given below:<br />
Efficient appliances: (washing machines, toilet cisterns etc);<br />
Low flow shower heads; and<br />
Water-wise gardening practices.<br />
6. SUMMARY OF WC/WDM INTERVENTIONS<br />
The table below shows the potential savings which could be achieved from the interventions described<br />
above. Potential savings estimated for the implementation of water use efficiency and water loss<br />
interventions for the Bloemfontein/Mangaung area of supply have been derived from figures sourced from<br />
the MLM. For the Botshabelo and Thaba Nchu area of supply, and for the smaller towns the same potential<br />
savings percentage has been pro-rated to the actual use to give an overall planning estimate of the total<br />
potential saving that could be achieved.<br />
<strong>Interventions</strong> <strong>Report</strong> June 2012
Water Reconciliation Strategy Study for the Large Bulk Water Supply Systems: Greater Bloemfontein Area 32<br />
Potential Savings that could be Achieved from WC/WDM <strong>Interventions</strong><br />
Type of<br />
Intervention<br />
Reduction in<br />
BW UAW<br />
Bloemfontein<br />
/ Mangaung<br />
(million m 3 /a)<br />
% of<br />
Overall<br />
Supply<br />
Botshabelo and<br />
Thaba Nchu<br />
(million m 3 /a)<br />
Smaller Towns<br />
(million m 3 /a)<br />
Total Based on<br />
Extrapolation<br />
(million m 3 /a)<br />
0 0<br />
Water Loss 14.5 22% 2.5 0.73 17.739<br />
Water Use<br />
Efficiency<br />
6 9% 1.35 0.56 7.65<br />
TOTAL 20.52 3.85 1.03 25.4<br />
The estimated potential water saving as result of water loss interventions in the study area is 17.7 million<br />
m 3 /a (16.5 million m 3 /a + 3.22 million m 3 /a). It is estimated that the potential saving through improved water<br />
use efficiency could be as high as 7.65 million m 3 /a. The following table illustrates the impact of<br />
implementing a water loss intervention to reduce the current UAW from 41% to 17%.<br />
Potential Savings that can be Achieved through the Implementation of Water Loss <strong>Interventions</strong><br />
Use (million m<br />
Water Sector<br />
3 /a)<br />
Bloemfontein, Botshabelo and<br />
Thaba Nchu Areas<br />
Bulk Water Supply metered to MMM and all WSAs 83.15<br />
Less: Estimated potential of water loss interventions by<br />
MLM and WSAs (17.74)<br />
Estimated target bulk water supply metered to MMM<br />
and WSAs 65.42<br />
Less Metered domestic/commercial and industrial<br />
water use (51)<br />
Remaining UAW ** 14.41 (or 17%)<br />
** Note: This is the estimated UAW after the potential water savings have been implemented.<br />
<strong>Interventions</strong> <strong>Report</strong> June 2012
Water Reconciliation Strategy Study for the Large Bulk Water Supply Systems: Greater Bloemfontein Area 33<br />
SECTION B<br />
AGRICULTURAL WATER<br />
CONSERVATION AND DEMAND<br />
MANAGEMENT<br />
<strong>Interventions</strong> <strong>Report</strong> June 2012
Water Reconciliation Strategy Study for the Large Bulk Water Supply Systems: Greater Bloemfontein Area 34<br />
1. INTRODUCTION<br />
B1. Range of <strong>Interventions</strong><br />
Table 1.1 gives a summary of the extent of the irrigation in the Upper Orange River WMA 2 . The water<br />
usage for irrigation in the Upper Orange River Catchment are summarised in Table 1.2.<br />
Table 1.1: Irrigation in the Upper Orange River Catchment<br />
Description<br />
Allocation<br />
(m 3 /ha/year)<br />
Northern<br />
Cape<br />
Area (ha)<br />
Free State Total<br />
Kalkfontein WUA 11 000 3 046.30 3 046.30<br />
Orange-Riet WUA (FS and NC) 11 000 6 714.28 10 257.52 16 971.80<br />
Proposed Modderrivier and Kalkveld WUA 3 8 130/8 640 12 235.73 12 235.73<br />
Proposed Vanderkloof WUA (FS and NC) 11 000 14 079.02 7 106.19 21 185.21<br />
Tierpoort Irrigation Board 9 000 785.71 785.71<br />
Wittespruit (Egmont Dam) Irrigation Board 6 100 857.00 857.00<br />
Caledon River upstream Welbedacht Dam ± 4 200 2 342.00 2 342.00<br />
Caledon River downstream Welbedacht Dam 7 620 2 572.00 2 572.00<br />
Leeuwrivier/Armenia Irrigation Board 6 100 872.70 872.70<br />
Total 20 793,30 40 075.15 60 868.45<br />
2<br />
Implementation strategy for the use of the 3 000 ha surplus water in the Orange River system allocated to the Free State Province,<br />
Department of Agriculture, NS No402137/<strong>Final</strong>, August 08<br />
3<br />
Operation Proposal for Modderrivier and Kalkveld WUA, <strong>DWA</strong>F Bloemfontein, SJ de Wet <strong>Report</strong> No: W00036/R02/Rv03, August 09<br />
<strong>Interventions</strong> <strong>Report</strong> June 2012
Water Reconciliation Strategy Study for the Large Bulk Water Supply Systems: Greater Bloemfontein Area 35<br />
Table 1.2: Irrigation Water Usage in the Upper Orange River Catchment<br />
Description<br />
Allocation<br />
(m 3 /ha/year)<br />
Potential water use x10 3 m 3 /year<br />
Northern<br />
Cape<br />
Free<br />
State<br />
Kalkfontein WUA 11 000 33 509 33 509<br />
Orange-Riet WUA (FS and NC) 11 000 73 858 112 833 186 691<br />
Proposed Modderrivier and Kalkveld WUA 8 113 99 271 99 271<br />
Proposed Vanderkloof WUA (FS and NC) 11 000 154 869 78 168 233 037<br />
Tierpoort Irrigation Board 9 000 7 071 7 071<br />
Wittespruit (Egmont Dam) Irrigation Board 6 100 43 133 43 133<br />
Caledon River upstream Welbedacht Dam ± 4 200 9 836 9 836<br />
Caledon River downstream Welbedacht Dam 7 620 19 599 19 599<br />
Leeuwrivier/Armenia Irrigation Board 6 100 5 324 5 324<br />
Total<br />
Total 228 727 408 744 637 471<br />
During the 1990’s the <strong>DWA</strong>F undertook the “Orange River Replanning Study (ORRS)” to determine the<br />
status of the availability of water in the Orange River system. This study indicated that sufficient water for<br />
the irrigation of an additional 12 000 ha was available. This water was reserved for resource poor farmers.<br />
The water available to all the existing irrigation in the Upper Orange River catchment is fully allocated. In<br />
order to address the problems with conveyance losses and poor efficiencies Water Management Plans<br />
were developed for the Orange-Riet WUA and the Kalkfontein WUA. The system losses in the Orange-Riet<br />
WUA are reported to be ± 20%.<br />
A number of WC/WDM options for improving the efficiency of irrigation water use have been identified and<br />
are briefly described below. No quantitative assessments and URVs of these options have previously been<br />
prepared, and none are presented here.<br />
2. RIVER RELEASE MANAGEMENT<br />
In the Caledon River upstream of the Welbedacht Dam no river release management exists because no<br />
storage is available. The irrigation farmers use off-channel storage dams to store water during the rainy<br />
season and when there is water flow in the Caledon River. Normally the Caledon River upstream of the<br />
Welbedacht Dam stops flowing during August or September, depending on the snowfall and rain during<br />
winter. The towns in the area also use off-channel storage dams for water supply during the time the river<br />
does not flow.<br />
In the Caledon River downstream of the Welbedacht Dam the normal flow is released out of the<br />
Welbedacht Dam. If the inflow is less than 2 m 3 /s then water is stored by Bloem Water and released later<br />
at a flow rate of 2 m 3 /s for downstream irrigation. Water for irrigation downstream of the Welbedacht dam is<br />
only available 80% of the time.<br />
<strong>Interventions</strong> <strong>Report</strong> June 2012
Water Reconciliation Strategy Study for the Large Bulk Water Supply Systems: Greater Bloemfontein Area 36<br />
Water stored in the Kalkfontein Dam (Riet River) is released in the Kalkfontein canal for the irrigation<br />
farmers. No river releases are made.<br />
The Orange-Riet WUA pump water out of the main canal from the Vanderkloof Dam. This water is<br />
transferred and used along the Orange-Riet canal and the Riet River settlement near Jacobsdal. Water is<br />
also released out of the canal system in the Riet River and for irrigation in the lower Modder River up to the<br />
confluence with the Vaal River. These releases and flow in the Orange-Riet canal are managed with<br />
regular flow measurement and telemetry.<br />
The Lower Modder River and Krugersdrift WUA and the Kalkveld WUA selected to become one WUA. This<br />
report will therefore deal with them as one WUA. The Modderrivier and Kalkveld WUA manage the<br />
catchment area of the Modder River from the N1 west to about Kimberley. One sub-area is for farmers with<br />
irrigation out of groundwater. The second sub-area is for irrigation farmers next to the Modder River<br />
downstream of the Krugersdrift Dam. Water releases out of the Krugersdrift Dam are made for irrigation<br />
farmers downstream on request of the farmers. Weirs in the river store the water between releases. The<br />
third sub-area is for the farmers who irrigate with surface water upstream of the Krugersdrift Dam.<br />
Vanderkloof WUA manage the irrigation farmers next to the Orange River from the Vanderkloof Dam<br />
downstream close to the confluence with the Vaal River near Douglas. Water is released in the Main canal<br />
(same as Orange-Riet WUA) and then to the Ramah canal. This water is managed according to the water<br />
application of the farmers next to the canal. The water released in the Orange River is from the<br />
hydroelectric plant managed by Eskom. The <strong>DWA</strong> and Eskom manage these water releases. The<br />
irrigation farmers next to the river abstract the water directly out of the Orange River for irrigation.<br />
3. IRRIGATION PRACTICES<br />
In all the WUAs the on-farm losses occur between the point of abstraction and the field edge. Actual<br />
irrigation technologies are, for the most part, modern and sophisticated and do not leave much room for<br />
improvement. It is recognised that many farmers have installed efficient on-farm irrigation methods such as<br />
pivots, drip, and micro jet. Many farmers are also using the latest technology for irrigation scheduling in<br />
order to use water efficiently. Water saved by efficient water use is utilised by extending the irrigation area,<br />
as farmers pay for the full quota.<br />
4. IRRIGATION CANAL LOSSES<br />
The following WUAs use canals to convey the water: Orange-Riet, Kalkfontein, and Vanderkloof. The<br />
Orange-Riet WUA uses the latest technology to monitor (flow meter and telemetry) and manage the flow in<br />
the canals and the river. The Kalkfontein WUA uses data loggers in the main canal and branch canals to<br />
monitor the flows. Their overall losses in the canals are calculated to be less than 30 %.<br />
Whilst little can be done to reduce evaporation losses, proper maintenance and upgrading of ageing water<br />
distribution infrastructure serving the WUAs, can reduce conveyance losses. The building of a balancing<br />
dam in the Kalkfontein WUA can help to reduce the distribution losses.<br />
5. FARM DAM LOSSES<br />
The Kalkfontein WUA contains a number of private farm dams. It is likely though that the costs associated<br />
with lining of farm dams will be prohibitively expensive.<br />
<strong>Interventions</strong> <strong>Report</strong> June 2012
Water Reconciliation Strategy Study for the Large Bulk Water Supply Systems: Greater Bloemfontein Area 37<br />
6. CROP SELECTION<br />
The type of crop selected for a particular area is the most important factor influencing the quantity of water<br />
required for irrigation. Whilst on the one hand the selection of alternative crop types could reduce water<br />
requirements, the potential income must also be taken into account. Planting low value “thirsty” crops in<br />
water scarce areas should be avoided.<br />
7. CROP DEFICIT IRRIGATION<br />
This is a technique aimed at providing controlled water stress by periodically irrigating at less than the full<br />
irrigation demand of the crop. It offers the opportunity to take maximum advantage of the available yield.<br />
This technique requires meticulous monitoring of soil moisture content, well-designed irrigation systems and<br />
proper management of pruning and fertilising.<br />
8. METERING<br />
The metering of all irrigation releases from source to point of abstraction from canals, and to field<br />
application is necessary to provide a detailed understanding of utilization and losses. This would assist in<br />
defining the benefits to be obtained from the various WC/WDM measures, in controlling abstractions and<br />
usage by irrigators, and in billing for water actually consumed. Very limited metering of irrigation usage<br />
currently takes place for abstraction out of the river.<br />
In the Vanderkloof, Modderrivier, and Kalkveld WUA unlawful irrigation takes place. In the Orange-Riet<br />
WUA a method of satellite images and crop water use figures are used to calculate the water use. If the<br />
irrigators disagree a water meter must be installed at his cost. Implementing similar methods can reduce<br />
the unlawful irrigation.<br />
<strong>Interventions</strong> <strong>Report</strong> June 2012
Water Reconciliation Strategy Study for the Large Bulk Water Supply Systems: Greater Bloemfontein Area 38<br />
B2. Agricultural Irrigation Audit Upstream of Maselspoort<br />
Weir with Improvement for Catchment C52A<br />
1. INTRODUCTION<br />
The extent of the irrigation upstream of the Maselspoort Weir to the Rustfontein Dam is unknown and<br />
therefore the impact on water availability is unknown. This area is not part of any Water User<br />
Association and is therefore managed by the Department of Water Affairs. The area is included in the<br />
quaternary catchment of C52A-F. Table 1.1 gives a summary of the extent of the irrigation in the<br />
Catchment according to the WARMS data.<br />
Quaternary catchment C52A is upstream of the Rustfontein Dam and includes the Upper- and Lower<br />
Kromspruit, the Modder River and Gannaspruit. De Wetsdorp is near the start of the Modder River.<br />
Rustfontein Dam is included in the catchment.<br />
Quaternary catchment C52B is north of Rustfontein Dam and includes the towns Botshabelo,<br />
Thaba Nchu, Tweefontein, Groothoek, Springfontein and Gladstone. The Klein Modder River,<br />
Wildebeesspruit, Sepane and Kgabanyane drain this area to the Modder River between Rustfontein<br />
Dam and confluence with the Sepane.<br />
Quaternary catchment C52C Is north of C52B and the Korannaspruit and Steynspruit drain this<br />
catchment to the Modder River. The small towns in this catchment are Modutung, Spitskop, Merino and<br />
Rooifontein.<br />
Quaternary catchment C52D is drained by the Matjiespruit and Koringspruit with the Modder River<br />
from the Sepane confluence into the Mockes Dam.<br />
Quaternary catchment C52E is drained by the Klein Osspruit and the Osspruit. The Modder River<br />
from the Mockes Dam flows into the Maselspoort weir, where water is supplied to the Maselspoort<br />
waterworks. The quaternary catchment stops downstream of the Maselspoort weir at the Glen<br />
Agricultural College.<br />
Quaternary catchment C52F is drained by the Bloemspruit, Rietspruit en Renostersspruit. The<br />
Bloemspruit drains most of the city Bloemfontein, including water from the Sewage Disposal works.<br />
Table 1.1: Irrigation in the Quaternary Catchment Areas According to WARMS Data<br />
Quaternary<br />
Catchment Area<br />
Irrigation<br />
ha<br />
Registered Volume<br />
m 3<br />
Water Use<br />
m 3 /ha<br />
C52A 612 5 427 992 8 868<br />
C52B 421 2 163 920 5 140<br />
C52C 237 1 095 338 4 616<br />
C52D 298<br />
Irrigation only<br />
17 075 127<br />
2 118 760<br />
57 363<br />
7 118<br />
C52E 779 3 640 846 4 671<br />
C52F 1 957 13 713 277 7 008<br />
Total 4 304 43 116 500<br />
<strong>Interventions</strong> <strong>Report</strong> June 2012
Water Reconciliation Strategy Study for the Large Bulk Water Supply Systems: Greater Bloemfontein Area 39<br />
2. STUDY METHODOLOGY<br />
The study was done on the bases of quaternary catchments. The quaternary catchment shape files<br />
were used to create the following:<br />
Group cultivation land per catchment, with base data from the Agricultural geo-referenced information<br />
system.<br />
Farm boundaries per catchment.<br />
Rivers, streams and dams per catchment.<br />
By using the rivers and streams layer a 3 km buffer zone on both banks were created. The<br />
digitised cultivation land layer was reduced to the buffer zone. The digitised cultivation land was further<br />
reduced by selecting the pivots (round circles) and deselecting cultivation lands bigger than 10 ha.<br />
This was done because the practice of irrigation without pivots on bigger than 10 ha is highly unlikely.<br />
The following assumptions were made:<br />
No water is pumped more than 3 km from a river or stream. Centre pivots are irrigation.<br />
No irrigation are done on cultivation lands bigger than 10 ha excluding pivots. No dams were taken in<br />
consideration.<br />
3. STUDY FINDINGS<br />
The results are presented on Figures A.1 to A.7 in Annexure A. Table 3.1 gives the extent of the<br />
irrigation in the Catchments according to the WARMS data, pivot irrigation and other irrigation.<br />
Table 3.1: Irrigation in the Quaternary Catchment Areas<br />
Quaternary<br />
Catchment Area<br />
WARM<br />
S<br />
Irrigation in ha<br />
Confidence level<br />
%<br />
Pivots Other Total Pivots Other<br />
C52A 612 218 2 951 3 169 90 60<br />
C52B 421 0 1 087 1 087 90 60<br />
C52C 237 38 910 948 90 60<br />
C52D 298 15 1 453 1 468 90 60<br />
C52E 779 378 3 449 3 827 90 60<br />
C52F 1 957 649 2 014 2 663 90 60<br />
Total 4 304 1 298 11 864 13 162<br />
4. OBSERVATIONS DURING THE STUDY<br />
The following observations were made during the study:<br />
There are surface dams in the area and there are a tendency that irrigation are developed around<br />
these dams. Because of these assumptions, about 5 % of the total irrigation were not captured.<br />
The confidence level that pivots are irrigation are high. The 90 % confidence is because the<br />
mapping was done by other persons in 2008. New irrigation development was possible and was<br />
not measured.<br />
The confidence level of assumed irrigation are only 60 %. The confidence level of this can be<br />
higher if satellite images of two or more seasons are available to verify the cultivation patterns. The<br />
area of assumed irrigation will reduce by about 20 to 40 % when the cultivation patterns are known.<br />
Some of the WARMS data allocated to a Quaternary Catchment area, projected outside the<br />
Catchment. This will be rectified with the verification and validation process.<br />
Dam information also needs to be more accurate.<br />
<strong>Interventions</strong> <strong>Report</strong> June 2012
Water Reconciliation Strategy Study for the Large Bulk Water Supply Systems: Greater Bloemfontein Area 40<br />
5. FARM DAM LOSSES<br />
The catchment areas contain a number of private farm dams. Losses out of farm dams due to<br />
evaporation were not taken into account.<br />
6. NEXT STEPS TO IMPROVE ON THE CONFIDENCE<br />
In order to further improve on the confidence level of the study a recent Landsat 7 or Spot satellite image<br />
of the area for two or more seasons are needed. This will be used to:<br />
1. See if there are new developments. (Satellite image from <strong>DWA</strong>)<br />
2. Improve on the split between irrigation and dry land fields.<br />
3. Site visits to verify 20% of the largest areas.<br />
4. Summary of above information in a report, tables etc and persent at a meeting.<br />
As a test to determine the accuracy of the assumptions a satellite image dated 2008-08-16 for<br />
Catchment C52A was used to identify irrigation more accurately. Out of this the following was<br />
determined:<br />
No cultivated land bigger than 10 ha indicate possible irrigation.<br />
By using the satellite image to select cultivated lands smaller than 10 ha, next to dams and rivers, the<br />
area of proposed irrigation changed from 2 951 ha to 1 427 ha.<br />
The satellite image was for a winter season, where this is a summer planting region and a January or<br />
February image will give a better indication.<br />
This 52 % reduction in proposed irrigation show the importance of the satellite image test to the data.<br />
7. WATER USE BY THE IRRIGATION<br />
The type of crop planted in a particular area is the most important factor influencing the quantity of water<br />
required for irrigation. In order to estimate the water use by the irrigation the type of crops need to be<br />
established. This can only be done with a visit to the site. The other important issue is whether they plant<br />
one or two crops in a year. Out of the WARMS data the water use calculated to be between 4 616<br />
m3/ha/year to 8 868 m3/ha/year. If the crops are known PLANWAT can be used to calculate the crop<br />
water requirement per Quaternary Catchment Area.<br />
Whilst on the one hand the selection of alternative crop types could reduce water requirements, the<br />
potential income must also be taken into account. Planting low value “thirsty” crops in water scarce<br />
areas should be avoided.<br />
8. IMPROVEMENT FOR CATCHMENT C52A<br />
A recent Spot 5 satellite image was obtained from the Department of Water Affairs. Unfortunately the<br />
date of the image is not known and therefore the season is not known.<br />
8.1 See i f there are New Developments (Satellite Image From <strong>DWA</strong>)<br />
No new developments were observed on the Satellite image between the new image and the one dated<br />
2008-08-16.<br />
8.2 Improve on the Split Between Irrigation and Dry Land Fields<br />
The satellite image for Catchment C52A was used to split the irrigation and dry land fields.<br />
All fields in Catchment C52A that shown green was digitised and the area was determined. This<br />
area exclude the pivot irrigation.<br />
<strong>Interventions</strong> <strong>Report</strong> June 2012
Water Reconciliation Strategy Study for the Large Bulk Water Supply Systems: Greater Bloemfontein Area 41<br />
Each of the 199 fields identified were enlarged to identify possible irrigation. All the<br />
irrigation fields, excluding pivots, identified were smaller than 10 ha.<br />
Because only one satellite image was supplied, double cropping could not be determined.<br />
The date and season of the satellite image is not known and therefore crop water use could not be<br />
determined.<br />
Table 8.1: Irrigation in the Quaternary Catchment C52A<br />
Quaternary<br />
Irrigation in ha Confidence Level %<br />
Catchment<br />
Area<br />
WARMS Pivots Other Total Pivots Other<br />
First estimate 612 218 2 951 3 169 90 60<br />
Satellite Image 2008-08-16 612 140 1 427 1 567 90 70<br />
Satellite Image supplied by <strong>DWA</strong><br />
all cultivated fields<br />
612 140 1 654 1 794 90 75<br />
Satellite Image supplied by <strong>DWA</strong><br />
selected as irrigation<br />
612 140 466 606 90 90<br />
8.3 Conclusion<br />
The 78 ha of pivot irrigation that was not planted can still be seen as irrigation. A next season will<br />
improve the estimate of the irrigation. The verification and validation process in the Upper Orange River<br />
will be done in the next two years and beter WARMS information should be available after the process is<br />
complete.<br />
<strong>Interventions</strong> <strong>Report</strong> June 2012
Water Reconciliation Strategy Study for the Large Bulk Water Supply Systems: Greater Bloemfontein Area 42<br />
SECTION C<br />
SURFACE WATER<br />
INTERVENTIONS ON THE<br />
ORANGE RIVER<br />
<strong>Interventions</strong> <strong>Report</strong> June 2012
Water Reconciliation Strategy Study for the Large Bulk Water Supply Systems: Greater Bloemfontein Area 43<br />
C1. Utilising Surplus Capacity in the Orange River by<br />
Pumping to Knellpoort Dam from Gariep Dam<br />
1. SCHEME DESCRIPTION<br />
The information presented in this section has been derived from the Orange River Development Project<br />
Replanning Study (ORP study), dated May 1998. The aforementioned study considered obtaining surplus<br />
volume in the Gariep dam via the following interventions:<br />
Using dead storage by altering the operating rules to allow the water below the existing canal<br />
(bottom) inlets to be used for the downstream users with no additional infrastructure being required;<br />
or<br />
Raising Gariep Dam with options proposed for 5 m and 10 m raising respectively.<br />
The most feasible (preferred) of the above options was not determined as part of this study. For the<br />
purposes of this study, it is assumed that surplus water will be available from the Gariep Dam where it will<br />
be abstracted and pumped to the Knellpoort Dam or any alternative destination. An “Orange River water<br />
charge” (to be determined) will then be applied to the Purchaser of this surplus water. For purposes of first<br />
order costing, it is assumed that surplus water to be made available for Bloemfontein and surrounding<br />
towns is 10 million m 3 /a at a cost of R 2.00 per m 3 .<br />
It is envisaged that water will be pumped (approximately 150 km) from the Gariep Dam to the Knellpoort<br />
Dam via a 600 mm diameter pump-main, from where it will be transferred via the Novo Transfer Scheme<br />
and Modder River to the Rustfontein Dam for supply to Bloemfontein and surrounding towns (see<br />
Figure C1). Currently the Novo Transfer Scheme has a pump station capacity of 1.5 m 3 /s with the<br />
immediate potential to be upgraded to 2.4 m 3 /s, and the delivery main has a design capacity of 2.4 m 3 /s.<br />
The capacity of this pump station and associated delivery main to Rustfontein Dam (via the Modder River<br />
system) can be further increased, which will ultimately depend on the volume of water to be transferred<br />
from Gariep Dam to Knellpoort dam.<br />
<strong>Interventions</strong> <strong>Report</strong> June 2012
Water Reconciliation Strategy Study for the Large Bulk Water Supply Systems: Greater Bloemfontein Area 44<br />
Figure C1: Additional Supply from Gariep Dam<br />
<strong>Interventions</strong> <strong>Report</strong> June 2012
Water Reconciliation Strategy Study for the Large Bulk Water Supply Systems: Greater Bloemfontein Area 45<br />
2. SCHEME YIELD<br />
For the purposes of this study, it is assumed that a yield of 10 million m 3 /a of the total available yield will be<br />
made abstracted from Gariep Dam for Bloemfontein and surrounding towns. The ORP study proposed that<br />
the total available yield as a result of implementing one the various interventions would amount to:<br />
Using dead storage: Additional yield of 27 million m 3 /a;<br />
Raising Gariep Dam by 5 m: Additional yield of 316 million m 3 /a; or<br />
Raising Gariep Dam by 10 m: Additional yield of 635 million m 3 /a.<br />
3. UNIT REFERENCE VALUE<br />
A first order estimate of financial costs for the surface water option is presented below:<br />
Surplus Water Costs<br />
(Orange River Water)<br />
Charge per m 3 for Orange River Water R 2.00 (Charge per m 3 for Orange River Water)<br />
Discount Rate<br />
4%<br />
Discount Rate<br />
6%<br />
Discount Rate<br />
8%<br />
Total capital cost (R million) R 859 R 859 R 859<br />
Annual operating cost (R mill /annum) R 62 R 62 R 62<br />
NPV Cost (R million) R 2 058 R 1 674 R 1 431<br />
Unit Reference Value (R/m 3 ) R 5.25 R 6.01 R 6.85<br />
Note: The costs and URVs are based on the following assumptions:<br />
o The base date for the above estimate is July 2009.<br />
o Costs associated with the “Infrastructure Link to Knellpoort” is based on a 150 km pump<br />
system (pump station and rising main) capable of delivering 10 million m 3 /a.<br />
o Costs associated with the upgrade of the Novo Transfer Scheme have been excluded.<br />
o The above costs do not include costs associated with the land acquisition or location.<br />
o Refurbishment Costs have not been considered.<br />
4. POTENTIAL IMPACTS<br />
The main environmental impact of this intervention relates to the construction of the pipeline which will<br />
traverse shrubland (Low and Rabelo, 1996), cultivated land, and grassland. Furthermore, conservation<br />
areas, wetlands, and a number of small roads will also need to be taken into account when selecting a<br />
pipeline route.<br />
In addition to the abovementioned impacts, the following issues have been identified:<br />
The fish population in the dam may become stressed if the dead storage is used.<br />
Capital investment for bulk delivery infrastructure from Gariep Dam to Knellpoort Dam is high. As<br />
such this surface water intervention may not be financially feasible to cater for Bloemfontein and<br />
surrounding towns.<br />
No fatal flaws were identified.<br />
<strong>Interventions</strong> <strong>Report</strong> June 2012
Water Reconciliation Strategy Study for the Large Bulk Water Supply Systems: Greater Bloemfontein Area 46<br />
C2. Utilising Surplus Capacity in the Orange River by<br />
Pumping to Knellpoort Dam from Vanderkloof Dam<br />
1. OPTION DESCRIPTION<br />
The information presented in this section has been derived from the Orange River Development Project<br />
Replanning Study (ORP study), dated May 1998. The aforementioned study considered surplus volume in<br />
the Vanderkloof dam by utilising the dead storage by altering the operating rules to allow the water below<br />
the existing canal (bottom) inlets to be used for the downstream users with no additional infrastructure<br />
being required. The ORP study identified approximately 810 million m 3 of surplus water below the minimum<br />
operating level (existing level of the outlets to the irrigation systems) that can be utilised for irrigation and<br />
domestic purposes. If the above surplus volume is to service the Orange River supply area only, then the<br />
dead storage at Vanderkloof should be utilised either through the provision of pumps to lift the water into<br />
the irrigation canals or by altering the operating rules to allow the water below the existing canal (bottom)<br />
inlets to be used for the downstream users without any supply through the Vanderkloof Canal. The first<br />
proposal of a pump system will however impact on the energy that can be generated by the hydropower<br />
plant at the dam.<br />
For purposes of this study, it is assumed that surplus water will be available from the Vanderkloof Dam<br />
where it will be abstracted and pumped to the Knellpoort Dam or any alternative destination. An “Orange<br />
River water charge” (to be determined) will then be applied to Purchaser of this surplus water. For purposes<br />
of first order costing, it is assumed that surplus water to be made available for Bloemfontein and surrounds<br />
is 10 million m 3 /a at a cost of R 2.00 per m 3 .<br />
It is envisaged that water will be pumped (approximately 200 km) from the Vanderkloof Dam to the<br />
Knellpoort Dam via a 600 mm diameter pump-main, from where it will be transferred via the Novo Transfer<br />
Scheme and Modder River to the Rustfontein Dam for supply to Bloemfontein and surrounding towns.<br />
Currently the Novo Transfer Scheme has a pump station capacity of 1.5 m 3 /s with the immediate potential<br />
to be upgraded to 2.4 m 3 /s, and the delivery main has a design capacity of 2.4 m 3 /s. The capacity of this<br />
pump station and associated delivery main to Rustfontein Dam (via the Modder River system) can be<br />
further increased, which will ultimately depend on the volume of water to be transferred from Vanderkloof<br />
Dam to Knellpoort dam (Figure C2).<br />
<strong>Interventions</strong> <strong>Report</strong> June 2012
Water Reconciliation Strategy Study for the Large Bulk Water Supply Systems: Greater Bloemfontein Area 47<br />
Figure C2: Additional Supply from Vanderkloof Dam<br />
<strong>Interventions</strong> <strong>Report</strong> June 2012
Water Reconciliation Strategy Study for the Large Bulk Water Supply Systems: Greater Bloemfontein Area 48<br />
3. SCHEME YIELD<br />
For the purposes of this study, it is assumed that a yield of 10 million m 3 /a of the total available yield will be<br />
made available from Vanderkloof Dam for Bloemfontein and surrounds. The ORP study proposed that the<br />
total available yield as a result of utilising the dead storage would amount to 222 million m 3 /a.<br />
If the above scheme is realised, then it is proposed that adequate yield be allocated for Bloemfontein and<br />
surrounding towns to meet their 20 to 30 year water requirements.<br />
4. UNIT REFERENCE VALUE<br />
A first order estimate of financial costs for the surface water option is presented below:<br />
Surplus Water Costs<br />
(Orange River Water)<br />
Charge per m 3 for Orange River Water R 2.00 (Charge per m 3 for Orange River Water)<br />
Discount Rate<br />
4%<br />
Discount Rate<br />
6%<br />
Discount Rate<br />
8%<br />
Total capital cost (R million) R 1 007 R 1 007 R 1 007<br />
Annual operating cost (R mill /annum) R 44.4 R 44.4 R 44.4<br />
NPV Cost (R million) R 1 848 R 1 561 R 1 376<br />
Unit Reference Value (R/m 3 ) R 9.43 R 11.21 R 13.17<br />
Note: The costs and URVs are based on the following assumptions:<br />
o The base date for the above estimate is July 2009.<br />
o Costs associated “Infrastructure Link to Knellpoort” is based on a 200 km pump system (pump<br />
station and rising main) capable of delivering 10 million m 3 .<br />
o Costs associated with the upgrade of the Novo Transfer Scheme have been excluded.<br />
o The above costs do not include costs associated with the land acquisition or location.<br />
o Refurbishment Costs have not been considered.<br />
4. POTENTIAL IMPACTS<br />
The Vanderkloof Dam is predominantly situated amongst land cover of shrubland (Low and Rabelo, 1996),<br />
the proposed pipeline route to Knellpoort Dam will follow shrubland, and some cultivated land. The<br />
proposed pipeline will not traverse or be able to follow any roads from Vanderkloof Dam. The proposed<br />
pipeline may traverse the Rolfontein conservation area from the dam. The crossing of wetlands will also<br />
have to be assessed and mitigated where necessary.<br />
Specific weaknesses of the scheme include:<br />
A negative impact for periods when hydro-power cannot be generated due to water shortages.<br />
Capital investment for bulk delivery infrastructure from Vanderkloof Dam to Knellpoort Dam is high,<br />
and may not be financially feasible to cater for Bloemfontein and surrounding towns.<br />
No fatal flaws have been identified.<br />
<strong>Interventions</strong> <strong>Report</strong> June 2012
Water Reconciliation Strategy Study for the Large Bulk Water Supply Systems: Greater Bloemfontein Area 49<br />
C3. Utilising Surplus Capacity in the Orange River by<br />
Pumping to Knellpoort Dam from Bosberg / Boskraai Dam<br />
1. OPTION DESCRIPTION<br />
This scheme comprises of the proposed Bosberg Dam on the Orange River, together with another dam of<br />
similar height on the Kraai River (Figure C3). The information presented in this section has been derived<br />
from the ORP study, dated May 1998.<br />
1.1 BOSBERG DAM<br />
The ORP study proposed the Bosberg Dam be located along the Orange River, downstream of the<br />
confluent of the Kraai River. The dam comprises of a main dam wall of variable heights between a FSL of 1<br />
370 m and 1 400 m. For purposes of this report, the main dam wall has been taken as 57 m high (FSL = 1<br />
385 m) to the full supply level, and a saddle wall (partition wall) on the southern bank of the Orange River.<br />
Any storage above the proposed full supply level would potentially result in spillage over the watershed to<br />
the Kraai River basin, requiring a saddle dam known as the Boskraai dam. Further details of the Boskraai<br />
dam shall be discussed in more detail in the following section.<br />
The Bosberg dam was originally proposed in ORP study to transfer water to the Vaal River system and to<br />
support the Gariep and Vanderkloof dams when their maximum operational level is reached. Smaller<br />
volumes along the Orange River can also be anticipated as a result of Polihali Dam (Lesotho Highlands<br />
Water Project), or as a result of surplus water from the Orange River System. The ORP study also noted<br />
that the scheme is most cost effective for transfer volumes greater than 20 m 3 /s.<br />
1.2 BOSKRAAI DAM<br />
The Boskraai Dam actually consists of a Bosberg Dam of higher than 57 m on the Orange River, together<br />
with a dam of similar height on the Kraai River. Water would spill from one storage basin, creating a joint<br />
reservoir basis when the water depth behind both dams exceeds this level. This option includes the benefit<br />
of utilising runoff from the Kraai River at the same time. Although the site allows for higher dams to be built,<br />
a maximum water depth of about 75 m (FSL = 1 372 m) was assumed for Boskraai, as the backwater may<br />
extend into Lesotho territory at higher levels.<br />
<strong>Interventions</strong> <strong>Report</strong> June 2012
Water Reconciliation Strategy Study for the Large Bulk Water Supply Systems: Greater Bloemfontein Area 50<br />
Figure C2: Surplus Capacity in the Orange River by Pumping to Knellpoort Dam from Bosberg / Boskraai Dam<br />
<strong>Interventions</strong> <strong>Report</strong> June 2012
Water Reconciliation Strategy Study for the Large Bulk Water Supply Systems: Greater Bloemfontein Area 51<br />
The Bosberg and Boskraai option is seen as a more plausible alternative to the “Raising of Gariep dam” as<br />
this option will store water further upstream in the catchment, where the evaporation is less and the<br />
possibility of providing an economically viable transfer to the Vaal system is higher.<br />
It is envisaged that water will be pumped (approximately 100 km) from the Bosberg/Boskraai Dam to the<br />
Knellpoort Dam via a 600 mm diameter pump-main, from where it will be transferred via the Novo Transfer<br />
Scheme and Modder River to the Rustfontein Dam for supply to Bloemfontein and surrounding towns.<br />
Currently the Novo Transfer Scheme has a pump station capacity of 1.5 m 3 /s with the immediate potential<br />
to be upgraded to 2.4 m 3 /s, and the delivery main has a design capacity of 2.4 m 3 /s. The capacity of this<br />
pump station and associated delivery main to Rustfontein Dam (via the Modder River system) can be<br />
further increased, which will ultimately depend on the volume of water to be transferred from the proposed<br />
Bosberg/Boskraai Dam to Knellpoort Dam.<br />
2. OPTION YIELD<br />
For the purposes of this study, it is assumed that a yield of a yield of 10 million m 3 /a of the total available<br />
yield will be made abstracted from Bosberg/Boskraai Dam for Bloemfontein and surrounding towns. The<br />
ORP study proposed that the total available yield as a result of implementing one the various interventions<br />
would amount to:<br />
Bosberg Dam: Additional yield of 3,652 million m 3 /a; or<br />
Bosberg and Boskraai Dam: Additional yield of 6,508 million m 3 /a.<br />
3. UNIT REFERENCE VALUE<br />
A first order estimate of financial costs for the surface water option is presented below:<br />
Surplus Water Costs<br />
(Orange River Water)<br />
Charge per m 3 for Orange River Water R 2.00 (Charge per m 3 for Orange River Water)<br />
Discount Rate<br />
4%<br />
Discount Rate<br />
6%<br />
Discount Rate<br />
8%<br />
Total capital cost (R million) R 375 R 375 R 375<br />
Annual operating cost (R mill /annum) R 33 R 33 R 33<br />
NPV Cost (R million) R 996 R 780 R 676<br />
Unit Reference Value (R/m 3 ) R 5.08 R 5.74 R 6.47<br />
Note The costs and URVs are based on the following assumptions:<br />
o The base date for the above estimate is July 2009.<br />
o Costs associated “Infrastructure Link to Knellpoort” is based on a 100 km pump system (pump<br />
station and rising main) capable of delivering 10 million m 3 /a.<br />
o Costs associated with the upgrade of the Novo Transfer Scheme have been excluded.<br />
o The above costs do not include costs associated with the land acquisition or location.<br />
o Refurbishment Costs have not been considered.<br />
<strong>Interventions</strong> <strong>Report</strong> June 2012
Water Reconciliation Strategy Study for the Large Bulk Water Supply Systems: Greater Bloemfontein Area 52<br />
4. POTENTIAL IMPACTS<br />
The Boskraai Dam is situated in grassland type of land cover (Low and Rabelo, 1996), and the proposed<br />
pipeline will follow through this. The proposed pipeline can follow a secondary road from the Boskraai Dam<br />
to the Knellpoort Dam. This pipeline will also potentially traverse the conservation area named, Aasvoel<br />
Bewaringsbied. The crossing of wetlands will also have to be assessed and mitigated where necessary.<br />
The following issues have been identified:<br />
The inevitable loss of the use of the land that will be inundated and any associated ecology.<br />
The capital costs of this scheme are high.<br />
No fatal flaws have been identified.<br />
5. KEY ISSUES<br />
Strengths:<br />
The scheme can be integrated with the Lower Kraai River.<br />
Evaporation within this catchment is lower than downstream catchments, making this large<br />
augmentation option more economically viable transfer to the Vaal system.<br />
Weaknesses:<br />
Capital investment for the dam is high, and the primary driver for implementation of this scheme will<br />
be irrigation use.<br />
Capital investment for bulk delivery infrastructure from Bosberg/Boskraai Dam to Knellpoort Dam is<br />
relatively high, and the financial feasibility of this investment warrants further investigation.<br />
Polihali Dam (Lesotho Highlands) will impact the flows along the Orange River.<br />
Potential inundation of established agricultural land downstream will also have to be investigated<br />
further.<br />
<strong>Interventions</strong> <strong>Report</strong> June 2012
Water Reconciliation Strategy Study for the Large Bulk Water Supply Systems: Greater Bloemfontein Area 53<br />
C4. Modifications to Welbedacht Dam: Extend Scour<br />
Operations & Lower Outlets<br />
1. OPTION DESCRIPTION<br />
This option considers the potential to increase the available yield from Welbedacht dam by reducing the<br />
existing dead storage as a result of siltation of the dam.<br />
1.1 Welbedacht Dam<br />
The Welbedacht Dam is situated on the Caledon River, where water from the Caledon River is treated at<br />
the Welbedacht WTW and then supplied to urban users in Bloemfontein, Botshabelo, Dewetsdorp, and<br />
various other smaller users as well as irrigators downstream in the Caledon River. Water is transferred to<br />
Bloemfontein via the Caledon-Bloemfontein pipeline which was commissioned in 1974 to supply potable<br />
water from the Welbedacht Dam on the Caledon River to Bloemfontein.<br />
The Welbedacht WTW is situated just downstream of Welbedacht Dam and has a capacity of 145 Ml/day.<br />
This water is pumped after purification via a 6.5 km pressure pipeline and a 106 km gravity pipeline to<br />
Bloemfontein. The average capacity of the pipeline is 1.7 m 3 /s and the maximum capacity 1.85 m 3 /s. This<br />
pipeline is some 40 years old and its condition is deteriorating.<br />
The Caledon River is characterised by severe sedimentation problems, clearly demonstrated by the loss of<br />
storage capacity of the Welbedacht Dam which has decreased from 114 million m 3 to about 15 million m 3<br />
when last estimated in 1994. Due to the decreasing yield of the Welbedacht Dam, the <strong>DWA</strong> supplemented<br />
the yield of the Welbedacht Dam by constructing the Knellpoort off-channel storage dam on the Rietspruit, a<br />
tributary of the Caledon River. As a result of minimal storage capacity in Welbedacht Dam, the Tienfontein<br />
pumps must operate at a high reliability on a run of river basis to supply Knellpoort Dam. The current<br />
pumps have a total discharge of approximately 2.5 m 3 /s (design 3 m 3 /s) and have experienced high<br />
maintenance costs as a result of fine debris and sediment which reach the pumps.<br />
1.2 Alternative Scenarios for Welbedacht Dam<br />
The following alternatives for maintaining and/or increasing the available yield from the Welbedacht dam to<br />
Bloemfontein and surrounds via the Bloemfontein-Caledon pipeline have been identified:<br />
Alternative 1: Extended Scour Operation at Welbedacht Dam. This would be required to maintain<br />
the existing yield of Welbedacht Dam.<br />
Alternative 2: Lowered Gates at Welbedacht Dam. This could potentially increase the yield of<br />
Welbedacht Dam.<br />
<strong>Interventions</strong> <strong>Report</strong> June 2012
Water Reconciliation Strategy Study for the Large Bulk Water Supply Systems: Greater Bloemfontein Area 54<br />
2. OPTION YIELD<br />
The increase in yield for this intervention has not been determined. Detailed sediment modelling will have to<br />
be undertaken to ascertain the potential increase in yield. The determination of this additional yield is part of<br />
a more detailed study to be undertaken by Bloem Water.<br />
3. UNIT REFERENCE VALUE<br />
Due to the yield not being available, a URV was not calculated.<br />
<strong>Interventions</strong> <strong>Report</strong> June 2012
Water Reconciliation Strategy Study for the Large Bulk Water Supply Systems: Greater Bloemfontein Area 55<br />
C5. Modifications to Caledon-Modder System<br />
1. OPTION DESCRIPTION<br />
This option considers the potential to abstract additional yield from the Caledon River for transfer to<br />
Bloemfontein via the Novo Transfer Scheme. The Novo Transfer Scheme is owned and operated by Bloem<br />
Water and became operational in 1998. The scheme includes the following infrastructure:<br />
Tienfontein pump station on the banks of the Caledon River;<br />
A pipeline and canal from Tienfontein pump station to the Knellpoort Dam;<br />
The Knellpoort Dam;<br />
The Novo pump station on the northern side of the Knellpoort Dam to transfer water from the dam to<br />
the Modder River (current installed capacity is approximately 1.5 m 3 /s);<br />
The Novo pipeline (design capacity of 2.4 m 3 /s) that runs 20 km from the pump station to the<br />
headwaters of the Modder River on Dewetskrom Farm; and<br />
From the outfall of the Novo pipeline water flows down the Modder River to Rustfontein Dam, a<br />
distance of ± 50 km. Water stored in Rustfontein Dam is treated at the Rustfontein Treatment Works<br />
and pumped to Botshabelo/Thaba Nchu or Bloemfontein/Mangaung.<br />
The yield of the Caledon-Modder System can be increased by one, many or a combination of interventions<br />
(Figure C3). These are listed below:<br />
a) Increase capacity of Novo Pump Station<br />
b) The raising of Knellpoort Dam<br />
c) Increasing the Capacity of Tienfontein (TFT) Pump Station<br />
d) Implementing a pump station and pipeline between Welbedacht Dam and Knellpoort Dam<br />
e) Construction of a new canal to carry water from the Caledon River close to Jammersdrift Weir,<br />
upstream of Tienfontein Pump Station, to Knellpoort Dam.<br />
f) A combination of the abovementioned interventions<br />
<strong>Interventions</strong> <strong>Report</strong> June 2012
Water Reconciliation Strategy Study for the Large Bulk Water Supply Systems: Greater Bloemfontein Area 56<br />
Figure C3: Modifications to the Caledon-Modder System<br />
<strong>Interventions</strong> <strong>Report</strong> June 2012
Water Reconciliation Strategy Study for the Large Bulk Water Supply Systems: Greater Bloemfontein Area 57<br />
For the existing situation (assuming agricultural water requirement upstream and downstream of<br />
Welbedacht Dam, an estimate for environmental water requirements and an allocation of 200 ha for<br />
resource poor farmers), the initial constraint on the yield of the Caledon Modder System is the capacity of<br />
Novo Pump Station. Thereafter the constraint is either the capacity of Knellpoort Dam or the capacity of<br />
Tienfontein Pump Station. The capacity of Novo Pump Station would also have to be further increased<br />
should additional storage capacity or inflow capacity be provided.<br />
3. OPTION YIELD<br />
The potential yields and estimated costs of the interventions are discussed below. . It is important to note<br />
that if the continued and on-going sedimentation of Welbedacht Dam is not addressed through a longer<br />
scouring/flushing duration of the dam, then any increase in the capacity of Tienfontein Pump Station may<br />
not lead to an increased system yield due to the operational problems of managing silt at Tienfontein Pump<br />
Station. Other relevant factors are:<br />
a) Novo Pump Station: The civil structure of Novo Pump Station was initially constructed to house<br />
pumps with a capacity of 4.8 m 3 /s. The current installed capacity of Novo Pump Station is 1.5 m 3 /s.<br />
The pipeline from Novo pump station to the head waters of the Modder River has a capacity of<br />
2.4 m 3 /s. If the capacity of Novo Pump Station is increased beyond 2.4 m 3 /s, an additional pipeline<br />
from Novo Pump Station would have to be constructed.<br />
b) Knellpoort Dam: The possibility of raising Knellpoort Dam was investigated. An analysis of the<br />
historical firm yields showed that raising the dam by 1 to 4 m would not increase the yield of the<br />
system significantly. This option was not considered further.<br />
c) Tienfontein Pump Station: The existing civil structure of Tienfontein Pump Station consists of 7<br />
pump bays of which 4 of the bays currently have pump sets each with an installed capacity of 1 m 3 /s.<br />
There are currently 3 vacant bays. The design capacity of the pump station is currently 3 m 3 /s with 1<br />
m 3 /s standby capacity.<br />
d) Welbedacht Pump Station: This is a possible future intervention which would pump directly from<br />
Welbedacht Dam to Knellpoort Dam.<br />
e) New Canal :A diversion weir and canal to transfer water from the Caledon River upstream of the<br />
Tienfontein Pump Station to Knellpoort Dam by gravity has been proposed in the past. This proposal<br />
was made before the construction of Welbedacht Dam and other infrastructure downstream. It is<br />
unlikely that a scheme of this nature could be implemented now due to the existing infrastructure<br />
development downstream, the environmental water requirements, potential upstream development,<br />
and international obligations with Lesotho. The development of this scheme would reduce the yield of<br />
existing schemes downstream of Jammersdrift Weir. Consequently, it was not considered further.<br />
(See also Section G1: Tunnel from Caledon)<br />
The phasing and implementation of the pumping infrastructure comprising the Novo Transfer Scheme is an<br />
important consideration. Whilst it may not make sense to increase the pumping capacities of the<br />
Tienfontein and Novo Pump Stations incrementally, it must be understood that in terms of the yield<br />
determinations “yield bottlenecks” may occur as a result of pumping/conveyance infrastructure capacity<br />
constraints.<br />
The study undertaken by Bloem Water to investigate the extension of the capacity of the Novo Transfer<br />
Scheme identified a number of <strong>Interventions</strong> which should be implemented.<br />
An Intervention is seen as an action or group of actions that are applied to the Novo Transfer Scheme at a<br />
set time to enhance the transfer capacity of the system. Each Intervention is a phased approach to be<br />
implemented according to timeframes as determined and discussed under the following sections.<br />
<strong>Interventions</strong> <strong>Report</strong> June 2012
Water Reconciliation Strategy Study for the Large Bulk Water Supply Systems: Greater Bloemfontein Area 58<br />
3.1 Tienfontein and Novo Pump Stations<br />
The interventions as proposed by the Bloem Water <strong>Report</strong>, and numbered differently from the list appearing<br />
earlier in this section, are outlined below:<br />
Intervention 1: This intervention entails operating all 4 pumps at the existing Tienfontein Pump Station<br />
simultaneously (i.e. with no standby capacity). Should water levels in the Caledon River permit, the full<br />
utilisation of the existing pump station capacity would enable 3.5 m 3 /s to 4 m 3 /s to be transferred to<br />
Knellpoort Dam via Tienfontein Pump Station.<br />
Intervention 2: This intervention entails the installation of three new high capacity pump sets at Tienfontein<br />
pump station, each with a capacity of 2 m 3 /s. In addition, a duplicate steel rising main is required from the<br />
Tienfontein pump station to the sand traps with surge chamber and additional sand traps to be constructed.<br />
To make full use of the 2.4 m 3 /s capacity of the existing steel rising main between Knellpoort Dam and the<br />
upper reaches of the Modder River, it is recommended that a pumpset with a capacity of 1.6 m 3 /s capacity,<br />
similar to existing pumpsets, be installed at Novo Pump Station. The newly installed pump set, operating in<br />
parallel with one of the existing pump sets could deliver ± 2.3 m 3 /s. The electricity supply to Novo Pump<br />
Station would also need to be upgraded.<br />
Intervention 3: This intervention entails the installation of a second new high capacity pump set at Novo<br />
pump station to transfer an additional 1.67 m 3 /s via a new parallel installed steel rising main from the Novo<br />
pump station through to the upper reaches of the Modder River.<br />
Table 3.1 below summarises the <strong>Interventions</strong> together with the required pumping infrastructure capacities.<br />
Table 3.1: Caledon Bloemfontein transfer scheme interventions<br />
Intervention<br />
Tienfontein P/S Capacity<br />
(m 3 /s)<br />
Novo P/S<br />
(m 3 /s)<br />
Novo / Modder Rising<br />
Main (m 3 /s)<br />
Intervention 1<br />
4<br />
(by utilising standby capacity)<br />
1.5 2.4<br />
Intervention 2 7 2.4 2.4<br />
Intervention 3 7 4.8 4.8<br />
Whilst the interventions described above target increasing the capacity of the existing supply infrastructure<br />
they are not necessarily the best interventions to implement to increase the available yield of the system<br />
and do also not address the underlying risks associated with sedimentation. Table 3.2 below shows the<br />
incremental yield (determined from the water resources yield model) associated with each intervention, and<br />
highlights risk/concerns from a longer term reconciliation of supply and requirement point of view.<br />
<strong>Interventions</strong> <strong>Report</strong> June 2012
Water Reconciliation Strategy Study for the Large Bulk Water Supply Systems: Greater Bloemfontein Area 59<br />
Table 3.2: Incremental Yield Associated with Each Intervention Listed in Table 3.1<br />
Intervention<br />
Incremental Yield<br />
(million m 3<br />
/a)<br />
Intervention 1 4.4<br />
Intervention 2<br />
11.5 (15.9<br />
including the yield<br />
from Intervention 1 )<br />
Intervention 3 4.4<br />
Comments<br />
Intervention 1 is not seen as a permanent solution, as given<br />
the historical sediment related problems experienced at<br />
Tienfontein Pump Station and the very high operating and<br />
maintenance costs utilising the standby capacity may be<br />
impractical to do on a sustained basis. This also poses<br />
additional risks in terms of breakdowns and maintenance.<br />
The full implementation of Intervention 2 should be subject to<br />
the scouring/flushing limitations on Welbedacht Dam being<br />
addressed and a workable solution found. If these problems<br />
are not addressed the siltation problems at Tienfontein Pump<br />
Station may limit the usage of the increased capacity<br />
This intervention did not increase the yield any more than<br />
Intervention 1 did and was not considered further.<br />
Tienfontein Pump station currently has a design capacity of 3 m 3 /s, but due to the sedimentation related<br />
problem and high maintenance requirements delivers on average approximately 2.5 m 3 /s. It is proposed<br />
that as an interim solution those two additional (1 m 3 /s) pump sets at Tienfontein Pump Station be<br />
implemented. The first pumpset should be utilised to increase the design capacity of the pump station to<br />
4 m 3 /s and the second pumpset to provide additional standby capacity. This would provide an additional<br />
yield of approximately 4.4 million m 3 /a. With an increase in the standby capacity (proposed 50% of design<br />
capacity), maintenance of pumps could be more easily facilitated without impacting on the operating<br />
capacity of the pump station.<br />
3.2 Scouring/flushing of Welbedacht Dam<br />
Due to the high turbidity of the raw water, especially during flood events it is not possible to operate<br />
Welbedacht WTW at full capacity throughout the year. A discussion with the operator of the WTW<br />
suggested that the WTW could operate at full capacity (145 Ml/d) in winter, but only managed an output of<br />
between 90 and 100 Ml/d in summer when the silt load in the river was higher. The yield of the system<br />
could therefore potentially increase if the WTW was operated a full capacity all year round.<br />
The possibility to supply raw water to Welbedacht WTW from a source other than the Welbedacht Dam was<br />
recently investigated by Bloem Water and the <strong>DWA</strong>. The report, which was entitled “Investigation into the<br />
Condition of the Caledon River at Welbedacht Dam” (SSI, 2011) investigated the sedimentation problems<br />
and potential solutions in more detail. This report contained the following two recommendations:<br />
1) Conduct a detailed investigation and cost estimate to modify the Tienfontein Pump Station to such<br />
an extent that the pump station can operate efficiently under the current in-take conditions<br />
2) Conduct a detailed feasibility study to improve the storage capacity of Welbedacht Dam, through<br />
the scouring/flushing of Welbedacht Dam.<br />
The report found that Welbedacht Dam could be scoured for a period of 4 days continuously during times of<br />
floods in the Caledon River if either:<br />
1) an off-channel storage dam was constructed to supply Welbedacht WTW, or<br />
2) a supply pipeline was laid between Knellpoort Dam and Welbedacht WTW.<br />
The yield analysis undertaken found that by operating Welbedacht WTW at 145 Ml/d throughout the year<br />
and by increasing the storage capacity of Welbedacht Dam to approximately 13 million m 3 , the incremental<br />
historical firm yield of the system could be increased by 7.06 million m 3 /a and 1.89 million m 3 /a respectively.<br />
The scouring operation with alternative feed to Welbedacht WTW could therefore increase the historical<br />
<strong>Interventions</strong> <strong>Report</strong> June 2012
Water Reconciliation Strategy Study for the Large Bulk Water Supply Systems: Greater Bloemfontein Area 60<br />
firm yield of the system by approximately 9 million m 3 /a. The capital cost of the two alternatives together<br />
with the associated URVs as given in the report on the investigation (SSI 2011) is shown in Table 7-10<br />
below.<br />
Table 3.3: Capital Costs and URVs Associated with the Scouring / flushing of Welbedacht Dam<br />
Intervention<br />
Off channel storage dam to supply<br />
Welbedacht WTW<br />
Raw Water Supply from Knellpoort<br />
Dam to Welbedacht WTW<br />
3.3 Welbedacht Pump Station<br />
Incremental Yield<br />
(Million m 3 /a)<br />
Capital Cost<br />
(R Million)<br />
URV<br />
(R/m 3 )<br />
9 270 2.12<br />
9 297 2.33<br />
In addition to the interventions proposed to increase the capacity of the Novo Transfer Scheme, this<br />
intervention entails the construction of a new pump station at Welbedacht Dam with a capacity of<br />
approximately 2 m 3 /s (although this could be increased to obtain additional system yield) to pump water to<br />
Knellpoort Dam. There is potential synergy between this intervention and the interventions described in<br />
Section 3.2 above. Should a pipeline be constructed between Knellpoort Dam and Welbedacht WTW to<br />
facilitate the scouring of Welbedacht Dam by providing a continuous supply of water to Welbedacht WTW,<br />
then this pipeline could be used in reverse as a rising main and pump water from Welbedacht Dam to<br />
augment the supply to Knellpoort Dam. The pipeline could only be used when Welbedacht Dam was not<br />
being scoured. For the purposes of the yield calculations, it was assumed that the Welbedacht Dam would<br />
not be scoured for a duration of more than 4 days and not more than 4 to 5 times per year. The indicative<br />
yields, capital costs, operating costs and URVs associated with this intervention are given in Table 3.4<br />
below. The URV calculations have been worked out firstly assuming a new pipeline would need to be<br />
implemented between Welbedacht Dam and Knellpoort Dam, and then assuming that a pipeline had<br />
already been constructed to facilitate the scouring of Welbedacht Dam (and that the pipeline would then be<br />
used as a bi-directional pipeline). The URV of the integrated solution was also calculated.<br />
Table 3.4: Welbedacht Pump Station <strong>Interventions</strong><br />
Intervention<br />
Welbedacht P/S with raw<br />
water pipeline to Knellpoort<br />
Dam.<br />
Integrated Solution<br />
(Welbedacht P/S and<br />
scouring of Welbedacht<br />
Dam)<br />
Incremental<br />
Yield<br />
(Million m 3 /a)<br />
Capital Cost<br />
(R Million)<br />
Operating<br />
Cost<br />
(R Million)<br />
URV at<br />
4%<br />
(R/m 3 )<br />
URV at<br />
4%<br />
(R/m 3 )<br />
<strong>Interventions</strong> <strong>Report</strong> June 2012<br />
URV at<br />
4%<br />
(R/m 3 )<br />
20 374 9.4 1.37 1.70 2.07<br />
27 374 7.1 0.93 1.17 1.44
Water Reconciliation Strategy Study for the Large Bulk Water Supply Systems: Greater Bloemfontein Area 61<br />
C6. Polihali Dam – Lesotho Highlands Phase 2<br />
1. SCHEME DESCRIPTION<br />
The information provided for this development option has been extracted from the “Consulting Services for<br />
the Feasibility Study for Phase II”, Main <strong>Report</strong> (version 4) for the Lesotho Highlands Water Project, dated<br />
February 2009 (<strong>Report</strong> No: LHWC 001/224/2007 and P RSA D000/00/7007). This report will be referred to<br />
as the Phase 2 <strong>Report</strong>.<br />
The development of the Lesotho Highlands Water Project (LHWP) was agreed between South Africa and<br />
Lesotho in the Lesotho Highlands Water Project Treaty signed in October 1986 (hereafter referred to as the<br />
Treaty). The project would comprise a number of Phases. However, the Treaty only committed both parties<br />
to implement Phase I. The Treaty provided for further Phases to be developed to transfer up to a maximum<br />
of 70 m 3 /s (or 2 208 Mm 3 /a) from the Highlands of Lesotho (Senqu/Orange River) to the Vaal River system<br />
in South Africa.<br />
Phase I of the project comprised two sub-phases, namely Phases IA and IB. Phase IA of the project<br />
comprises the 185 m high double curvature concrete arch dam at Katse. Water is transferred under gravity<br />
via the 44 km long, 4.35 m internal diameter, concrete lined Transfer Tunnel to the Muela Hydro Power<br />
Station which discharges into the 55 m high Muela concrete arch dam before flowing through the 38 km<br />
long Delivery Tunnel to the Ash River outfall in South Africa. The water then flows down the Ash and Wilge<br />
Rivers into Vaal Dam.<br />
Phase IB comprises the 145 m high concrete faced rockfill dam at Mohale. A 32 km long concrete lined<br />
gravity tunnel connects Mohale Dam to Katse Dam from where the water also flows through the Transfer<br />
Tunnel constructed under Phase IA to the Muela Hydro Power Station, and is finally discharged into the<br />
Ash River. An additional component of Phase I was the 19 m high Matsoku diversion weir transferring water<br />
to Katse reservoir. The published Nominal Annual Yield (NAY) of Phase I is 24.7 m 3 /sec or 780 million<br />
m 3 /annum.<br />
The works proposed for Phase II would comprise Polihali Dam (wall height of 163.5 m) and a gravity tunnel<br />
to Katse Dam. Water from the Polihali Dam would then be delivered from Katse Dam via the existing<br />
Transfer Tunnel to Muela Hydro Power Station and thence via the existing Delivery Tunnel to the Ash River.<br />
The incremental yield of Phase II would be 14.75 m 3 /s or 465 million m 3 /a. The Phase II <strong>Report</strong> indicates<br />
that Phase II would be commissioned by January 2020. The report anticipates that Phase 3 would only be<br />
required by 2054.<br />
The option of making additional early transfers from the LHWP needs to be considered for Bloemfontein<br />
and surrounding towns. Possible options for transfers in excess of the proposed delivery schedule to South<br />
Africa (Scenario D shown in the figure below) include additional releases into a tributary of the Caledon<br />
River to temporarily augment supplies to Maseru, Bloemfontein and other urban towns within the catchment<br />
area. This supply could delay additional capital expenditure on improvements to the existing bulk water<br />
infrastructure supplying Maseru and Bloemfontein. The implications of making additional early transfers in<br />
excess of those provided for in the Agreement between Lesotho and South Africa are uncertain and would<br />
need to be resolved from a National perspective before this option could be considered.<br />
It is proposed that water from the LHWP would be released into one of the tributaries of the Caledon River,<br />
probably at the existing release structure on the Little Caledon River. Water released into the Caledon River<br />
would be abstracted at Tienfontein Pump Station and delivered to Knellpoort Dam, from where it would be<br />
transferred via the Novo Transfer Scheme and Modder River to the Rustfontein Dam to augment the supply<br />
<strong>Interventions</strong> <strong>Report</strong> June 2012
Water Reconciliation Strategy Study for the Large Bulk Water Supply Systems: Greater Bloemfontein Area 62<br />
to Bloemfontein and the surrounding towns. Currently the Novo Transfer Scheme has a pump station<br />
capacity of 1.5 m 3 /s which could be upgraded to 2.4 m 3 /s by the provision of additional pumps. This<br />
capacity could be doubled by duplicating the Novo Pump Station and pipeline.<br />
3. SCHEME YIELD<br />
The graph below shows the agreed Delivery Schedule (Scenario D) for the transfer of water from Phase II<br />
to Vaal Dam as per Treaty, and also shows the water that could be made available by LHWP Phase II for<br />
transfer to Vaal Dam to meet the Delivery Schedule.<br />
The following options are proposed for making additional early transfers from the LHWP:<br />
Access unutilised yield allocated to South Africa which is additional to the agreed Delivery Schedule<br />
(Scenario D). This yield would be available for a limited period, during the early years when the<br />
surplus yield that is not transferred to the Vaal River system, would supplement the yield available<br />
from the Caledon River with any surplus flowing into the Orange River system further downstream.<br />
Utilise any yield in excess of the proposed delivery schedule to South Africa (Scenario D) to supply<br />
Bloemfontein, specifically for the period from 2020 to about 2050, before the full yield of the LHWP is<br />
transferred to the Vaal River System from about 2053 onwards. This arrangement will require an<br />
amendment to the existing treaty.<br />
Water Requirements (million m 3 /a)<br />
700.0<br />
600.0<br />
500.0<br />
400.0<br />
300.0<br />
200.0<br />
100.0<br />
0.0<br />
2000 2010 2020 2030 2040 2050 2060 2070<br />
-100.0<br />
Water Requirements and Supply Scenarios<br />
For the purposes of this study and in order to determine a URV that can be compared to the URV’s<br />
determined for other surface water options, it has been assumed that a yield of 10 million m 3 /a would be<br />
made available from LHWP for Bloemfontein and surrounding towns and that this would be available up to<br />
the year 2050.<br />
<strong>Interventions</strong> <strong>Report</strong> June 2012<br />
Year<br />
Agreed Delivery Schedule per<br />
Treaty (Scenario D)<br />
Available supply from Phase II<br />
Polihali Katse to RSA<br />
Total Yield for Polihali Dam
Water Reconciliation Strategy Study for the Large Bulk Water Supply Systems: Greater Bloemfontein Area 63<br />
4. UNIT REFERENCE VALUE<br />
The cost of water from the LHWP is uncertain at this stage, and is dependent on a number of factors such<br />
as:<br />
The Unit Reference Value (URV) of water from the scheme which was determined to be about<br />
R2.10/m 3 for a discount rate of 8%/a before taking hydropower benefits into account which would<br />
reduce the URV by about R0.20/m 3 i.e. a combined URV of about R1.90/m 3 .<br />
Losses down the Caledon River are likely to be relatively high (assumed to be equal to the<br />
requirements) because of potential abstractions (unauthorised) from the river upstream of the<br />
Tienfontein Pump Station.<br />
For purposes of this study, the unit cost of water has been assumed to be as indicated in the table below.<br />
URV costs proposed for this option are presented below:<br />
Surplus Water Costs<br />
R 1.90 (Charge per m 3 for<br />
LHWP Water)<br />
Discount Rate 4% 6% 8%<br />
NPV of Water Costs (20 million m 3 p.a. for 10 million m 3 p.a.<br />
yield) (R million)<br />
746 529 397<br />
Unit Reference Value (R/m 3 ) 3.80 3.80 3.80<br />
Note: The costs and URVs are based on the following assumptions:<br />
o The base date for the above estimate is August 2009.<br />
o Costs associated with the upgrade of the Novo Transfer Scheme, or any other infrastructure at<br />
Tienfontein, Welbedacht or Knellpoort have been excluded.<br />
o Refurbishment Costs have not been considered.<br />
o The above cost further assumed that double the water will have to be purchased from LHWP,<br />
assuming that 50% of this water will be lost in the system as a result of river channel<br />
conveyance losses and unauthorised abstractions.<br />
o The above costing excludes the cost for transferring water from the LHWP scheme into the<br />
Caledon River.<br />
o NPV’s and URV’s are based on a 50 year life cycle cost.<br />
<strong>Interventions</strong> <strong>Report</strong> June 2012
Water Reconciliation Strategy Study for the Large Bulk Water Supply Systems: Greater Bloemfontein Area 64<br />
SECTION D<br />
Re-use of treated effluent<br />
<strong>Interventions</strong> <strong>Report</strong> June 2012
Water Reconciliation Strategy Study for the Large Bulk Water Supply Systems: Greater Bloemfontein Area 65<br />
<strong>Interventions</strong> <strong>Report</strong> June 2012
Water Reconciliation Strategy Study for the Large Bulk Water Supply Systems: Greater Bloemfontein Area 66<br />
D1. Planned Direct Re-use – New North Eastern<br />
1. OPTION LAYOUT<br />
See Figure common to all Re-use <strong>Interventions</strong> (before D1).<br />
2. BACKGROUND<br />
Approximately 75% of Bloemfontein drains naturally to three existing WWTW’s in one large catchment. Two<br />
of these works (Bloemspruit and Sterkwater) are currently operated beyond their capacity, which<br />
necessitated the construction of a new WWTW.<br />
The MLM is in the design phase to construct the new WWTW further downstream in the same catchment<br />
as the existing WWTWs, to allow further development in the northern, eastern, and western parts of the<br />
city, which is in agreement with the strategic N8 Corridor Development Plan between Botshabelo and<br />
Bloemfontein.<br />
Treated wastewater from the new North Eastern WWTW will be discharged into the Modder River system<br />
and may be available for agricultural use, if it is not re-used by the city of Bloemfontein. Therefore, the main<br />
focus of this intervention is to rather abstract the water for re-use at the planned new North Eastern<br />
WWTW.<br />
2. OPTION DESCRIPTION<br />
This option will require the construction of a new WTW, which would have an abstraction point at the new<br />
North Eastern WWTW. The WTW will have the necessary infrastructure, including Ultra Filtration, followed<br />
by a Reverse Osmosis, and Ultra-Violet radiation for disinfection, to purify water to potable standards. In<br />
addition, a booster pump station and rising main will also be required.<br />
The treated water can be pumped from the new WTW over an escarpment to the existing distribution<br />
reservoir at Maselspoort (which is approximately 6.5 km away) or pumped to a planned new distribution<br />
reservoir on Naval Hill in Bloemfontein for blending.<br />
3. OPTION YIELD<br />
Glen Agricultural College and private farmers are currently using most of the treated wastewater discharged<br />
into the Renoster and Modder River systems.<br />
The water to be re-used would only be from that associated with growth after 2009, within the new<br />
WWTW’s catchment area.<br />
The existing 68Ml/day discharge will bypass the new WWTW towards Bishops Glen Dam for agricultural<br />
use.<br />
Estimated yield is 11 million m 3 /a (30 Ml/d)<br />
<strong>Interventions</strong> <strong>Report</strong> June 2012
Water Reconciliation Strategy Study for the Large Bulk Water Supply Systems: Greater Bloemfontein Area 67<br />
4. UNIT REFERENCE VALUE<br />
The URVs for this option are based on preliminary costing.<br />
ITEM<br />
Discount Rate<br />
4 %<br />
Discount Rate<br />
6 %<br />
Discount Rate<br />
8 %<br />
Total capital cost (R million) 212 212 212<br />
Annual operating cost (R mill /annum) 13.9 13.9 13.9<br />
NPV Cost (R million) 472 387 334<br />
Unit Reference Value (R/m 3 ) 2.2 2.5 2.9<br />
Note that the URV excludes escalation, but includes infrastructure and operating costs.<br />
5. POTENTIAL ECOLOGICAL IMPACTS<br />
New servitudes for pipeline routes over private farmland and/or urban areas.<br />
Waste product from the water treatment process including sludge and brine.<br />
6. POTENTIAL SOCIO-ECONOMICS IMPACTS<br />
No negative impacts envisaged.<br />
Public resistance to this intervention may be encountered, possibly stemming from concerns of poor design<br />
or control of processes which may allow sub-standard water to be introduced into the potable water supply<br />
system, or for religious reasons.<br />
7. POTENTIAL SURFACE WATER QUALITY IMPACTS<br />
The re-use of future effluent will have a positive impact on the system, as less treated effluent will be<br />
discharge into the natural stream.<br />
8. HEALTH RISKS<br />
There are unlikely to be any health risks associated with the direct re-use of the treated effluent, if all<br />
systems are functional (assuming RO was used). Failure of systems/processes could lead to poor quality<br />
water being supplied to end consumers. Stringent controls over the treatment process are required to<br />
ensure that sub-standard water cannot be introduced into the potable water supply system.<br />
9. OTHER ISSUES<br />
Any additional lighting in the vicinity of Maselspoort from new works could also interfere the operation of the<br />
Boyden Observatory, adjacent the Maselspoort Works. However, it is foreseen that this could be sufficiently<br />
mitigated in the design of the lighting for any new works.<br />
<strong>Interventions</strong> <strong>Report</strong> June 2012
Water Reconciliation Strategy Study for the Large Bulk Water Supply Systems: Greater Bloemfontein Area 68<br />
1. OPTION LAYOUT<br />
D2. Planned Indirect Re-use - Transfer to<br />
Upstream of Mockes Dam<br />
See Figure common to all Re-use <strong>Interventions</strong> (before D1)<br />
2. OPTION DESCRIPTION<br />
The works would include an abstraction point at the new North Eastern WWTW, plus a booster pump<br />
station, a possible stream crossing and 11 km of rising mains which will conduit the treated wastewater to<br />
the upper reached of a stream feeding Mockes Dam. The treatment facilities at the Maselspoort Weir (a few<br />
kilometres downstream of Mockes Dam) will be extended with new treatment technology and equipment.<br />
Required treatment process includes Reverse Osmosis in order to remove the build-up of dissolved salts in<br />
the river system.<br />
3. OPTION YIELD<br />
Glen Agricultural College and private farmers are currently using most of the treated wastewater discharged<br />
into the Renoster and Modder River systems.<br />
The water to be re-used would only be from that associated with growth after 2009, within the new North<br />
Eastern WWTW’s catchment area.<br />
The existing 68 Ml/day discharge will bypass the new WWTP towards Bishops Glen Dam for agricultural<br />
use.<br />
Estimated yield is 11 million m 3 /a (30 Ml/d)<br />
4. UNIT REFERENCE VALUE<br />
The URVs for this option are based on preliminary costing.<br />
ITEM<br />
Discount Rate<br />
4 %<br />
Discount Rate<br />
6 %<br />
Discount Rate<br />
8 %<br />
Total capital cost (R million) 289 289 289<br />
Annual operating cost (R mill /annum) 4.2 4.2 4.2<br />
NPV Cost (R million) 355 324 302<br />
Unit Reference Value (R/m 3 ) 1.7 2.1 2.6<br />
Note that the URV excludes escalation, but includes infrastructure and operating costs.<br />
<strong>Interventions</strong> <strong>Report</strong> June 2012
Water Reconciliation Strategy Study for the Large Bulk Water Supply Systems: Greater Bloemfontein Area 69<br />
5. POTENTIAL ECOLOGICAL IMPACTS<br />
New servitudes for pipeline routes over private farmland and/or urban areas.<br />
Disposal measures need to be developed for the waste products, which include sludge and brine.<br />
If the quality of the discharged effluent does not comply water the Water Use Licence conditions,<br />
there is the risk that sub-standard water could be discharged into the water resource. Stringent<br />
controls over the treatment process are required.<br />
No fatal flaws have been identified.<br />
6. OTHER ISSUES<br />
Any additional lighting in the vicinity of Maselspoort from new works could also interfere the operation of the<br />
Boyden Observatory, adjacent the Maselspoort Works. However, it is foreseen that this could be sufficiently<br />
mitigated in the design of the lighting for any new works.<br />
<strong>Interventions</strong> <strong>Report</strong> June 2012
Water Reconciliation Strategy Study for the Large Bulk Water Supply Systems: Greater Bloemfontein Area 70<br />
D3. Planned Indirect Re-use – Krugersdrift Dam<br />
1. OPTION LAYOUT<br />
See Figure common to all Re-use <strong>Interventions</strong> (before D1)<br />
2. BACKGROUND<br />
All treatment works for Bloemfontein, Botshabelo, Mangaung, and Thaba Nchu (except Welvaart WWTW at<br />
5 Ml/day) discharge their treated wastewater into the Krugersdrift Dam catchment area. Although the dam is<br />
approximately 30 km from Bloemfontein, all future wastewater will end up in the dam if not intercepted<br />
upstream.<br />
Currently, no wastewater from Botshabelo or Thaba Nchu is reaching the dam, as it is intercepted at the<br />
Maselspoort Weir. The only water reaching the dam is excess surface run-off not intercepted by Mockes<br />
Dam and Rustfontein Dam, and the surplus wastewater from the Bloemfontein/Mangaung WWTW’s.<br />
Water can be abstracted at Krugersdrift Dam and pumped back to Bloemfontein.<br />
3. INTERVENTION DESCRIPTION<br />
The raw water at the Krugersdrift Dam, which will consist of excess surface runoff and treated wastewater<br />
from the city, will have to be purified using advanced technology. This treated water will then be pumped<br />
back to the main Bloem Water reservoir located at Brandkop approximately 35 km away.<br />
The works would include an abstraction point at the Krugersdrift Dam. Included will be Ultra Filtration,<br />
followed by a Reverse Osmosis and Ultra-Violet radiation for disinfection, to purify water to potable<br />
standards. Also included are a booster pump station and a 35 km rising main to Bloemfontein.<br />
4. OPTION YIELD<br />
Glen Agricultural College and private farmers are currently using most of the treated wastewater discharged<br />
into the Renoster and Modder River systems. The water to be re-used would only be from that associated<br />
with growth after 2009, from the WWTW’s in the catchment area.<br />
The flow of water from the various WWTW into the dam will have losses associated with it in the form of<br />
evaporation and groundwater infiltration. Furthermore, existing abstraction licences granted by the <strong>DWA</strong> will<br />
need to be managed appropriately to ensure they are not exceeded.<br />
Estimated yield is 11 million m 3 /a (30 Ml/d)<br />
5. UNIT REFERENCE VALUE<br />
The URVs for this option are based on preliminary costing.<br />
<strong>Interventions</strong> <strong>Report</strong> June 2012
Water Reconciliation Strategy Study for the Large Bulk Water Supply Systems: Greater Bloemfontein Area 71<br />
ITEM<br />
Discount Rate<br />
4 %<br />
Discount Rate<br />
6 %<br />
Discount Rate<br />
8 %<br />
Total capital cost (R million) 307 307 307<br />
Annual operating cost (R mill /annum) 10.9 10.9 10.9<br />
NPV Cost (R million) 502 432 387<br />
Unit Reference Value (R/m 3 ) 2.3 2.8 3.4<br />
Note that the URV excludes escalation, but includes infrastructure and operating costs.<br />
6. POTENTIAL ECOLOGICAL IMPACTS<br />
New servitudes for pipeline routes over private farmland and/or urban areas.<br />
Disposal measures need to be developed for the waste products, which include sludge and brine.<br />
Increased stream flows in the Modder River which may impact on natural flow patterns and may<br />
result in an increase of vegetation on riverbanks.<br />
If the quality of the discharged effluent does not comply water the Water Use Licence conditions,<br />
there is the risk that sub-standard water could be discharged into the water resource. Stringent<br />
controls over the treatment process are required.<br />
No fatal flaws were identified.<br />
<strong>Interventions</strong> <strong>Report</strong> June 2012
Water Reconciliation Strategy Study for the Large Bulk Water Supply Systems: Greater Bloemfontein Area 72<br />
1. OPTION LAYOUT<br />
D4. Planned Direct Re-use – Bloemspruit<br />
See Figure common to all Re-use <strong>Interventions</strong> (after D1).<br />
2. OPTION DESCRIPTION<br />
The treated wastewater from the Bloemspruit WWTW would be purified to potable standards (this will<br />
typically include Ultra Filtration, followed by a Reverse Osmosis, and Ultra-Violet radiation for disinfection)<br />
and then pumped 3.8 km to a reservoir serving the Greater Bloemfontein area. At this reservoir it would be<br />
blended with the exiting supply fro Maselspoort WTW.<br />
3. OPTION YIELD<br />
Estimated yield is 11 million m 3 /a (30 Ml/d)<br />
4. UNIT REFERENCE VALUE<br />
The URVs for this option are based on preliminary costing.<br />
ITEM<br />
Discount Rate<br />
4 %<br />
Discount Rate<br />
6 %<br />
Discount Rate<br />
8 %<br />
Total capital cost (R million) 179 179 179<br />
Annual operating cost (R mill /annum) 5.3 5.3 5.3<br />
NPV Cost (R million) 273 238 215<br />
Unit Reference Value (R/m 3 ) 1.3 1.6 1.9<br />
Note that the URV excludes escalation, but includes infrastructure and operating costs.<br />
5. POTENTIAL ECOLOGICAL IMPACTS<br />
New servitudes for pipeline routes over private farmland and/or urban areas.<br />
Disposal measures need to be developed for the waste products, which include sludge and brine.<br />
If the quality of the discharged effluent does not comply water the Water Use Licence conditions,<br />
there is the risk that sub-standard water could be discharged into the water resource. Stringent controls<br />
over the treatment process are required.<br />
No fatal flaws have been identified.<br />
<strong>Interventions</strong> <strong>Report</strong> June 2012
Water Reconciliation Strategy Study for the Large Bulk Water Supply Systems: Greater Bloemfontein Area 73<br />
6. POTENTIAL SOCIO-ECONOMICS IMPACTS<br />
There are no health risks associated with the direct re-use of the treated effluent, if all systems are<br />
functional. Failure of systems/processes could lead to poor quality water being supplied to end consumers.<br />
Stringent controls over the treatment process are required to ensure that sub-standard water cannot be<br />
introduced into the potable water supply system.<br />
Public resistance to this intervention may be encountered, possibly stemming from concerns of poor design<br />
or control of processes which may allow sub-standard water to be introduced into the potable water supply<br />
system.<br />
<strong>Interventions</strong> <strong>Report</strong> June 2012
Water Reconciliation Strategy Study for the Large Bulk Water Supply Systems: Greater Bloemfontein Area 74<br />
D5. Re-use of Treated Effluent – Direct use: Irrigation<br />
1. BACKGROUND<br />
Bloemfontein has currently a potable water distribution system. That means that all lawns, sports fields,<br />
parks etc. are irrigated with costly water “imported” from the Maselspoort or Welbedacht Dam WTW.<br />
A dual system could be investigated, where treated wastewater, treated to industrial standards, is returned<br />
to the city for the purpose of park and field irrigation.<br />
The two golf courses to the west of Bloemfontein as well as the botanical gardens (300 m 3 /day) currently<br />
use treated wastewater for irrigation purposes.<br />
The golf courses pay R 0.56/m 3 and the Botanical Gardens R 3 000/month.<br />
The potential exists for further re-use in Bloemfontein.<br />
2. OPTION DESCRIPTION<br />
This option entails the direct use of treated wastewater from any of the surrounding WWTW’s. Water could<br />
be distributed via an additional distribution system in the city for irrigation of public open spaces, school<br />
grounds, sport fields, and green street reserves (arterial roads with rose beddings etc). It could also be<br />
used for agricultural and industrial purposes where required.<br />
The scheme would include a new abstraction pump station at a WWTW, possibly the Bloemspruit WWTW<br />
due to its nearby proximity, a new distribution system, a possible elevated reservoir or in-line booster pump<br />
stations.<br />
<strong>Interventions</strong> <strong>Report</strong> June 2012
Water Reconciliation Strategy Study for the Large Bulk Water Supply Systems: Greater Bloemfontein Area 75<br />
3. OPTION YIELD<br />
A possible 100 hectares could be irrigated. The potential water re-use could be calculated as follows:<br />
Area: 100 ha<br />
Irrigation / day / area ± 5 mm<br />
Losses ± 30%<br />
Possible Re-use Volume / day 6.5 Ml/day<br />
4. UNIT REFERENCE VALUE<br />
No URVs have been determined for this option yet.<br />
5. POTENTIAL ECOLOGICAL IMPACTS<br />
No fatal flaws have been identified.<br />
6. POTENTIAL SOCIO-ECONOMICS IMPACTS<br />
Limited work opportunities could be created with the installation of the system.<br />
The use of treated wastewater on sports fields may have health implications. In 2004, the exemption<br />
for the use treated effluent by the University of the Free State was terminated due to health and<br />
environmental concerns (contact sport on the sports fields).<br />
7. POTENTIAL SURFACE WATER QUALITY IMPACTS<br />
No additional impact is foreseen, if treated effluent is used for irrigation purposes.<br />
<strong>Interventions</strong> <strong>Report</strong> June 2012
Water Reconciliation Strategy Study for the Large Bulk Water Supply Systems: Greater Bloemfontein Area 76<br />
SECTION E<br />
GROUN<strong>DWA</strong>TER<br />
<strong>Interventions</strong> <strong>Report</strong> June 2012
Water Reconciliation Strategy Study for the Large Bulk Water Supply Systems: Greater Bloemfontein Area 77<br />
1. BACKGROUND<br />
E. Groundwater<br />
The primary study area is located within the Karoo Super Group geology. Dewetsdorp and Thaba Nchu<br />
sedimentary geology is characterised by purple and green shale and thick sandstone beds of the upper<br />
stage of the Beaufort Group. Reddersburg is also located in the Beaufort Group of the Karoo Super Group<br />
and the sedimentary geology is characterised by sandstone, shale, and mudstone beds of the middle stage<br />
of the Beaufort Group.<br />
Ikgomotseng and Edenburg are located in the Beaufort Group and more specifically in the Adelaide<br />
Formation of the Karoo Super Group. The sedimentary geology of Ikgomotseng is characterised by<br />
mudstone and sandstone beds. The geology of Edenburg is characterised by blue-grey and purple<br />
mudstones, which are interbedded with yellow sandstone and siltstone. The sedimentary geology of<br />
Wepener consists of feldspatic sandstone and grit as well as green shales of the Molteno stage of the<br />
Stormberg Group. The Bloemfontein geology consists of sandstone, shale, and mudstone of the lower<br />
stage of the Beaufort Group. The north-western side of Bloemfontein sedimentary geology has been<br />
intensively intruded by magmatic dolerite intrusives such as sills and dykes.<br />
The sedimentary geology of Ikgomotseng, Thaba Nchu, Reddersburg, Edenburg, Dewetsdorp and<br />
Wepener has also been intruded by magmatic dolerite intrusive structures, which includes sills and dykes.<br />
The baked contact zones between the dolerite intrusion and the sedimentary host rock has lead to the<br />
formation of fracture zones, which are the main source of groundwater. The contact between dolerite dykes<br />
and the host rock, within the weathered zone, remains therefore the most important target for groundwater<br />
exploration.<br />
Geological maps and aerial magnetic maps have revealed the presence of dolerite intrusives such as dykes<br />
and sill structures. Aerial photo interpretation has been utilised extensively for the preparation of the<br />
groundwater interventions due to limitation of the study to desktop and conceptual level for groundwater.<br />
No detailed geophysical maps exist regarding the spatial distribution of the dolerite dykes and sills of the<br />
study area and therefore aerial photo interpretation was employed to give an indication of the presence of<br />
lineaments in the target areas within the study area. The aerial photo interpretations revealed the presence<br />
on numerous lineaments in targets areas of the proposed groundwater interventions. Commercial irrigation<br />
from groundwater resources was also utilised as an indication of the groundwater abstraction potential. It<br />
must be noted that the aerial photo interpretation is based on visible lineaments on the surface and needs<br />
to be confirmed with proper field geophysical techniques and surveys. It is also important to note that aerial<br />
photo interpretations cannot detect deeper lying geological structures, which are not visible on the surface.<br />
Should any of the interventions be considered as a viable option for implementation in the near future it is<br />
recommended that a geophysical feasibility study be undertaken that includes field geophysical surveys to<br />
confirm the presence of dolerite dykes that were interpreted as lineaments as well as the identification of<br />
smaller dolerite intrusive structures not visible from aerial photo interpretations or aerial magnetics maps.<br />
The following potential groundwater interventions were identified and are located within the boundaries of<br />
the primary study area:<br />
Groundwater Intervention (1) - Ikgomotseng: This small community is located approximately<br />
45 km north west of Bloemfontein near the Krugersdrift Dam. Ikgomotseng derives its domestic<br />
water from the Krugersdrift Dam. In 2008 GHT Consulting performed groundwater exploration for the<br />
<strong>Interventions</strong> <strong>Report</strong> June 2012
Water Reconciliation Strategy Study for the Large Bulk Water Supply Systems: Greater Bloemfontein Area 78<br />
Ikgomotseng community to supplement the water resources (see Section E1 for the description of<br />
the proposed intervention).<br />
Groundwater Intervention (2) - Bloemfontein: The city of Bloemfontein currently utilised<br />
groundwater resources for their water requirements. The Bainsvlei irrigation area is situated to the<br />
northern and western side of Bloemfontein. The water used for irrigation in this area is<br />
predominantly provided by groundwater resources. The area is a known source of groundwater in<br />
relatively large volumes and was the subject of an earlier <strong>DWA</strong> study known as the Kalkveld<br />
Management Project. It is therefore proposed that the area as a whole or a section of the area be<br />
utilised for the groundwater needs of Bloemfontein should it be required in the future. See Section<br />
E2 for the proposed groundwater intervention.<br />
Groundwater Intervention (3) - Thaba Nchu: The Thaba Nchu area is situated approximately 58<br />
km east from Bloemfontein. The area is characterised by very small to medium sized communities<br />
that depend on surface water (Bloemwater) and groundwater for their domestic water needs. An<br />
unknown number of boreholes is utilised for water supply purposes. For the groundwater<br />
intervention it is proposed that a typical rural water supply approach be followed for the small<br />
communities of Thaba Nchu (see Section E3 for the description of the proposed intervention).<br />
Groundwater Intervention (4) - Reddersburg: The community of Reddersburg is located 60 km<br />
south-east of Bloemfontein. The current domestic water need for Reddersburg is supplied mainly<br />
from surface water resources (Bloemwater) and to a lesser extent from the groundwater resources of<br />
the commonage. The local municipality has an agreement with Bloemwater that a certain volume<br />
of water derived from surface water (pipeline) must be utilised on a monthly scale (see Section E4<br />
for the description of the proposed intervention).<br />
Groundwater Intervention (5) - Edenburg: The community of Edenburg is located 60 km south<br />
east of Bloemfontein. The current domestic water need for Edenburg is supplied mainly from surface<br />
water resources (Bloemwater) and to a lesser extent from the groundwater resources of the<br />
commonage. The local municipality has an agreement with Bloemwater that a certain volume of<br />
water derived from surface water (pipeline) must be utilised on a monthly scale (see Section E5 for<br />
the description of the proposed intervention).<br />
Groundwater Intervention (6) - Dewetsdorp: The community of Dewetsdorp is located 68 km<br />
south east of Bloemfontein. The current domestic water need for Dewetsdorp is supplied mainly<br />
from surface water resources (Bloemwater) and to a lesser extent from the groundwater resources<br />
of the commonage (see Section E6 for the description of the proposed intervention).<br />
Groundwater Intervention (7) – Wepener: The community of Wepener is located 104 km south<br />
east of Bloemfontein. The current domestic water need for Wepener is supplied mainly from surface<br />
water resources (Bloemwater) and to a lesser extent from the groundwater resources of the<br />
commonage (see Section E7 for the description of the proposed intervention).<br />
Groundwater <strong>Interventions</strong> (8 & 9) – Well field developments along the route of the existing<br />
pipelines: <strong>DWA</strong> suggested that the possibility of developing well fields along the route of existing<br />
pipelines such as the Botshabelo / Thaba Nchu pipeline, Dewetsdorp pipeline, Edenburg pipeline<br />
and the Caledon pipeline be investigated. The potential possibilities for this particular intervention<br />
can be studied in section 2 (see Section E8 for the description of the proposed intervention).<br />
<strong>Interventions</strong> <strong>Report</strong> June 2012
Water Reconciliation Strategy Study for the Large Bulk Water Supply Systems: Greater Bloemfontein Area 79<br />
Edenburg<br />
Ikgomotseng<br />
Bloemfontein<br />
Reddersburg<br />
Dewetsdorp<br />
Figure 2: A General Hydrolithology Map of the Study Area as Supplied by <strong>DWA</strong><br />
Thaba Nchu<br />
Wepener<br />
<strong>Interventions</strong> <strong>Report</strong> June 2012
Water Reconciliation Strategy Study for the Large Bulk Water Supply Systems: Greater Bloemfontein Area 80<br />
1. OPTION LAYOUT<br />
E1. Ikgomotseng Aquifer<br />
Figure 3: The Ikgomotseng groundwater intervention area. The production boreholes are<br />
to be drilled on the southern side of the dolerite sill intrusion, which is also on<br />
the southern side of the storage reservoir for the Krugersdrift Dam water.<br />
Ikgomotseng is a small community located approximately 45 km north-west of Bloemfontein near the<br />
Krugersdrift Dam. Ikgomotseng derives its domestic water from the Krugersdrift Dam.<br />
2. OPTION DESCRIPTION<br />
Exploration Area to be targeted<br />
The small scale groundwater exploration programme conducted by GHT Consulting in 2008 confirmed<br />
the presence of a large dolerite sill structure on the community trust property of Ikgomotseng. Three<br />
boreholes were drilled. The average sustainable yield of the two successful boreholes derived from<br />
drilling was 31 536 m 3 /a. The groundwater quality was found to be of concern due to the presence of<br />
elevated fluoride concentrations. For this groundwater intervention it is proposed that at least 10<br />
boreholes be sited geophysically, percussion drilled and aquifer test pumped to determine the<br />
sustainable abstraction rates of the newly drilled boreholes. The boreholes are to be positioned on<br />
the commonage and trust property of Ikgomotseng. The boreholes are to be equipped according to<br />
the sustainable abstraction rate recommendations. The abstracted groundwater is to be pumped to<br />
<strong>Interventions</strong> <strong>Report</strong> June 2012
Water Reconciliation Strategy Study for the Large Bulk Water Supply Systems: Greater Bloemfontein Area 81<br />
the Ikgomotseng main reservoir for conjunctive use with the surface water (Krugersdrift Dam) as well<br />
as for dilution of the potential high fluoride concentrations or for treatment if necessary.<br />
3. Scheme Yield<br />
The Ikgomotseng scheme yield:<br />
Proposed<br />
Scheme<br />
Name<br />
Ikgomotseng<br />
Number<br />
of<br />
New<br />
Scheme<br />
Boreholes<br />
10<br />
production<br />
Number<br />
of<br />
Existing<br />
Scheme<br />
Boreholes<br />
Estimated<br />
Average<br />
Yield of 10<br />
New<br />
Boreholes<br />
(m 3 /a)<br />
Estimated<br />
Average<br />
Yield of<br />
Existing<br />
Boreholes<br />
(m 3 /a)<br />
Total<br />
Estimated<br />
Average<br />
Yield<br />
(m 3 /a)<br />
Average<br />
Rainfall<br />
(mm/a)<br />
Vegter<br />
Recharge<br />
Percentage<br />
(20 mm/a) (%)<br />
Vegter<br />
Recharge<br />
To Aquifer<br />
(m 3 /a)<br />
2 177,390 31,536 208,926 482 4 231,200<br />
The estimated scheme yields were calculated by using the average sustainable yields estimated from<br />
data on the Karoo geology well fields of Petrusburg / Bolokanang, Edenville / Ngwathe, and<br />
Ikgomotseng for all the groundwater interventions except for the Bloemfontein / Bainsvlei intervention.<br />
The average sustainable yield estimated for a borehole was 48.6 m 3 /d over a 10-hour pump cycle per<br />
day. The recharge volumes to the local aquifers of the well fields were determined by using a<br />
recharge percentage of the Vegter recharge maps, the mean annual rainfall of the different localities,<br />
as well as the sizes of the commonages of the local municipalities. It must noted the capture zones of<br />
the conceptual well fields may differ from the assumed surface areas and are also influenced by the<br />
presence of preferential pathways resulting from dolerite intrusives as well as the topography of the<br />
selected localities of the well fields. A recharge surface of 3.4 km x 3.4 km was assumed for the<br />
Ikgomotseng scheme.<br />
4. UNIT REFERENCE VALUE<br />
The URVs for this option are based on an estimate costing performed and on assumed average yields<br />
per borehole.<br />
ITEM<br />
Discount Rate<br />
4 %<br />
Discount Rate<br />
6 %<br />
Discount Rate<br />
8 %<br />
Total capital cost (R million) 8.4 8.4 8.4<br />
Annual operating cost (R mill /annum) 0.24 0.24 0.24<br />
NPV Cost (R million) 13.0 11.2 10.2<br />
Unit Reference Value (R/m 3 ) 3.54 4.34 5.20<br />
Note that the URV excludes escalation and chemical treatment costs, but includes infrastructure and<br />
operating costs.<br />
<strong>Interventions</strong> <strong>Report</strong> June 2012
Water Reconciliation Strategy Study for the Large Bulk Water Supply Systems: Greater Bloemfontein Area 82<br />
5. OTHER ISSUES<br />
Potential environmental impacts of utilising well fields include dewatering or lowering of<br />
sustainable yield of the local aquifer due to mismanagement or over utilisation. If the utilisation<br />
of well fields is not monitored and managed in a sustainable manner it may impact adjacent<br />
landowners, who may utilise groundwater for agricultural purposes and vice versa where the<br />
private landowner may have an impact on the groundwater resources of the well field.<br />
The groundwater quality was found to be of concern due to the presence of elevated fluoride<br />
concentrations.<br />
Contamination of the local aquifer by means of surface activities such as on-site sanitation,<br />
landfill sites, and leaking, unlined or over flowing sewage treatment works (oxidation dams) also<br />
poses a threat to the access to clean groundwater resources for communities.<br />
<strong>Interventions</strong> <strong>Report</strong> June 2012
Water Reconciliation Strategy Study for the Large Bulk Water Supply Systems: Greater Bloemfontein Area 83<br />
1. OPTION LAYOUT<br />
E2. Bloemfontein aquifer<br />
Figure 4: Locality map of the proposed Bainsvlei well field. The regions marked by the<br />
green polygons denote the areas where the well fields are proposed. These areas<br />
show the highest yield potential. This is based on the current density of<br />
established irrigation using groundwater. Also note the irrigation pivot circles on<br />
the aerial photo within the green polygons.<br />
The city of Bloemfontein currently does not utilise groundwater resources for its water requirements.<br />
The Bainsvlei irrigation area is situated to the northern and western side of Bloemfontein. The main<br />
source of water for irrigation in this area is provided by groundwater resources. This area is a known<br />
source of groundwater, which can supply relatively large volumes, and was the subject of an earlier<br />
<strong>DWA</strong> study known as the Kalkveld Management Project. It is therefore proposed that the area as a<br />
whole, or a section of the area, be utilised to meet the groundwater requirements of Bloemfontein<br />
should it be required in the future.<br />
<strong>Interventions</strong> <strong>Report</strong> June 2012
Water Reconciliation Strategy Study for the Large Bulk Water Supply Systems: Greater Bloemfontein Area 84<br />
2. OPTION DESCRIPTION<br />
The information presented below was adapted from a report titled: “Establishment of a Groundwater<br />
Management Plan for the Kalkveld Water User Association” (2004) as well as discussions regarding<br />
the proposed groundwater intervention with one of the main authors, Prof. G. van Tonder (The<br />
Institute for Groundwater Studies, UFS).<br />
In order to provide groundwater for Bloemfontein, it is proposed that the Bainsvlei area of the Kalkveld<br />
region be developed as a well field. In the terms of the scale of water consumption in Bloemfontein<br />
(approximately 60 - 80 Mm 3 /a), the Bainsvlei area (Zone 2) to the immediate north-western side of<br />
Bloemfontein should be developed as it can potentially provide 28 Mm 3 /a of water sustainably.<br />
Another area of interest, which can potentially provide groundwater for Bloemfontein, is the De Brug /<br />
Hagesdam aquifer. However, this area is deemed less attractive than the Bainsvlei area due to the<br />
fact that the current commercial abstraction (15.3 Mm 3 /a) is less than the estimated recharge volume<br />
of 33 Mm 3 /a. The reason for this is that only approximately 25 – 30% (western area) of the Zone 4 is<br />
utilised for commercial irrigation, which is possibly due to the absence or a less dense distribution of<br />
water bearing dolerite intrusive structures in Zone 4. The De Brug / Hagesdam area is therefore less<br />
attractive for well-field development, due to the lack of available groundwater that can be abstracted<br />
by means geological structures. De Brug / Hagesdam can also be considered a groundwater<br />
intervention for Bloemfontein but to a lesser extent.<br />
Bainsvlei and De Brug / Hagesdam can be combined as one intervention that can potentially yield<br />
43.3 Mm 3 /a but will mean the cessation of all commercial irrigation activities and appropriation of<br />
private landowner’s properties on a large scale making this groundwater intervention unfeasible due to<br />
the socio-economic impacts. The Petrusburg area was also taken into account, however the aquifer’s<br />
closest boundary is approximately 50 km from Bloemfontein and the furthest approximately 93 km.<br />
Therefore it is unlikely to be developed. The Petrusburg aquifer displays more potential in terms of<br />
sustainable utilisation of groundwater available (69 Mm 3 /a) but it is also utilised extensively for<br />
commercial irrigation.<br />
The groundwater intervention selected for this project is based on utilising the Bainsvlei aquifer and<br />
should be seen as an augmentation option for surface water resources, if future need should arise.<br />
The intensive commercial agricultural irrigation from groundwater resources in the Bainsvlei area<br />
indicate that the dolerite intrusive structures, which form the main target zones for groundwater<br />
exploration and abstraction, are present in sufficient spatial density for the development of well fields<br />
for production purposes. The surface area of the proposed Bainsvlei wellfield is 1 565 km 2 , the<br />
recharge percentage from mean annual rainfall is approximately 4%, which equates to 28 Mm 3 /a. The<br />
current abstraction from the proposed Bainsvlei wellfield area by predominantly commercial irrigators<br />
is 48.5 Mm 3 which is significantly more than the current annual recharge to the aquifer, indicating that<br />
the aquifer is currently being used in an unsustainable manner. The water bearing intrusive dolerites<br />
are usually identified by geophysical means such as the magnetic method or EM34. Currently no<br />
maps have been compiled to indicate the intrusive structures spatially on such scale and detail for the<br />
Kalkveld area.<br />
The groundwater intervention option for Bloemfontein proposes that Bainsvlei be developed as a<br />
conceptual intervention that can potentially yield 28 Mm 3 /a of water to Bloemfontein, which is equal to<br />
the average annual recharge available to the area and therefore can be sustainably abstracted. The<br />
average sustainable yield of a borehole is 43 362 m 3 /a if sited correctly on a dolerite dyke structure.<br />
The structures will have to be pinpointed by means of field geophysical surveys and spaced and<br />
<strong>Interventions</strong> <strong>Report</strong> June 2012
Water Reconciliation Strategy Study for the Large Bulk Water Supply Systems: Greater Bloemfontein Area 85<br />
aquifer tested for sustainability. Therefore approximately 645 boreholes are required to abstract<br />
28 Mm 3 /a of groundwater from the Bainsvlei area. The borehole field would be developed over a<br />
large surface area. Linked multiple storage facilities are envisaged that would eventually lead to a<br />
main storage facility at the well field site from where the water would be pumped 15 to 20 km to<br />
Bloemfontein.<br />
3. SCHEME YIELD<br />
The Bloemfontein scheme yield:<br />
Proposed<br />
Scheme<br />
Name<br />
Bloemfontein<br />
Number of<br />
New Scheme<br />
Boreholes<br />
675 (645<br />
production and<br />
30 standby)<br />
Number of<br />
Existing<br />
Scheme<br />
Boreholes<br />
Estimated<br />
Average<br />
Yield of<br />
645 New<br />
Boreholes<br />
(m 3 /a)<br />
Estimated<br />
Average<br />
Yield of<br />
Existing<br />
Boreholes<br />
(m 3 /a)<br />
Total<br />
Estimated<br />
Average<br />
Yield<br />
(m 3 /a)<br />
Average<br />
Rainfall<br />
(mm/a)<br />
Vegter<br />
Recharge<br />
Percentage<br />
(20 mm/a)<br />
(%)<br />
<strong>Interventions</strong> <strong>Report</strong> June 2012<br />
Vegter<br />
Recharge<br />
To Aquifer<br />
(m 3 /a)<br />
0 27,968,490 0 27,968,490 552 4 28,000,000<br />
The estimated scheme yields for other proposed intervations were calculated by assuming that the<br />
average sustainable yield for each borehole was 48.6 m 3 /d over a 10-hour pump cycle per day. For<br />
the Bloemfontein groundwater intervention, however, information from the Kalkveld <strong>Report</strong> was<br />
utilised to obtain an average yield of 118.8 m 3 /d over a 10-hour pump cycle per day per borehole.<br />
The recharge volumes to the local aquifers of the well field was determined by using a recharge<br />
percentage of the Vegter recharge maps as well as the mean annual rainfall of the area and a surface<br />
area of 1 565 km 2 .<br />
4. UNIT REFERENCE VALUE<br />
The URVs for this option are based on estimated costing and on assumed average yields per<br />
borehole.<br />
ITEM<br />
Discount Rate<br />
4 %<br />
Discount Rate<br />
6 %<br />
Discount Rate<br />
8 %<br />
Total capital cost (R million) 4 743 4 743 4 743<br />
Annual operating cost (R mill /annum) 39 39 39<br />
NPV Cost (R million) 4 388 4 753 4 465<br />
Unit Reference Value (R/m 3 ) 9.60 12.66 16.06<br />
Note that the URV excludes escalation and chemical treatment costs, but includes infrastructure and<br />
operating costs.
Water Reconciliation Strategy Study for the Large Bulk Water Supply Systems: Greater Bloemfontein Area 86<br />
5. OTHER ISSUES<br />
Potential environmental impacts of well fields include dewatering or lowering of sustainable yield of the<br />
local aquifer due to mismanagement or over utilisation. If the utilisation of well fields is not monitored<br />
and managed in a sustainable manner it may impact adjacent landowners, which may utilise<br />
groundwater for agricultural purposes and vice versa where the private landowners have an impact on<br />
the groundwater resources of the well field.<br />
Bainsvlei and De Brug / Hagesdam can be combined as one option that can potentially yield 43.3<br />
Mm 3 /a, but this will result in the cessation of all commercial irrigation activities and appropriation of<br />
private landowner’s properties on large scale making this groundwater intervention unfeasible due to<br />
the socio-economic impacts<br />
<strong>Interventions</strong> <strong>Report</strong> June 2012
Water Reconciliation Strategy Study for the Large Bulk Water Supply Systems: Greater Bloemfontein Area 87<br />
1. OPTION LAYOUT<br />
E3. Thaba Nchu Aquifer<br />
Figure 5: The locality map of Thaba Nchu. Lineaments (red polylines) were<br />
indentified, which indicate potential water bearing dykes to the north west<br />
and south west of Thaba Nchu.<br />
The Thaba Nchu area is situated approximately 58 km east from Bloemfontein. The area is<br />
characterised by groups of very small to medium sized communities that are depended on surface<br />
water (supplied by Bloemwater) and groundwater for their domestic water requirements. An unknown<br />
number of boreholes are utilised for water supply purposes. For this groundwater intervention, it is<br />
proposed that a typical rural water supply approach be followed for the small communities of Thaba<br />
Nchu.<br />
2. OPTION DESCRIPTION<br />
The proposed groundwater intervention for Thaba Nchu would use a rural water supply approach and<br />
it is assumed that the area will remain rural for the immediate future. Existing information regarding<br />
Thaba Nchu indicates that the some of the water needs of Thaba Nchu are derived from surface water<br />
sources (Bloemwater pipeline). A large number of boreholes are also utilised for the water<br />
requirements of the smaller Thaba Nchu communities. Existing information indicated that the<br />
groundwater qualities in these rural settlements are poor due to unlined or leaking on-site sanitation<br />
such as ventilated-in-pit latrines (VIPs).<br />
<strong>Interventions</strong> <strong>Report</strong> June 2012
Water Reconciliation Strategy Study for the Large Bulk Water Supply Systems: Greater Bloemfontein Area 88<br />
It is therefore proposed that only the smaller communities be equipped with boreholes and that these<br />
would be located far enough from the settlements to minimise potential contamination impacts by onsite<br />
sanitation. It is proposed that 50 boreholes be drilled not less than 300 m beyond the outskirts of<br />
the settlements and that these be equipped with motorised pumps connected to small reservoirs<br />
located within the rural settlements.<br />
It is estimated conceptually that, on the basis of a yield per borehole of 48.6 m 3 /d, the proposed rural<br />
wellfield can yield approximately 0.89 Mm 3 /a. The development of a dedicated well field in<br />
the vicinity of Thaba Nchu was ruled out due to the insufficient number of groundwater irrigation areas<br />
or lineaments displayed by the area on aerial photos and aerial magnetic data. The Thaba Nchu area<br />
is underlain by thick sandstone formations with a low spatial density of dolerite dyke intrusives and<br />
therefore not conducive to large scale groundwater abstraction in well field format. The observations<br />
regarding the presence of dolerite intrusives and groundwater potential were performed with aerial<br />
photo interpretation and aerial magnetic maps. Should the well field option be considered a necessity<br />
to meet the future water requirements of the Thaba Nchu / Botshabelo area a detailed geophysical /<br />
remote sensing study will have to be performed to determine the feasibility of large scale groundwater<br />
abstraction by means of wellfields.<br />
3. OPTION YIELD<br />
The Thaba Nchu rural water supply scheme yield:<br />
Proposed<br />
Scheme<br />
Name<br />
Thaba Nchu<br />
Number<br />
of<br />
New<br />
Scheme<br />
Boreholes<br />
50<br />
production<br />
Number<br />
of<br />
Existing<br />
Scheme<br />
Boreholes<br />
Estimated<br />
Average<br />
Yield of 50<br />
New<br />
Boreholes<br />
(m 3 /a)<br />
Estimated<br />
Average<br />
Yield of<br />
Existing<br />
Boreholes<br />
(m 3 /a)<br />
Total<br />
Estimated<br />
Average<br />
Yield<br />
(m 3 /a)<br />
Average<br />
Rainfall<br />
(mm/a)<br />
Vegter<br />
Recharge<br />
Percentage<br />
(20 mm/a) (%)<br />
<strong>Interventions</strong> <strong>Report</strong> June 2012<br />
Vegter<br />
Recharge<br />
To Aquifer<br />
(m 3 /a)<br />
0 886,950 0 886,950 613 3 2,000,000<br />
The estimated scheme yields were calculated by using the average sustainable yields of the Karoo<br />
geology well fields of Petrusburg / Bolokanang, Edenville / Ngwathe, and Ikgomotseng for all the<br />
groundwater interventions except for the Bloemfontein / Bainsvlei intervention. The average<br />
sustainable yield derived for a borehole was 48.6 m 3 /d over a 10-hour pump cycle per day. The<br />
recharge volumes to the local aquifers of the boreholes were determined by using a recharge<br />
percentage from the Vegter recharge maps as well as the mean annual rainfall of the area and an<br />
estimated surface area of 10 km x 10 km.<br />
4. UNIT REFERENCE VALUE<br />
The URVs for this option are based on the estimated costing and on the assumed average yields per<br />
borehole.
Water Reconciliation Strategy Study for the Large Bulk Water Supply Systems: Greater Bloemfontein Area 89<br />
ITEM<br />
Discount Rate<br />
4 %<br />
Discount Rate<br />
6 %<br />
Discount Rate<br />
8 %<br />
Total capital cost (R million) 32.7 32.7 32.7<br />
Annual operating cost (R mill /annum) 2.1 2.1 2.1<br />
NPV Cost (R million) 74 61 53<br />
Unit Reference Value (R/m 3 ) 4.14 4.76 5.43<br />
Note that the URV excludes escalation and chemical treatment costs, but includes infrastructure and<br />
operating costs.<br />
5. OTHER ISSUES<br />
Potential environmental impacts of well fields include dewatering or lowering of sustainable<br />
yield of the local aquifer due to mismanagement or over utilisation. If the utilisation of well fields<br />
is not monitored and managed in a sustainable manner it may impact adjacent landowners,<br />
which may utilise groundwater for agricultural purposes and vice versa where the private<br />
landowner have an impact on the groundwater resources of the well field.<br />
Contamination of the local aquifer by means of surface activities such as on-site sanitation,<br />
landfill sites, leaking, or unlined or over flowing sewage treatment works (oxidation dams) also<br />
poses a threat to the access to clean groundwater resources for communities.<br />
<strong>Interventions</strong> <strong>Report</strong> June 2012
Water Reconciliation Strategy Study for the Large Bulk Water Supply Systems: Greater Bloemfontein Area 90<br />
E4, 5, 6, and 7. Town Groundwater <strong>Interventions</strong><br />
1. OPTION LAYOUT<br />
The towns of Reddersburg (E4), Edenburg (E5), Dewetsdorp (E6), and Wepener (E7) receive surface<br />
water via a pipeline from Bloemwater. At least 70% of the water requirements of the towns must be<br />
derived from the pipeline and 30% from groundwater resources. Aerial photo interpretation revealed<br />
lineaments on the commonages, which may indicate potential dolerite dykes that may be targeted for<br />
groundwater abstraction purposes. Due to the existing boreholes on the commonages it is proposed<br />
that only five more production boreholes be developed for groundwater abstraction on each of the<br />
towns’ commonages. The estimated recharge volumes to the commonage indicted that if the<br />
additional proposed boreholes are drilled and utilised the commonages will reach their limit in terms<br />
of sustainable utilisation.<br />
<strong>Interventions</strong> <strong>Report</strong> June 2012
Water Reconciliation Strategy Study for the Large Bulk Water Supply Systems: Greater Bloemfontein Area 91<br />
E4. Reddersburg Town Groundwater <strong>Interventions</strong><br />
1. OPTION LAYOUT<br />
Figure 6: The locality map of Reddersburg. Lineaments (red polylines) were indentified,<br />
which indicate potential water bearing dykes to the north and south west of the<br />
town on commonage.<br />
The community of Reddersburg is located 60 km south east of Bloemfontein. The current domestic<br />
water need for Reddersburg is derived from mainly surface water resources (Bloemwater) and to a<br />
lesser extent from groundwater resources. The local municipality has an agreement with Bloemwater<br />
that a certain volume of water derived from surface water (pipeline) must be utilised on a monthly<br />
scale.<br />
2. OPTION DESCRIPTION<br />
Aerial photo interpretations indicate the presence of lineaments and potential dolerite intrusives on<br />
and in the vicinity of the commonage of the town that can possibly be exploited for groundwater<br />
abstraction purposes. The groundwater intervention proposed for Reddersburg entails the drilling of<br />
eight new boreholes to be sited geophysically as well as the reconstruction or re-drilling of at least two<br />
existing boreholes in the eventuality of borehole collapse. Three of the eight boreholes will form part<br />
of the support production boreholes during well field maintenance and water emergencies. It appears<br />
from available records that the nine existing production boreholes were never aquifer test pumped to<br />
determine the sustainable abstraction rates. It is therefore proposed that the existing production<br />
boreholes be aquifer test pumped with the newly drilled boreholes to determine the sustainable yield<br />
of the commonage well field. Refurbishing of current production borehole equipment as well as the<br />
equipping of the newly drilled boreholes according to the sustainable rate recommendations is also<br />
<strong>Interventions</strong> <strong>Report</strong> June 2012
Water Reconciliation Strategy Study for the Large Bulk Water Supply Systems: Greater Bloemfontein Area 92<br />
proposed. It is estimated conceptually that the proposed well field can yield approximately<br />
0.24 Mm 3 /a.<br />
3. OPTION YIELD<br />
The Reddersburg scheme yield:<br />
Proposed<br />
Scheme Name<br />
Reddersburg<br />
Number<br />
of<br />
New<br />
Scheme<br />
Boreholes<br />
8 (5<br />
production<br />
and 3<br />
standby)<br />
Number<br />
of<br />
Existing<br />
Scheme<br />
Boreholes<br />
Estimated<br />
Average<br />
Yield of 5<br />
New<br />
Boreholes<br />
(m 3 /a)<br />
Estimated<br />
Average<br />
Yield of<br />
Existing<br />
Boreholes<br />
(m 3 /a)<br />
Total<br />
Estimated<br />
Average<br />
Yield<br />
(m 3 /a)<br />
Average<br />
Rainfall<br />
(mm/a)<br />
Vegter<br />
Recharge<br />
Percentage<br />
(20 mm/a) (%)<br />
<strong>Interventions</strong> <strong>Report</strong> June 2012<br />
Vegter<br />
Recharge<br />
To Aquifer<br />
(m 3 /a)<br />
9 88,695 159,651 248,346 491 4 252,000<br />
The estimated scheme yields were calculated by using the average sustainable yields of the Karoo<br />
geology well fields of Petrusburg / Bolokanang, Edenville / Ngwathe, and Ikgomotseng for all the<br />
groundwater interventions except for the Bloemfontein / Bainsvlei intervention. The average<br />
sustainable yield derived for a borehole was 48.6 m 3 /d over a 10-hour pump cycle per day. The<br />
recharge volumes to the local aquifers of the boreholes were determined by using a recharge<br />
percentage from the Vegter recharge maps as well as the mean annual rainfall of the area and an<br />
assumed size of the commonage of the local municipality of 4.2 km x 3 km.<br />
4. UNIT REFERENCE VALUE<br />
The URVs for this option are based on the estimated costing and on the assumed average yield per<br />
borehole.<br />
ITEM<br />
Discount Rate<br />
4 %<br />
Discount Rate<br />
6 %<br />
Discount Rate<br />
8 %<br />
Total capital cost (R million) 6.7 6.7 6.7<br />
Annual operating cost (R mill /annum) 0.28 0.28 0.28<br />
NPV Cost (R million) 12.0 10.2 9.1<br />
Unit Reference Value (R/m 3 ) 6.72 8.00 9.37<br />
Note that the URV excludes escalation and chemical treatment costs, but includes infrastructure and<br />
operating costs.<br />
6. OTHER ISSUES<br />
Potential environmental impacts of well fields include dewatering or lowering of sustainable yield<br />
of the local aquifer due to mismanagement or over utilisation. If the utilisation of well fields is<br />
not monitored and managed in a sustainable manner it may impact adjacent landowners, which<br />
may utilise groundwater for agricultural purposes and vice versa where the private landowner<br />
have an impact on the groundwater resources of the well field.
Water Reconciliation Strategy Study for the Large Bulk Water Supply Systems: Greater Bloemfontein Area 93<br />
Contamination of the local aquifer by means of surface activities such as on-site sanitation,<br />
landfill sites, leaking, or unlined or over flowing sewage treatment works (oxidation dams) also<br />
poses a threat to the access to clean groundwater resources for communities.<br />
5. SOURCE OF DATA<br />
Refer to Appendix A for the report Groundwater Potential for Small Towns which was the source of<br />
the data used in deriving the proposed groundwater interventions. In that report upper and lower<br />
boundaries for the yields of the dolerite dyke structures in the vicinities of the towns are estimated.<br />
The upper boundaries were derived from the geometric mean of sustainable yield calculations using<br />
aquifer test data from a number of wellfields in the Karoo Super Group geology, including those of<br />
Petrusburg / Bolokanang, Edenville / Ngwathe, and Ikgomotseng. These calculations gave an average<br />
yield per borehole of 60.48 m 3 /d. The lower boundaries were derived from recharge water budget<br />
calculations which gave significantly lower yields. Consequently, a conservative value of 80% of the<br />
upper boundary of 60.48 m 3 /d per borehole was used for the groundwater intervention calculations.<br />
This value was 48.6 m 3 d per borehole.<br />
<strong>Interventions</strong> <strong>Report</strong> June 2012
Water Reconciliation Strategy Study for the Large Bulk Water Supply Systems: Greater Bloemfontein Area 94<br />
E5. Edenburg Town Groundwater <strong>Interventions</strong><br />
1. OPTION LAYOUT<br />
Figure 7: The locality map of Edenburg. Lineaments (red polylines) were indentified,<br />
which indicate potential water bearing dykes to the north east of the town on<br />
commonage.<br />
The community of Edenburg is located 60 km south east of Bloemfontein. The current domestic water<br />
need for Edenburg is derived from mainly surface water resources (Bloemwater) and to a lesser<br />
extent from groundwater resources. The local municipality has an agreement with Bloemwater that a<br />
certain volume of water derived from surface water (pipeline) must be utilised on a monthly scale.<br />
2. OPTION DESCRIPTION<br />
Aerial photo interpretations indicate the presence of lineaments and potential dolerite intrusives on<br />
and in the vicinity of the commonage of the town that can possibly be exploited for groundwater<br />
abstraction purposes. The groundwater intervention proposed for Edenburg entails the drilling of eight<br />
new boreholes to be sited geophysically as well as the reconstruction or re-drilling of at least two<br />
existing boreholes in the eventually of borehole collapse. Three of the eight boreholes will form part of<br />
the support production boreholes during well field maintenance and water emergencies. Available<br />
information indicates that the 12 existing production boreholes were never aquifer test pumped to<br />
determine the sustainable abstraction rates. It is therefore proposed that the existing production<br />
boreholes be aquifer test pumped with the newly drilled boreholes to determine the sustainable yield<br />
<strong>Interventions</strong> <strong>Report</strong> June 2012
Water Reconciliation Strategy Study for the Large Bulk Water Supply Systems: Greater Bloemfontein Area 95<br />
of the commonage well field. Refurbishing of current production borehole equipment as well as the<br />
equipping of the newly drilled boreholes according to the sustainable rate recommendations is also<br />
proposed. It is estimated conceptually that the proposed well field can yield approximately<br />
0.30 Mm 3 /a.<br />
3. OPTION YIELD<br />
The Edenburg scheme yield:<br />
Proposed<br />
Scheme Name<br />
Edenburg<br />
Number<br />
of<br />
New<br />
Scheme<br />
Boreholes<br />
8 (5<br />
production<br />
and 3<br />
standby)<br />
Number<br />
of<br />
Existing<br />
Scheme<br />
Boreholes<br />
Estimated<br />
Average<br />
Yield of 5<br />
New<br />
Boreholes<br />
(m 3 /a)<br />
Estimated<br />
Average<br />
Yield of<br />
Existing<br />
Boreholes<br />
(m 3 /a)<br />
Total<br />
Estimated<br />
Average<br />
Yield<br />
(m 3 /a)<br />
Average<br />
Rainfall<br />
(mm/a)<br />
Vegter<br />
Recharge<br />
Percentage<br />
(20 mm/a) (%)<br />
<strong>Interventions</strong> <strong>Report</strong> June 2012<br />
Vegter<br />
Recharge<br />
To Aquifer<br />
(m 3 /a)<br />
12 88,695 212,868 301,563 441 5 400,000<br />
The estimated scheme yields were calculated by using the assumed average sustainable yields of the<br />
Karoo geology well fields of Petrusburg / Bolokanang, Edenville / Ngwathe, and Ikgomotseng for all<br />
the groundwater interventions except for the Bloemfontein / Bainsvlei intervention. The average<br />
sustainable yield derived for each borehole was 48.6 m 3 /d over a 10-hour pump cycle per day. The<br />
recharge volumes to the local aquifers of the boreholes were determined by using a recharge<br />
percentage from the Vegter recharge maps as well as the mean annual rainfall of the area and an<br />
assumed area of commonage of 5 km x 4 km.<br />
.<br />
4. UNIT REFERENCE VALUE<br />
The URVs for this option are based on the estimated costing and on the assumed average yield per<br />
borehole.<br />
ITEM<br />
Discount Rate<br />
4 %<br />
Discount Rate<br />
6 %<br />
Discount Rate<br />
8 %<br />
Total capital cost (R million) 7 7 7<br />
Annual operating cost (R mill /annum) 0.33 0.33 0.33<br />
NPV Cost (R million) 13.3 11.2 9.9<br />
Unit Reference Value (R/m 3 ) 7.45 8.79 10.24<br />
Note that the URV excludes escalation and chemical treatment costs, but includes infrastructure and<br />
operating costs.
Water Reconciliation Strategy Study for the Large Bulk Water Supply Systems: Greater Bloemfontein Area 96<br />
5. OTHER ISSUES<br />
Potential environmental impacts of well fields include dewatering or lowering of sustainable<br />
yield of the local aquifer due to mismanagement or over utilisation. If the utilisation of well fields<br />
is not monitored and managed in a sustainable manner it may impact adjacent landowners,<br />
which may utilise groundwater for agricultural purposes and vice versa where the private<br />
landowner have an impact on the groundwater resources of the well field.<br />
Contamination of the local aquifer by means of surface activities such as on-site sanitation,<br />
landfill sites, leaking, or unlined or over flowing sewage treatment works (oxidation dams) also<br />
poses a threat to the access to clean groundwater resources for communities.<br />
<strong>Interventions</strong> <strong>Report</strong> June 2012
Water Reconciliation Strategy Study for the Large Bulk Water Supply Systems: Greater Bloemfontein Area 97<br />
E6. Dewetsdorp Town Groundwater <strong>Interventions</strong><br />
1. OPTION LAYOUT<br />
Figure 8: The locality map of Dewetsdorp. Lineaments (red polylines) were indentified, which<br />
indicate potential water bearing dykes to the east as well as the south-west of the<br />
town on commonage.<br />
The community of Dewetsdorp is located 68 km south east of Bloemfontein. The current domestic<br />
water need for Dewetsdorp is derived from mainly surface water resources (Bloemwater) and to a<br />
lesser extent from groundwater resources.<br />
2. OPTION DESCRIPTION<br />
Aerial photo interpretations indicate the presence of lineaments and potential dolerite intrusives on<br />
and in the vicinity of the commonage of the town that can possibly be exploited for groundwater<br />
abstraction purposes. The groundwater intervention proposed for Dewetsdorp entails the drilling of<br />
seven new boreholes to be sited geophysically. Two of the seven boreholes will form part of the<br />
support production boreholes during well field maintenance and water emergencies. Existing<br />
information indicates that the four production boreholes were re-constructed and aquifer test pumped<br />
in December 2007 to determined their sustainable abstraction rates. The combined sustainable rate<br />
of the four production boreholes is 80 154 m 3 /a. The newly drilled boreholes will be aquifer test<br />
pumped to determine their sustainable yields. Refurbishing of current production borehole equipment<br />
as well as the equipping of the newly drilled boreholes according to the sustainable rate<br />
<strong>Interventions</strong> <strong>Report</strong> June 2012
Water Reconciliation Strategy Study for the Large Bulk Water Supply Systems: Greater Bloemfontein Area 98<br />
recommendations is also proposed. It is estimated conceptually that the proposed well field can yield<br />
approximately 0.17 Mm 3 /a.<br />
3. OPTION YIELD<br />
The Dewetsdorp scheme yield:<br />
Proposed<br />
Scheme<br />
Name<br />
Dewetsdorp<br />
Number<br />
of<br />
New<br />
Scheme<br />
Boreholes<br />
7 (5<br />
production<br />
and 2<br />
standby)<br />
Number<br />
of<br />
Existing<br />
Scheme<br />
Boreholes<br />
Estimated<br />
Average<br />
Yield of 5<br />
New<br />
Boreholes<br />
(m 3 /a)<br />
Estimated<br />
Average<br />
Yield of<br />
Existing<br />
Boreholes<br />
(m 3 /a)<br />
Total<br />
Estimated<br />
Average<br />
Yield<br />
(m 3 /a)<br />
Average<br />
Rainfall<br />
(mm/a)<br />
Vegter<br />
Recharge<br />
Percentage<br />
(20 mm/a) (%)<br />
Vegter<br />
Recharge<br />
To Aquifer<br />
(m 3 /a)<br />
4 88,695 80,154 168,849 593 3 320,000<br />
The estimated scheme yields were calculated by using the average sustainable yields of the Karoo<br />
geology well fields of Petrusburg / Bolokanang, Edenville / Ngwathe and Ikgomotseng for all the<br />
groundwater interventions except for the Bloemfontein / Bainsvlei intervention. The average<br />
sustainable yield derived for a borehole was 48.6 m 3 /d over a 10-hour pump cycle per day. The<br />
recharge volumes to the local aquifers of the well fields were determined by using a recharge<br />
percentage from the Vegter recharge maps as well as the mean annual rainfall of the area and an<br />
assumed size of the commonage of 3.9 km x 3.6 km.<br />
4. UNIT REFERENCE VALUE<br />
The URVs for this option are based on estimated costing and on the assumed average yield per<br />
borehole.<br />
ITEM<br />
Discount Rate<br />
4 %<br />
Discount Rate<br />
6 %<br />
Discount Rate<br />
8 %<br />
Total capital cost (R million) 6.3 6.3 6.3<br />
Annual operating cost (R mill /annum) 0.2 0.2 0.2<br />
NPV Cost (R million) 10.0 8.7 7.8<br />
Unit Reference Value (R/m 3 ) 5.57 6.78 8.08<br />
Note that the URV excludes escalation and chemical treatment costs, but includes infrastructure and<br />
operating costs.<br />
<strong>Interventions</strong> <strong>Report</strong> June 2012
Water Reconciliation Strategy Study for the Large Bulk Water Supply Systems: Greater Bloemfontein Area 99<br />
5. OTHER ISSUES<br />
Potential environmental impacts of utilising well fields include dewatering or lowering of<br />
sustainable yield of the local aquifer due to mismanagement or over utilisation. If the utilisation<br />
of well fields is not monitored and managed in a sustainable manner it may impact adjacent<br />
landowners, which may utilise groundwater for agricultural purposes and vice versa where the<br />
private landowner have an impact on the groundwater resources of the well field.<br />
Contamination of the local aquifer by means of surface activities such as on-site sanitation,<br />
landfill sites, leaking or unlined or over flowing sewage treatment works (oxidation dams) also<br />
poses a threat to the access to clean groundwater resources for communities.<br />
<strong>Interventions</strong> <strong>Report</strong> June 2012
Water Reconciliation Strategy Study for the Large Bulk Water Supply Systems: Greater Bloemfontein Area 100<br />
E7. Wepener Town Groundwater <strong>Interventions</strong><br />
1. OPTION LAYOUT<br />
Figure 9: The locality map of Wepener. Lineaments (red polylines) were indentified, which<br />
indicate potential water bearing dykes to the north, north-east as well as the west<br />
of the town on commonage.<br />
The community of Wepener is located 104 km south east of Bloemfontein. The current domestic<br />
water need for Wepener is derived mainly from surface water resources (Bloemwater) and to a lesser<br />
extent from groundwater resources.<br />
2. OPTION DESCRIPTION<br />
Aerial photo interpretations indicate the presence of lineaments and potential dolerite intrusives on<br />
and in the vicinity of the commonage of the town that can possibly be exploited for groundwater<br />
abstraction purposes. The groundwater intervention proposed for Wepener entails the drilling of<br />
seven new boreholes to be sited geophysically. Two of the seven boreholes will form part of the<br />
support production boreholes during well field maintenance and water emergencies. Information<br />
indicates that the four existing production boreholes were never aquifer test pumped to determine the<br />
sustainable abstraction rates. It is therefore proposed that the existing production boreholes be<br />
aquifer test pumped with the newly drilled boreholes to determine the sustainable yield of the<br />
commonage well field. Refurbishing of current production borehole equipment as well as the<br />
<strong>Interventions</strong> <strong>Report</strong> June 2012
Water Reconciliation Strategy Study for the Large Bulk Water Supply Systems: Greater Bloemfontein Area 101<br />
equipping of the newly drilled boreholes according to the sustainable rate recommendations is also<br />
proposed. It is estimated conceptually that the proposed well field can yield approximately<br />
0.16 Mm 3 /a.<br />
3. OPTION YIELD<br />
The Wepener scheme yield:<br />
Proposed<br />
Scheme<br />
Name<br />
Wepener<br />
Number<br />
of<br />
New<br />
Scheme<br />
Boreholes<br />
7 (5<br />
production<br />
and 2<br />
standby)<br />
Number<br />
of<br />
Existing<br />
Scheme<br />
Boreholes<br />
Estimated<br />
Average<br />
Yield of 5<br />
New<br />
Boreholes<br />
(m 3 /a)<br />
Estimated<br />
Average<br />
Yield of<br />
Existing<br />
Boreholes<br />
(m 3 /a)<br />
Total<br />
Estimated<br />
Average<br />
Yield<br />
(m 3 /a)<br />
Average<br />
Rainfall<br />
(mm/a)<br />
Vegter<br />
Recharge<br />
Percentage<br />
(20 mm/a)<br />
(%)<br />
Vegter<br />
Recharge<br />
To Aquifer<br />
(m 3 /a)<br />
4 88,695 70,956 159,651 593 5 432,000<br />
The estimated scheme yields were calculated by using the average sustainable yields of the Karoo<br />
geology well fields of Petrusburg / Bolokanang, Edenville / Ngwathe, and Ikgomotseng for all the<br />
groundwater interventions except for the Bloemfontein / Bainsvlei intervention. The average<br />
sustainable yield derived for a borehole was 48.6 m 3 /d over a 10-hour pump cycle per day. The<br />
recharge volume to the local aquifers of the boreholes was determined by using a recharge<br />
percentage from the Vegter recharge maps as well as the mean annual rainfall of the area and an<br />
assumed size of the commonage of 4.5 km x 3 km.<br />
4. UNIT REFERENCE VALUE<br />
The URVs for this option are based on estimated costing and on assumed average yields per<br />
borehole.<br />
ITEM<br />
Discount Rate<br />
4 %<br />
Discount Rate<br />
6 %<br />
Discount Rate<br />
8 %<br />
Total capital cost (R million) 5.9 5.9 5.9<br />
Annual operating cost (R mill /annum) 0.2 0.2 0.2<br />
NPV Cost (R million) 9.6 8.3 7.4<br />
Unit Reference Value (R/m 3 ) 5.33 6.46 7.68<br />
Note that the URV excludes escalation and chemical treatment costs, but includes infrastructure and<br />
operating costs.<br />
<strong>Interventions</strong> <strong>Report</strong> June 2012
Water Reconciliation Strategy Study for the Large Bulk Water Supply Systems: Greater Bloemfontein Area 102<br />
5. OTHER ISSUES<br />
Potential environmental impacts of utilising well fields include dewatering or lowering of<br />
sustainable yield of the local aquifer due to mismanagement or over utilisation. If the utilisation<br />
of well fields is not monitored and managed in a sustainable manner it may impact adjacent<br />
landowners, which may utilise groundwater for agricultural purposes and vice versa where the<br />
private landowners have an impact on the groundwater resources of the well field.<br />
Contamination of the local aquifer by means of surface activities such as on-site sanitation,<br />
landfill sites, leaking or unlined or over flowing sewage treatment works (oxidation dams) also<br />
poses a threat to the access to clean groundwater resources for communities.<br />
<strong>Interventions</strong> <strong>Report</strong> June 2012
Water Reconciliation Strategy Study for the Large Bulk Water Supply Systems: Greater Bloemfontein Area 103<br />
E8. Groundwater <strong>Interventions</strong> Based on Wellfields Next<br />
to / in the Vicinity of Pipeline – De Hoek Reservoir<br />
1. OPTION LAYOUT<br />
Figure 10: The locality map of the De Hoek reservoir intervention. Lineaments (red<br />
polylines) were indentified, which indicate potential water bearing dykes to the<br />
south of the reservoir. The purple polylines indicate the edges of potential<br />
dolerite sills, and the pink polylines indicates the Caledon pipeline.<br />
2. OPTION DESCRIPTION<br />
Aerial photo interpretations indicate the presence of lineaments and potential dolerite intrusives on<br />
and in the vicinity of the De Hoek reservoir that can possibly be exploited for groundwater abstraction<br />
purposes. The groundwater intervention proposes the drilling of 28 new boreholes to be sited<br />
geophysically. Three of the 28 boreholes will form part of the support production boreholes during<br />
well field maintenance and water emergencies. The newly drilled boreholes will be aquifer test<br />
pumped to determine their sustainable yields. It is estimated conceptually that the proposed well field<br />
can yield approximately 0.44 Mm 3 /a.<br />
<strong>Interventions</strong> <strong>Report</strong> June 2012
Water Reconciliation Strategy Study for the Large Bulk Water Supply Systems: Greater Bloemfontein Area 104<br />
3. OPTION YIELD<br />
The De Hoek reservoir scheme yield:<br />
Proposed<br />
Scheme<br />
Name<br />
De Hoek<br />
Reservoir<br />
Number<br />
of<br />
New<br />
Scheme<br />
Boreholes<br />
28 (25<br />
production<br />
and 3<br />
standby)<br />
Number<br />
of<br />
Existing<br />
Scheme<br />
Boreholes<br />
Estimated<br />
Average<br />
Yield of 25<br />
New<br />
Boreholes<br />
(m 3 /a)<br />
Estimated<br />
Average<br />
Yield of<br />
Existing<br />
Boreholes<br />
(m 3 /a)<br />
Total<br />
Estimated<br />
Average<br />
Yield<br />
(m 3 /a)<br />
Average<br />
Rainfall<br />
(mm/a)<br />
Vegter<br />
Recharge<br />
Percentage<br />
(20 mm/a) (%)<br />
Vegter<br />
Recharge<br />
To Aquifer<br />
(m 3 /a)<br />
0 443,475 0 443,475 552 6 476,000<br />
The estimated scheme yields were calculated by using the average sustainable yields of the Karoo<br />
geology well fields of Petrusburg / Bolokanang, Edenville / Ngwathe, and Ikgomotseng for all the<br />
groundwater interventions except for the Bloemfontein / Bainsvlei intervention. The average<br />
sustainable yield derived for a borehole was 48.6 m 3 /d over a 10-hour pump cycle per day. The<br />
recharge volumes to the local aquifers of the well fields were determined by using a recharge<br />
percentage of the Vegter recharge maps as well as the mean annual rainfall of the area and a surface<br />
area of the proposed wellfield of 6.8 km x 3.5 km.<br />
4. UNIT REFERENCE VALUE<br />
The URVs for this option are based on the estimated costing and on the assumed average yield per<br />
borehole.<br />
ITEM<br />
Discount Rate<br />
4 %<br />
Discount Rate<br />
6 %<br />
Discount Rate<br />
8 %<br />
Total capital cost (R million) 43 43 43<br />
Annual operating cost (R mill /annum) 0.8 0.8 0.8<br />
NPV Cost (R million) 56.4 50.8 46.9<br />
Unit Reference Value (R/m 3 ) 6.31 7.94 9.71<br />
Note that the URV excludes escalation and chemical treatment costs, but includes infrastructure and<br />
operating costs.<br />
5. OTHER ISSUES<br />
Potential environmental impacts of utilising the well fields include dewatering or lowering of<br />
sustainable yield of the local aquifer due to mismanagement or over utilisation. If the utilisation<br />
of well fields is not monitored and managed in a sustainable manner it may impact adjacent<br />
landowners, which may utilise groundwater for agricultural purposes and vice versa where the<br />
private landowner have an impact on the groundwater resources of the well field.<br />
Contamination of the local aquifer by means of surface activities such as on-site sanitation,<br />
landfill sites, leaking, or unlined or over flowing sewage treatment works (oxidation dams) also<br />
poses a threat to the access to clean groundwater resources for communities.<br />
<strong>Interventions</strong> <strong>Report</strong> June 2012
Water Reconciliation Strategy Study for the Large Bulk Water Supply Systems: Greater Bloemfontein Area 105<br />
E9. Groundwater <strong>Interventions</strong> Based on Well Fields next to /<br />
in the Vicinity of Pipeline – Lieukop off-take chamber<br />
1. OPTION LAYOUT<br />
Figure 11: The locality map of the Lieukop Off-take chamber intervention. Lineaments (red<br />
polylines) were indentified, which indicate potential water bearing dykes to the south<br />
of the reservoir. The purple polylines indicate the edges of potential dolerite sills, and<br />
the pink polylines indicate the Caledon and Botshabelo pipelines.<br />
2. OPTION DESCRIPTION<br />
Aerial photo interpretations indicate the presence of lineaments and potential dolerite intrusives in the<br />
vicinity of the Lieukop off-take chamber that can possibly be exploited for groundwater abstraction<br />
purposes. The groundwater intervention proposes the drilling of 27 new boreholes to be sited<br />
geophysically. Three of the 27 boreholes will form part of the support production boreholes during well field<br />
maintenance and water emergencies. The newly drilled boreholes will be aquifer test pumped to determine<br />
their sustainable yields. It is estimated conceptually that the proposed well field can yield approximately<br />
0.43 Mm 3 /a.<br />
<strong>Interventions</strong> <strong>Report</strong> June 2012
Water Reconciliation Strategy Study for the Large Bulk Water Supply Systems: Greater Bloemfontein Area 106<br />
3. OPTION YIELD<br />
The Lieukop Off-take chamber scheme yield:<br />
Proposed<br />
Scheme Name<br />
Lieukop Off-take<br />
Chamber<br />
Number<br />
of<br />
New<br />
Scheme<br />
Boreholes<br />
27 (24<br />
production<br />
and 3<br />
standby)<br />
Number<br />
of<br />
Existing<br />
Scheme<br />
Boreholes<br />
Estimated<br />
Average<br />
Yield of 24<br />
New<br />
Boreholes<br />
(m 3 /a)<br />
Estimated<br />
Average<br />
Yield of<br />
Existing<br />
Boreholes<br />
(m 3 /a)<br />
Total<br />
Estimated<br />
Average<br />
Yield<br />
(m 3 /a)<br />
Average<br />
Rainfall<br />
(mm/a)<br />
Vegter<br />
Recharge<br />
Percentage<br />
(20 mm/a) (%)<br />
Vegter<br />
Recharge<br />
To Aquifer<br />
(m 3 /a)<br />
0 425,736 0 425,736 593 5 438,080<br />
The estimated scheme yields were calculated by using the average sustainable yields of the Karoo geology<br />
well fields of Petrusburg / Bolokanang, Edenville / Ngwathe, and Ikgomotseng for all the groundwater<br />
interventions except for the Bloemfontein / Bainsvlei intervention. The average sustainable yield derived for<br />
a borehole was 48.6 m 3 /d over a 10-hour pump cycle per day. The recharge volumes to the local aquifers<br />
of the well field were determined by using a recharge percentage from the Vegter recharge maps as well as<br />
the mean annual rainfall of the area the surface area of the proposed wellfield of 3.7 km x 3.7 km.<br />
4. UNIT REFERENCE VALUE<br />
The URVs for this option are based on estimated costing and on assumed average yields per borehole.<br />
ITEM<br />
Discount Rate<br />
6 %<br />
Discount Rate<br />
8 %<br />
Discount Rate<br />
10 %<br />
Total capital cost (R million) 43.3 43.3 43.3<br />
Annual operating cost (R mill /annum) 0.97 0.97 0.97<br />
NPV Cost (R million) 60.4 53.7 49.2<br />
Unit Reference Value (R/m 3 ) 7.03 8.75 10.60<br />
Note that the URV excludes escalation and chemical treatment costs, but includes infrastructure and<br />
operating costs.<br />
5. OTHER ISSUES<br />
Potential environmental impacts of utilising well fields include dewatering or lowering of sustainable<br />
yield of the local aquifer due to mismanagement or over utilisation. If the utilisation of well fields is<br />
not monitored and managed in a sustainable manner it may impact adjacent landowners, which may<br />
utilise groundwater for agricultural purposes and vice versa where the private landowner have an<br />
impact on the groundwater resources of the well field.<br />
Contamination of the local aquifer by means of surface activities such as on-site sanitation, landfill<br />
sites, leaking, or unlined or over flowing sewage treatment works (oxidation dams) also poses a<br />
threat to the access to clean groundwater resources for communities.<br />
<strong>Interventions</strong> <strong>Report</strong> June 2012
Water Reconciliation Strategy Study for the Large Bulk Water Supply Systems: Greater Bloemfontein Area 107<br />
SECTION F<br />
WATER TRADING<br />
<strong>Interventions</strong> <strong>Report</strong> June 2012
Water Reconciliation Strategy Study for the Large Bulk Water Supply Systems: Greater Bloemfontein Area 108<br />
1. INTRODUCTION<br />
F1. Water Trading<br />
Not all water allocated to agricultural users is currently being utilised. Therefore, there is potential for<br />
purchasing water rights from those agricultural users who are not fully utilising their allocations. In the<br />
Upper Orange River Catchment Area the most of the unutilised water is earmarked for previous<br />
disadvantage individuals.<br />
It is however important to note that water trading requires authorisation from the <strong>DWA</strong>. With the<br />
moratorium on water trading between commercial farmers the real value of the water use allocation could<br />
not be determined.<br />
2. OPPORTUNITIES FOR WATER TRADING<br />
2.1 The Caledon River upstream of the Welbedacht Dam<br />
Upstream of the Welbedacht Dam, farmers make use of a General Authorisation (GAs) to use water in the<br />
catchment area. Some of the GAs have not yet been taken up and can therefore be utilized in water<br />
trading. The assurance of supply currently is only 80%.<br />
2.2 The Caledon River downstream of the Welbedacht Dam<br />
Downstream of the Welbedacht Dam, farmers only receive water if the river flows into the Welbedacht Dam.<br />
The assurance of supply is also estimated to be 80 %.<br />
2.3 Modderrivier and Kalkveld WUA<br />
The Kalkveld area is mostly dependent on the groundwater for irrigation. Currently groundwater abstraction<br />
(45 million m 3 ) is more than the annual recharge (28 million m 3 ) in the Bainsvlei area. A full verification and<br />
validation of water use needs to be undertaken in this area in order to determine lawful and/or unlawful<br />
water use.<br />
The Modder River area has both surface water users and water supplied from the Krugersdrift Dam. The<br />
inflow of the Krugersdrift Dam is mostly water from the Bloemfontein area. The irrigation allocation is fully<br />
used. The assurance of supply for the irrigation has been 87 % over the last 30 years and over the last 10<br />
years only 80 %. The unlawful use of water upstream of the Krugersdrift Dam reduces the inflow to the<br />
dam.<br />
2.4 Orange-Riet and Vanderkloof WUA’s<br />
Both these WUA’s utilise water from Vanderkloof Dam. Water is released down the river for irrigation<br />
downstream of the Vanderkloof Dam, where it is diverted to the Main canal to supply the Orange-Riet WUA<br />
and the Ramah canals.<br />
The assurance of supply is 98% for both WUA’s. Unlawful water use exists next to the Orange River and<br />
needs to be managed.<br />
<strong>Interventions</strong> <strong>Report</strong> June 2012
Water Reconciliation Strategy Study for the Large Bulk Water Supply Systems: Greater Bloemfontein Area 109<br />
3. FINANCIAL COSTS<br />
Acquiring water via trading would need to be assessed on an individual basis. The associated costs for<br />
acquiring water via trading will vary from one potential source to another. Factors influencing this include<br />
current irrigation development potential, crop types, and potential revenue.<br />
Table F.1: Estimated Cost of Water Trading<br />
DESCRIPTION<br />
ALLOCATION<br />
(m 3 /ha/year)<br />
Water Use Allocation Price<br />
(R/ha)<br />
Kalkfontein WUA 11 000 R 18 000<br />
Orange-Riet WUA (FS and NC) 11 000 R 30 000<br />
Proposed Modderrivier and Kalkveld WUA 8 130/8 640 R 24 000<br />
Proposed Vanderkloof WUA (FS and NC) 11 000 R 38 400<br />
Tierpoort Irrigation Board 9 000 -<br />
Wittespruit (Egmont Dam) Irrigation Board 6 100 -<br />
Caledon River upstream Welbedacht Dam ± 4 200 R 24 000<br />
Caledon River downstream Welbedacht Dam 7 620 R 28 000<br />
Leeuwrivier/Armenia Irrigation Board 6 100 -<br />
5. SOCIO-ECONOMIC<br />
The transfer of water from one water use sector to another can have a socio-economic impact on the area,<br />
specific issues include changes in land-use, job losses, etc. However, where unused allocations are traded<br />
this risk is not applicable. In addition, the importance of food security also needs to be looked at.<br />
In terms of the authorisation administrative process, the seller is required to provide an indemnity that no<br />
land claim has been lodged against his property in terms of the Restitution of Land Rights Act. The<br />
purchaser is required to apply for a water use licence.<br />
6. OTHER ISSUES<br />
Specific strengths and weaknesses include:<br />
Strengths:<br />
Unused allocations from the system are by default integrated into the system;<br />
Environmental and social impacts can be managed; and<br />
The selling price can be negotiated.<br />
Weaknesses:<br />
Relies on a voluntary offer to sell;<br />
Needs expensive infrastructure; and<br />
Cannot be forced without Compulsory Licensing.<br />
<strong>Interventions</strong> <strong>Report</strong> June 2012
Water Reconciliation Strategy Study for the Large Bulk Water Supply Systems: Greater Bloemfontein Area 110<br />
SECTION G<br />
OTHER OPTIONS<br />
<strong>Interventions</strong> <strong>Report</strong> June 2012
Water Reconciliation Strategy Study for the Large Bulk Water Supply Systems: Greater Bloemfontein Area 111<br />
1. SCHEME DESCRIPTION<br />
G1. Tunnel from Caledon<br />
This scheme, which was first proposed in 1947, entails a flood diversion structure in the vicinity of<br />
Jammersdrift Weir and a tunnel approximately 42 km long diverting flood water into the Modder Catchment.<br />
A dam in the Modder River Catchment with a capacity of at least the MAR of the Caledon River was<br />
proposed.<br />
This scheme was not undertaken at the time due to the large diameter tunnel required (to divert flood flows)<br />
and anticipated problems arising from siltation. It also proposed that any ultimate development on the<br />
Caledon River should entail a dam in the Caledon River with the diversion of controlled flows into the<br />
Modder catchment, without the necessity of providing any additional storage in the Modder River<br />
Catchement beyond what was already in existence.<br />
As this scheme was not implemented, the Welbedacht Dam on the Caledon River, the off channel storage<br />
dam at Knellpoort, and the Novo Transfer Scheme, were established.<br />
It is unlikely that a scheme of this nature could be implemented now due to the existing infrastructure<br />
development downstream of Jammersdrift Weir, the environmental water requirements, potential upstream<br />
development, and international obligations with Lesotho. The development of this scheme would reduce the<br />
yield of existing schemes downstream of Jammersdrift Weir.<br />
<strong>Interventions</strong> <strong>Report</strong> June 2012
Water Reconciliation Strategy Study for the Large Bulk Water Supply Systems: Greater Bloemfontein Area 112<br />
1. SCHEME DESCRIPTION<br />
G2. New Dam on the Caledon River<br />
An additional dam on the Caledon River could provide additional yield to the Greater Bloemfontein Area.<br />
This intervention has not been further investigated as part of this preliminary screening workshop for the<br />
following reasons:<br />
Given the sedimentation loadings in the Caledon River, it would not be advisable to construct a new<br />
dam in the Caledon River upstream of Welbedacht Dam.<br />
A new dam would fall on the border of South Africa and Lesotho.<br />
<strong>Interventions</strong> <strong>Report</strong> June 2012
Water Reconciliation Strategy Study for the Large Bulk Water Supply Systems: Greater Bloemfontein Area 113<br />
1. SCHEME DESCRIPTION<br />
G3. Transfer of Mine Water<br />
This scheme entails abstracting water from closed gold mines, treating the water to an acceptable standard<br />
and then pumping the water to the Greater Bloemfontein Area. Potential abstraction areas in close<br />
proximity to the Greater Bloemfontein Area are the goldfields of Welkom and/or Virginia.<br />
The scheme would entail an abstraction pump station, delivery pump station and a water treatment plant to<br />
remove any potential heavy metals and impurities in the water.<br />
2. OPTION YIELD<br />
In order to obtain a first order estimate of the potential costs associated with this scheme, an estimated<br />
yield of 20 million m 3 /a was used for the calculations.<br />
3. UNIT REFERENCE VALUE<br />
The URVs for this option are based on estimate costing performed and on a flow of 55Ml/d.<br />
ITEM<br />
Discount Rate<br />
4 %<br />
Discount Rate<br />
6 %<br />
Discount Rate<br />
8 %<br />
Total capital cost (R million) 633 633 633<br />
Annual operating cost (R mill /annum) 59 59 59<br />
NPV Cost (R million) 1,596 1,222 992<br />
Unit Reference Value (R/m 3 ) 4.1 4.5 5.0<br />
Note that the URV excludes escalation and chemical treatment costs, but includes infrastructure and<br />
operating costs.<br />
<strong>Interventions</strong> <strong>Report</strong> June 2012
Water Reconciliation Strategy Study for the Large Bulk Water Supply Systems: Greater Bloemfontein Area 114<br />
9. REFERENCES<br />
<strong>DWA</strong>F, 2004a. Internal Strategic Perspective: Orange River System Overarching. Prepared by PDNA,<br />
WRP Consulting Engineers (Pty) Ltd, WMB, and Kwezi-V3 on behalf of the Directorate: National Water<br />
Resource Planning. <strong>DWA</strong>F <strong>Report</strong> No.: P RSA D000/00/0104.<br />
<strong>DWA</strong>F, 2004b. Internal Strategic Perspective: Upper Orange Water Management Area. Prepared by PDNA,<br />
WRP Consulting Engineers (Pty) Ltd, WMB, and Kwezi-V3 on behalf of the Directorate: National Water<br />
Resource Planning. <strong>DWA</strong>F <strong>Report</strong> No.: P RSA D000/00/0104.<br />
<strong>DWA</strong>F, 2002. Upper Orange Water Management Area: Water Resource Situation Assessment – Main<br />
<strong>Report</strong> – Volume 1 of 3. Prepared by Stewart Scott on behalf of the Directorate: Water Resource Planning.<br />
<strong>DWA</strong>F <strong>Report</strong> No.: P13000/00/010.<br />
Slabbert, N. 2007. The Potential Impact of an Inter-basin Water Transfer on the Modder and Caledon River<br />
Systems. PhD Thesis. University of Free State, Bloemfontein.<br />
World Commission on Dams, 2000. Orange River Development Project, South Africa, Case Study prepared<br />
as an input to the World Commission on Dams, Cape Town. www.dams.org.<br />
<strong>Interventions</strong> <strong>Report</strong> June 2012
Water Reconciliation Strategy Study for the Large Bulk Water Supply Systems: Greater Bloemfontein Area<br />
Water Reconciliation Strategy Study for the<br />
Large Bulk Water Supply Systems:<br />
Greater Bloemfontein Area<br />
APPENDIX 1<br />
Preliminary Screening Workshop<br />
Proceedings 29 October 2009<br />
Appendix 1 – Preliminary Screening Workshop Proceedings 29 October 2009 June 2012
Water Reconciliation Strategy Study for the Large Bulk Water Supply Systems: Greater Bloemfontein Area 1<br />
OPTIONS WORKSHOP ATTENDEES<br />
Mr Seef Rademeyer (<strong>DWA</strong>: NWRP) (SR)<br />
Ms Dragana Ristic (<strong>DWA</strong>: NWRP) (DR)<br />
Mr Peter Pyke (<strong>DWA</strong>: Central) (PP)<br />
Ms Lerato Bapela (<strong>DWA</strong>) (LB)<br />
Mr Louis van Oudtshoorn (Bloem Water) (LvO)<br />
Mr Steve Naude (Mangaung Municipality) (SN)<br />
Mr Dries Visser (<strong>DWA</strong>: Free State) (DV)<br />
Mr Roelf Jacobs (Free State Agriculture) (RJ)<br />
Mr Nic Knoetze (Orange-Riet Water User Association) (NK)<br />
Mr John Kegakilwe (Motheo DM – Department of Agriculture) (JK)<br />
Ms Patience Hadebe (Motheo DM – Department of Agriculture) (PH)<br />
Ms Andrea van Gensen (Eskom Distribution) (AvG)<br />
Ms Puleng Mofokeng (Department of Agriculture, Forestry and Fishery) (PM)<br />
Mr Mxolisi Mabindisa (Eskom Distribution) (MM)<br />
Mr Charles Wessels (Kalkveld Water User Association) (CW)<br />
Mr Hennie Grobler (Free State Department of Agriculture) (HG)<br />
Mr Tendayi Makombe (<strong>DWA</strong>: NWRP) (TMak)<br />
Mr Jurgo van Wyk (<strong>DWA</strong>: Water Resources Planning System) (JvW)<br />
Mr Richard Tloubatla (<strong>DWA</strong>: Free State) (RT)<br />
Mr Thabo Masike (<strong>DWA</strong>: WUE) (TMas)<br />
Mr Mabuti Moloi (Motheo District Municipality) (MM)<br />
Mr Edwin Mofokeng (Naledi Municipality) (EM)<br />
Mr Thulo Mohapi (<strong>DWA</strong>: Free State) (TMoh)<br />
Mrs Molly Ntwaeaborwa (<strong>DWA</strong>: FS) (MN)<br />
Mr Tebogo Mothwa (Free State: Department of Agriculture) (TMot)<br />
Dr Johan van der Merwe (Bloem Water) (JvdM)<br />
Mr Mike Killick (Aurecon) (MK)<br />
Ms Karen Versfeld (Aurecon) (KV)<br />
Mr Graeme Evers (Aurecon) (GE)<br />
Ms Terry Baker (ILISO Consulting) (TB)<br />
Mr Jaco Hough (GHT Consulting Scientists) (JH)<br />
Mr Sarel de Wet (Sarel de Wet Consulting Services) (SdW)<br />
Ms Bhavani Daya (ILISO Consulting) (BD)<br />
WELCOME AND OPENING<br />
TB welcomed everyone to the workshop and allowed each attendee to introduce themselves.<br />
SR relayed Mr Johan van Rooyen’s apologies for not being able to attend the workshop. On behalf of Mr<br />
van Rooyen, SR provided a brief background to this study.<br />
SR explained that the National Water Act, which was promulgated in 1998; requires the establishment of a<br />
National Water Resource Strategy (NWRS). The purpose of the NWRS is to provide a framework within<br />
which the water resources of the country will be managed. South Africa is a water scarce country and<br />
water resources are under stress. In order to make provision for current and future water requirements, the<br />
Department of Water Affairs (<strong>DWA</strong>) are currently developing strategies, such as the Reconciliation Strategy<br />
Study, to enhance the water supply.<br />
PRESENTATIONS<br />
The Preliminary Screening Workshop Starter Document was sent to all attendees from the week of the 2<br />
October 2009. The purpose of the Preliminary Screening Workshop Starter Document was to provide<br />
attendees with an over-view of the study area, including bulk infrastructure, current and future water<br />
requirements, and a water balance. In addition, information on all interventions which have been identified<br />
was described in the Preliminary Screening Workshop Starter Document.<br />
Appendix 1 – Preliminary Screening Workshop Proceedings 29 October 2009 June 2012
Water Reconciliation Strategy Study for the Large Bulk Water Supply Systems: Greater Bloemfontein Area 2<br />
The purpose of the Preliminary Screening Workshop was thus to provide attendees with the opportunity to<br />
discuss the interventions that have been identified, screen out unfeasible interventions, and identify new<br />
interventions which were not included in the Preliminary Screening Workshop Starter Document.<br />
MK presented on the following topics discussed in more detail in the Preliminary Screening Workshop<br />
Starter Document:<br />
Scope of the study;<br />
Description of the Current Infrastructure;<br />
Available Supply<br />
Water Requirements;<br />
Water Balance<br />
Reconciliation <strong>Interventions</strong>;<br />
Other issues which could have an impact on Reconciliation; and<br />
Issues impacting on Reconciliation Options.<br />
WATER REQUIREMENTS SCENARIOS<br />
In order to prevent the anticipated shortages in water supply to the Greater Bloemfontein Area, the <strong>DWA</strong><br />
has initiated a Reconciliation Strategy Study to explore supply and demand side interventions that can be<br />
implemented to meet anticipated future water requirements.<br />
In terms of urban requirements, there is limited information currently available on the losses for bulk water<br />
transmission losses and water treatment losses. Agricultural water requirements for this study were<br />
considered in two areas, namely the Modder-Riet Catchment and along the Caledon River.<br />
Other important comments from delegates:<br />
The following comments refer to Table 4.1 of the Preliminary Screening Workshop Starter Document:<br />
GE: Not all the water provided to the towns listed in Table 4.1 is provided by Bloem Water (BW)<br />
and Mangaung Local Municipality (MLM). Some of the water provided to these towns is supplied<br />
from boreholes within the area.<br />
MK: Groundwater is used to augment supply to some towns within the study area, but that the<br />
yields from these are very small.<br />
PP: Utilising other water resources, such as groundwater, may be a cheaper source of water to<br />
some towns than obtaining water from Bloem Water.<br />
LvO: In 2009, the figures provided by BW and MLM may be skew, as ± 30% of the water was<br />
provided from alternative resources (such as boreholes) and the rest by BW. The figures in the<br />
table are not incorrect just that there was a mismanagement issue at that time in terms of recording<br />
water sources at the MLM.<br />
The following comment refers to Section 4.1.1 of the Preliminary Screening Workshop Starter Document:<br />
LvO: An allowance of 8.5% has been added to the historical bulk water requirements to calculate<br />
the bulk losses from the system. This should be increased to 12%.<br />
The following comment refers to Figure 4.1 of the Preliminary Screening Workshop Starter Document:<br />
In 2002 the water consumption drops and then increased in the following year. LvO explained that<br />
this was as a result of the high rainfall experienced during that year. As such, the historical data<br />
presented in Figure 4.1 is influenced by climate.<br />
The following comment refers to Figures 4.2 and 4.3:<br />
PP: Concerned about using the term ‘residential uncontrolled water use’, as it implies that it is<br />
unmetered or unregistered water. A definition of ‘residential uncontrolled water use’ will be provided<br />
in the document.<br />
Appendix 1 – Preliminary Screening Workshop Proceedings 29 October 2009 June 2012
Water Reconciliation Strategy Study for the Large Bulk Water Supply Systems: Greater Bloemfontein Area 3<br />
General comments:<br />
LvO stated that the situation facing Mohale Dam is a reality, in terms of the surplus yield.<br />
JH: Has global warming been taken into account and its influence on rainfall? MK responded that<br />
climate change would be taken into account in the scenario planning.<br />
LB asked how the options are compared. MK explained that a Unit Reference Value (URV) per m 3<br />
of water that can be used to compare options is calculated. This value took the cost of developing<br />
the resource and providing the bulk water as well as the quantity of water that can be supplied and<br />
time-period over which it will be available into account.<br />
MM queried the use of scenario planning to predict the future water requirements, as the use of a<br />
trend-line based on historical data can provide an indication of future requirements. PP responded<br />
that historical trends provide information on only one possible future requirement. The benefit of<br />
using scenario planning is that it takes into account multiple factors which can influence the future<br />
water requirements.<br />
LB queried whether the various scenarios considered the recession as a factor in the scenario<br />
analysis in terms of a demand for water. MK responded that the impact of the recession will be<br />
factored into the scenario planning in terms of population growth. DR added that migration rates<br />
can also be used as an indicator of the recession.<br />
PRELIMINARY OPTIONS WORKSHOP RECOMMENDATIONS<br />
a. URBAN WATER CONSERVATION AND DEMAND MANAGEMENT<br />
I. EFFICIENT USE OF WATER AND LOSS MANAGEMENT<br />
Recommendation:<br />
The MLM has developed a Water Conservation and Water Demand Management (WC/WDM) Strategy<br />
which should be referred to in the Preliminary Screening Workshop Starter Document. Institutional<br />
arrangements, however, have not been defined in the WC/WDM Strategy. The implementation of WC/WDM<br />
must be the major “intervention” recommended by this Study. If the MLM cannot manage their current<br />
supply of water then future schemes will not be supported by the <strong>DWA</strong>.<br />
Other important comments from delegates:<br />
TMas: The MLM has essential information and that needs to be shared with Government Departments,<br />
such as <strong>DWA</strong> Regional Office, to ensure implementation of this intervention.<br />
TMas: Metered information needs to be included in this Study. The person responsible for MLM’s Water<br />
Conservation Management should be contacted and be involved in this process.<br />
LvO stated that if the Local Municipality is involved perhaps an extension of infrastructure may not be<br />
needed as investigated in this assessment; perhaps another form of using current infrastructure can be<br />
investigated.<br />
ACTION ITEM: SR suggested that TMas should assist the project team to ensure that these responsible<br />
persons are identified and included in the study.<br />
b. AGRICULTURAL WATER CONSERVATION AND DEMAND MANAGEMENT<br />
Recommendation:<br />
It is important to initiate metering (both surface and groundwater abstractions) in the study area to identify<br />
illegal water use. In addition, metering also provides essential information to understand the yield of the<br />
system.<br />
Other important comments from delegates:<br />
NK: The <strong>DWA</strong> needs to ensure that the NWA is implemented, in terms of controlling and monitoring<br />
abstractions within the catchment management areas.<br />
Appendix 1 – Preliminary Screening Workshop Proceedings 29 October 2009 June 2012
Water Reconciliation Strategy Study for the Large Bulk Water Supply Systems: Greater Bloemfontein Area 4<br />
CW stated that it is sad that the Water User Associations are not being used more efficiently as the<br />
National Water Act states as they could assist in the controlling of water use in their catchment; the lack of<br />
service delivery from <strong>DWA</strong>F has led to the theft and abuse of water. The illegal use of water needs to be<br />
monitored and metered by Municipalities.<br />
LvO queried whether there will be a direct pipeline to Bloemfontein.<br />
MK re-iterated that the point of the workshop is to screen out the options which will not be feasible.<br />
RJ stated that he had worked at the Tienfontein pump station and had noted the impact of the high<br />
sediment load on the pump station resulting in increased wear-and-tear on the equipment and high<br />
maintenance costs. As a result of the high sediment load, the Knellpoort Dam channel from Welbedacht<br />
Dam to Bloemfontein is deteriorating, and it is essential that it is rebuilt.<br />
TB queried if the assumption has been made that there is no unlawful use.<br />
SR stated that in terms of addressing unlawful water use, if the information is available regarding it then<br />
measures will be undertaken to eradicate it.<br />
MK clarified that all requirement figures used in the study exclude all unlawful use. The assumption is that<br />
the unlawful use of water will be dealt with and no longer take place in future.<br />
c. SURFACE WATER INTERVENTIONS<br />
II. UTILISING SURPLUS CAPACITY IN THE ORANGE RIVER BY PUMPING TO<br />
KNELLPOORT DAM FROM GARIEP DAM<br />
Recommendation:<br />
This intervention must be further investigated and the description of this intervention must be amended to<br />
reflect the actual scheme proposed.<br />
III. UTILISING SURPLUS CAPACITY IN THE ORANGE RIVER BY PUMPING TO<br />
KNELLPOORT DAM FROM VANDERKLOOF DAM<br />
Recommendation:<br />
The URV for this intervention is based on a 200 km pump system, which includes a pump station and rising<br />
main, from Vanderkloof Dam to Knellpoort Dam. This intervention will be further investigated. However the<br />
high pumping costs will probably exclude this intervention.<br />
IV. UTILISING SURPLUS CAPACITY IN THE ORANGE RIVER BY PUMPING TO<br />
KNELLPOORT DAM FROM BOSBERG / BOSKRAAI<br />
Recommendation:<br />
The URV for this intervention is based on a 100 km pump system, which includes a pump station and rising<br />
main. The cost of land acquisition and construction of the dam have been excluded. This intervention will<br />
be further investigated. However the high pumping costs will probably exclude this intervention.<br />
V. MODIFICATIONS TO WELBEDACHT DAM: EXTEND SCOUR OPERATIONS<br />
AND LOWER OUTLETS<br />
Recommendation:<br />
Alternative 1: Extended scour operations<br />
This will be required to maintain the existing yield of Welbedacht Dam<br />
Appendix 1 – Preliminary Screening Workshop Proceedings 29 October 2009 June 2012
Water Reconciliation Strategy Study for the Large Bulk Water Supply Systems: Greater Bloemfontein Area 5<br />
Alternative 2: Lower outlets<br />
This intervention is fatally flawed as it would require that the entire dam wall be rebuilt.<br />
VI. MODIFICATIONS TO THE CALEDON-MODDER SYSTEM<br />
Recommendation:<br />
Include an additional option, namely the construction of a canal to transfer water upstream of Tienfontein<br />
Pump Station (close to Jammersdrift Weir) to Knellpoort Dam.<br />
VII. POLIHALI DAM – LESOTHO HIGHLANDS PHASE 2<br />
Recommendation:<br />
The URV is based on the incorrect tariff. The URV should be based on the Vaal prices for water.<br />
d. RE-USE OF TREATED EFFLUENT<br />
VIII. PLANNED INDIRECT RE-USE – NEW NORTH EASTERN WWTW<br />
Recommendation:<br />
The URV includes treatment and operating costs, as such the URVs cannot be compared with our surface<br />
water interventions.<br />
This option needs to be further investigated.<br />
IX. PLANNED INDIRECT RE-USE – TRANSFER TO UPSTREAM OF MOCKES<br />
DAM<br />
Recommendation:<br />
This option needs to be further investigated.<br />
X. PLANNED INDIRECT RE-USE – KRUGERSDRIFT DAM<br />
Recommendation:<br />
This option needs to be further investigated.<br />
XI. PLANNED INDIRECT RE-USE – BLOEMSPRUIT<br />
Recommendation:<br />
This option needs to be further investigated.<br />
XII. RE-USE OF TREATED EFFLUENT – DIRECT USE: IRRIGATION<br />
Recommendation:<br />
This option needs to be further investigated.<br />
Appendix 1 – Preliminary Screening Workshop Proceedings 29 October 2009 June 2012
Water Reconciliation Strategy Study for the Large Bulk Water Supply Systems: Greater Bloemfontein Area 6<br />
e. GROUN<strong>DWA</strong>TER<br />
XIII. IKGOMOTSENG AQUIFER<br />
Recommendation:<br />
These groundwater schemes provide local solutions, which may be more cost effective for local use than<br />
bringing water from the BW supply scheme.<br />
XIV. BLOEMFONTEIN (BAINSVLEI AQUIFER)<br />
Recommendation:<br />
This option has been screened out due to the high socio-economic costs associated with land<br />
expropriation, the cessation of farming activities in this area, and loss of jobs.<br />
XV. THABA NCHU AQUIFER<br />
Recommendation:<br />
This option has been screened out as a result of poor groundwater quality.<br />
XVI. TOWN GROUN<strong>DWA</strong>TER INTERVENTIONS (REDDERSBURG, EDENBURG,<br />
DEWETSDORP, AND WEPPENER)<br />
Recommendation:<br />
This option needs to be further investigated.<br />
XVII. GROUN<strong>DWA</strong>TER INTERVENTIONS BASED ON WELL FIELDS NEXT TO / IN<br />
THE VICINITY OF PIPELINES – DE HOEK RESERVOIR<br />
Recommendation:<br />
This option has been screened out.<br />
XVIII. GROUN<strong>DWA</strong>TER INTERVENTIONS BASED ON WELL FIELDS NEXT TO / IN<br />
THE VICINITY OF PIPELINES – LIEUKOP OFF-TAKE CHAMBER<br />
Recommendation:<br />
This option has been screened out.<br />
f. WATER TRADING<br />
Recommendation:<br />
There is potential for this option to be developed in future, however there are a number of socio-economic<br />
issues that need to be taken into consideration, namely loss of jobs and food security.<br />
Appendix 1 – Preliminary Screening Workshop Proceedings 29 October 2009 June 2012
Water Reconciliation Strategy Study for the Large Bulk Water Supply Systems: Greater Bloemfontein Area 7<br />
g. OTHER OPTIONS<br />
XIX. TUNNEL FROM CALEDON<br />
Recommendation:<br />
This option has been screened out due to the impact that this option will have on the yield of existing<br />
infrastructure.<br />
XX. NEW DAM ON THE CALEDON RIVER<br />
Recommendation:<br />
This option has been screened out due to the high sediment loads of the Caledon River.<br />
XXI. TRANSFER OF MINE WATER<br />
Recommendation:<br />
This option should be further investigated. However, there is currently a demand for the mine water in the<br />
Welkom area and the water quality is a concern.<br />
NOTE: A summary of all the interventions and URVs is included in the following section.<br />
GENERAL DISCUSSION<br />
In order to determine the impact of the increasing electricity costs on the proposed interventions, a<br />
sensitivity analysis will be conducted.<br />
ACTION ITEM: MK to conduct a sensitivity analysis to determine the impact of electricity costs on the<br />
URVs.<br />
WAY FORWARD<br />
TB stated that the proceedings from this meeting would be sent to all present at the Workshop for<br />
comment, and that the comments raised from this Workshop would be used in the assessment of options.<br />
MK stated that a second Workshop would be held later in the project to present the findings of the detailed<br />
assessment of each Intervention.<br />
CLOSURE<br />
TB thanked everyone for attending the Workshop and for their contributions to the study. The meeting was<br />
closed at 14:00.<br />
Appendix 1 – Preliminary Screening Workshop Proceedings 29 October 2009 June 2012
Water Reconciliation Strategy Study for the Large Bulk Water Supply Systems: Greater Bloemfontein Area 8<br />
Table 1: Summary of all interventions considered at the Preliminary Screening Workshop<br />
Option<br />
A - URBAN WATER CONSERVATION AND DEMAND MANAGEMENT<br />
A1 - Efficient use of water<br />
Yield URV Socio -<br />
Economic Ecological<br />
(Mm 3 /a) (R/m 3 )<br />
0 0 1 1<br />
A2 - Loss management<br />
0 0 1 1<br />
B - AGRICULTURAL WATER CONSERVATION AND DEMAND MANAGEMENT<br />
Warrants further study?<br />
Yes / No / & Comment<br />
Yes. There will be no augmentation of bulk<br />
services without WC/WDM being addressed first<br />
Yes. There will be no augmentation of bulk<br />
services without WC/WDM being addressed first<br />
B1.1 - River release management 0 0 1 1 No<br />
B1.2 - Irrigation Practices 0 0 1 1 No<br />
B1.3 - Irrigation Canal Losses 0 0 1 1 No<br />
B1.4 - Farm Dam Losses 0 0 1 1 No<br />
B1.5 - Crop Selection 0 0 1 1 No<br />
B1.6 - Crop Deficit Irrigation 0 0 1 1 No<br />
B1.7 - Metering 0 0 1 1 No<br />
C - SURFACE WATER DEVELOPMENT OPTIONS<br />
C1 - Utilising surplus capacity in Orange River by<br />
pumping to Knellpoort Dam from Gariep Dam 10 5.3 2 2 Yes<br />
C2 - Utilise surplus capacity in Orange River<br />
system by pumping to Knellpoort Dam from<br />
Vanderkloof Dam 10 6.7 2 2 Yes<br />
C3 - Utilise surplus capacity in Orange River<br />
system by pumping to Knellpoort Dam from<br />
Bosberg/Boskraai Dam 10 4.2 2 2 Yes<br />
C4a - Modifications to Welbedacht Dam : Extend<br />
scour operations 0 0 1 1 Yes<br />
C4b - Modifications to Welbedacht Dam : Lower<br />
gates 0 0 1 1 No<br />
C5a - Modifications to Knellpoort System :<br />
Increased abstraction capacity of Novo<br />
Pumpstation 4.5 0 1 1 Yes<br />
Appendix 1 – Preliminary Screening Workshop Proceedings 29 October 2009 June 2012
Water Reconciliation Strategy Study for the Large Bulk Water Supply Systems: Greater Bloemfontein Area 9<br />
Option<br />
Yield URV Socio -<br />
Economic Ecological<br />
(Mm<br />
Warrants further study?<br />
Yes / No / & Comment<br />
3 /a) (R/m 3 C5b - Modifications to Knellpoort System : Raising<br />
)<br />
of Knellpoort Dam<br />
C5c - Modifications to Knellpoort System : Increase<br />
5.8 0 1 1 Yes<br />
capacity of Tienfontein pumpstation<br />
C5d - Modifications to Knellpoort System : New<br />
27 0 1 1 Yes<br />
pump station at Welbedacht Dam<br />
C5e - Modifications to Knellpoort System :<br />
39 0 1 1 Yes<br />
Combination of options 67 0 1 1 Yes<br />
C6 - Polihali Dam Lesotho Highlands Phase 2<br />
D - REUSE OF TREATED EFFLUENT<br />
D1 - Planned direct reuse - new North Eastern<br />
10 3.38 1 1<br />
Yes. The URVs are incorrect as they are based on<br />
the incorrect tariff structure<br />
WWTW<br />
D2 - Planned indirect reuse - Transfer to upstream<br />
10.8 4.1 2 2<br />
of Mockes Dam 10.8 4.8 1 2 Yes<br />
D3 - Treated indirect re-use - Krugersdrift Dam 10.8 5 1 2 Yes<br />
D4 - Planned direct re-use - Bloemspruit<br />
D5 - Re-use of treated effluent - Direct use:<br />
10.8 3.7 1 2 Yes<br />
Irrigation<br />
E - GROUN<strong>DWA</strong>TER DEVELOPMENT OPTIONS<br />
0 0 1 1 Yes<br />
E1 - Ikgomotseng aquifer 0.21 5.08 2 2 Yes<br />
E2 - Bloemfontein aquifer (Bainsvlei aquifer) 28 15.58 3 2 No<br />
E3 - Thaba Nchu aquifer 0.89 5.35 1 2 Yes<br />
E4 - Reddersburg Aquifer 0.24 9.22 1 2 Yes<br />
E5 - Edenburg Aquifer 0.3 10.08 1 2 Yes<br />
E6 - Dewetsdorp Aquifer 0.17 7.35 1 2 Yes<br />
E7 - Weppener Aquifer<br />
E8 - Well-field developments along the route of the<br />
0.16 7.52 1 1 Yes<br />
existing pipelines : De Hoek Reservoir<br />
E9 - Well-field developments along the route of the<br />
0.43 9.42 1 1 No<br />
existing pipelines : Lieukop Off-take Chamber 0.43 10.3 1 1 No<br />
F - WATER TRADING<br />
B1 - Water Trading 3 0 No<br />
Appendix 1 – Preliminary Screening Workshop Proceedings 29 October 2009 June 2012
Water Reconciliation Strategy Study for the Large Bulk Water Supply Systems: Greater Bloemfontein Area 10<br />
G - OTHER OPTIONS<br />
Option<br />
Yield URV Socio -<br />
Economic Ecological<br />
(Mm 3 /a) (R/m 3 )<br />
Warrants further study?<br />
Yes / No / & Comment<br />
G1 - Tunnel from Caledon to the Modder 0 0 0 0 No<br />
G2 - New dam on the Caledon River 0 0 0 0 No<br />
G3 - Transfer of mine water 4.6 4.6 1 1 Yes<br />
G4 - Canal option (to be developed still)<br />
Appendix 1 – Preliminary Screening Workshop Proceedings 29 October 2009 June 2012
Water Reconciliation Strategy Study for the Large Bulk Water Supply Systems: Greater Bloemfontein Area<br />
Water Reconciliation Strategy Study for the<br />
Large Bulk Water Supply Systems:<br />
Greater Bloemfontein Area<br />
APPENDIX 2<br />
Cost Estimates for Potential <strong>Interventions</strong><br />
Appendix 2 – Cost Estimates for Potential <strong>Interventions</strong> June 2012
Water Reconciliation Strategy Study for the Large Bulk Water Supply Systems: Greater Bloemfontein Area<br />
NOTE:<br />
No cost estimates were made for the following interventions:<br />
A1<br />
A2<br />
B1<br />
C4<br />
C6<br />
D5<br />
F1<br />
Appendix 2 – Cost Estimates for Potential <strong>Interventions</strong> June 2012
Water Reconciliation Strategy Study for the Large Bulk Water Supply Systems: Greater Bloemfontein Area 1<br />
C1. Utilising surplus capacity in the Orange River by pumping to Knellpoort Dam from Gariep Dam<br />
Summary of<br />
costs<br />
Pumpstation R88,215,780<br />
Pipeline R503,266,750<br />
Subtotal R591,482,530<br />
Preliminary and<br />
General<br />
20% R118,296,506<br />
Subtotal R709,779,036<br />
Contingencies 10% R70,977,904<br />
Subtotal R780,756,940<br />
Professional<br />
Fees<br />
10% R78,075,694<br />
Total R858,832,634<br />
Pipeline<br />
Length 120 km<br />
Design velocity 1.5 m/s<br />
D 0.900 m<br />
A 0.636 m 2<br />
v 1.196 m/s<br />
Base<br />
Year<br />
SV (km) H Hf HGL P t Pipe Rate Cost<br />
km m m m m mm DN/t R/m R<br />
0 1259 10.671 1705 446 13 900/13 6407.24 R48,054,274<br />
7.5 1356 10.671 1695 339 10 900/10 5066.56 R37,999,194<br />
15 1269 10.671 1684 415 12 900/12 5961.36 R44,710,224<br />
22.5 1321 10.671 1673 352 10 900/10 5066.56 R37,999,194<br />
30 1418 10.671 1663 245 7 900/7 3716.71 R27,875,322<br />
37.5 1534 10.671 1652 118 7 900/7 3716.71 R27,875,322<br />
45 1538 10.671 1641 103 7 900/7 3716.71 R27,875,322<br />
52.5 1521 10.671 1631 110 7 900/7 3716.71 R27,875,322<br />
60 1581 10.671 1620 39 7 900/7 3716.71 R27,875,322<br />
67.5 1525 10.671 1609 84 7 900/7 3716.71 R27,875,322<br />
75 1528 10.671 1599 71 7 900/7 3716.71 R27,875,322<br />
82.5 1588 10.671 1588 0 7 900/7 3716.71 R27,875,322<br />
90 1525 10.671 1557 32 7 900/7 3716.71 R27,875,322<br />
97.5 1524 10.671 1546 22 7 900/7 3716.71 R27,875,322<br />
105 1518 10.671 1536 18 7 900/7 3716.71 R27,875,322<br />
112.5 1525 10.671 1525 0 7 900/7 3716.71 R27,875,322<br />
120 1449 1449 0 7 900/7 3716.71<br />
Pipeline Cost R503,266,750<br />
Pumpstation<br />
Flow to deliver 20 Mm 3 /a<br />
Pumping hours<br />
per day<br />
20<br />
Flow 0.761 m 3 /s<br />
H1 1259 m<br />
H2 1588 m<br />
Appendix 2 – Cost Estimates for Potential <strong>Interventions</strong> June 2012<br />
2012
Water Reconciliation Strategy Study for the Large Bulk Water Supply Systems: Greater Bloemfontein Area 2<br />
HS 329 m<br />
C 125<br />
L 82.5 km<br />
Hf CW 117 m<br />
Kinematic<br />
viscosity (nu)<br />
1.13E-06 m²/s<br />
k 0.0005 m<br />
Re 952,783<br />
λ 0.0159<br />
0.949<br />
Hf CW/DW 106 m<br />
Hf 117 m<br />
HTOTAL 446 m<br />
Pump efficiency 85%<br />
Power 3921 kW<br />
Installed Power 5881 kW<br />
Rate 15,000 R/kW<br />
Pumpstation<br />
Cost<br />
Operation and<br />
Maintenance Costs<br />
Pumpstation Cost Split Annual O&M as % of CRC<br />
Mechanical Cost 50% Pipes 0.50%<br />
Electrical Cost 20% E&M 4.00%<br />
Civil Cost 30% Civil 0.25%<br />
Item Capital Cost<br />
Estimate<br />
A B C D E<br />
Preliminary<br />
and General<br />
(% of A)<br />
Contingencies<br />
(% of A+B)<br />
Total Capital<br />
Replace-<br />
ment Cost<br />
R88,215,780<br />
Annual O&M<br />
Cost<br />
20% 10%<br />
Pumpstation 88,215,780 17,643,156 10,585,894 116,444,830 3,347,789<br />
Pipeline 503,266,750 100,653,350 60,392,010 664,312,110 3,321,561<br />
Total 6,669,349<br />
Electricity Costs<br />
Megaflex (300 to 600 km Transmission Zone)<br />
Rate: c/kWh Rate: c/kWh (incl. rural<br />
subsidy and environmental<br />
levy charge)<br />
Rate Jun-Aug Sep-May Jun-Aug Sep-May<br />
3 9 3 9<br />
Peak 197.46 55.08 203.57 61.19<br />
Standard 51.27 33.69 57.38 39.80<br />
Off peak 27.37 23.56 33.48 29.67<br />
Rural subsidy (c/kWh) 4.1 4.1<br />
Environmental levy charge<br />
(c/kWh)<br />
2.0 2.0<br />
Energy charge daily rate allocation - Megaflex 20<br />
Weekdays Saturday Sunday Total per<br />
week<br />
Appendix 2 – Cost Estimates for Potential <strong>Interventions</strong> June 2012
Water Reconciliation Strategy Study for the Large Bulk Water Supply Systems: Greater Bloemfontein Area 3<br />
Peak 5 0 0 20.83333333<br />
Standard 11 7 0 51.66666667<br />
Off peak 8 17 24 67.5<br />
Hourly<br />
Charge<br />
Daily charge Monthly cost<br />
Service & Admin charge<br />
per account<br />
R161.25<br />
Network Access Charge<br />
(R/kVA/month)<br />
R9.73<br />
Network Demand Charge<br />
(R/kVA/month)<br />
R18.46<br />
Reactive Energy Charge<br />
(R/kVaRh)<br />
R0.08<br />
Transmission Network<br />
Charge (R/kVA/month)<br />
R4.92<br />
Pumpstation capacity 3,921 kW<br />
4,084 kVA<br />
Pumping hours per day 20 h<br />
Daily power usage 78,414 kWh/day<br />
Weighted average tariff 41 c/kWh<br />
Active Energy Cost R11,659,708 per annum<br />
Service & Admin Charge R58,856 per annum<br />
Network Access Charge R476,855 per annum<br />
Network Demand Charge R468,506 per annum<br />
Reactive Energy Charge R303,381 per annum<br />
Transmission network<br />
charge<br />
R241,123 per annum<br />
Total annual cost R13,208,429<br />
Orange River Costs<br />
Orange River Tariff 2.00 R/kl<br />
Flow 20000000 kl/annum<br />
Annual Orange River Cost R40,000,000 R59,877,779<br />
Appendix 2 – Cost Estimates for Potential <strong>Interventions</strong> June 2012
Water Reconciliation Strategy Study for the Large Bulk Water Supply Systems: Greater Bloemfontein Area 4<br />
C2. Utilising surplus capacity in the Orange River by pumping to Knellpoort Dam from Vanderkloof Dam<br />
Summary of<br />
costs<br />
Pumpstation R94,635,608<br />
Pipeline R598,911,829<br />
Subtotal R693,547,437<br />
Preliminary and<br />
General<br />
20% R138,709,487<br />
Subtotal R832,256,925<br />
Contingencies 10% R83,225,692<br />
Subtotal R915,482,617<br />
Professional<br />
Fees<br />
10% R91,548,262<br />
Total R1,007,030,879<br />
Pipeline<br />
Length 200 km<br />
Design velocity 1.5 m/s<br />
D 0.600 m<br />
A 0.283 m 2<br />
v 1.346 m/s<br />
Base<br />
Year<br />
SV (km) H Hf HGL P t Pipe Rate Cost<br />
km m m m m mm DN/t R/m R<br />
0 1191 70.995 2127 936 17 600/17 5422.12 R135,552,921<br />
25 1460 62.476 2056 596 11 600/11 3673.27 R80,812,036<br />
47 1627 12.211 1993 366 7 600/7 2487.00 R10,694,085<br />
51.3 1454 67.303 1981 527 10 600/10 3378.23 R80,064,137<br />
75 1399 33.794 1914 515 10 600/10 3378.23 R40,200,980<br />
86.9 1359 37.201 1880 521 10 600/10 3378.23 R44,254,861<br />
100 1444 34.078 1843 399 8 600/8 2785.09 R33,421,137<br />
112 1566 36.917 1808 242 5 600/5 1887.74 R24,540,658<br />
125 1438 19.879 1772 334 7 600/7 2487.00 R17,408,976<br />
132 1408 17.039 1752 344 7 600/7 2487.00 R14,921,980<br />
138 1550 25.558 1735 185 5 600/5 1887.74 R16,989,686<br />
147 1474 8.519 1709 235 5 600/5 1887.74 R5,663,229<br />
150 1524 25.558 1701 177 5 600/5 1887.74 R16,989,686<br />
159 1675 45.437 1675 0 5 600/5 1887.74 R30,203,886<br />
175 1604 70.995 1604 0 5 600/5 1887.74 R47,193,572<br />
200 1445 1445<br />
Pumpstation<br />
Flow to deliver 10 Mm 3 /a<br />
Pumping hours<br />
per day<br />
20<br />
Flow 0.381 m 3 /s<br />
H1 1191 m<br />
H2 1675 m<br />
HS 484 m<br />
Appendix 2 – Cost Estimates for Potential <strong>Interventions</strong> June 2012<br />
2012<br />
R598,911,829
Water Reconciliation Strategy Study for the Large Bulk Water Supply Systems: Greater Bloemfontein Area 5<br />
C 125<br />
L 159 km<br />
Hf CW 452 m<br />
Kinematic<br />
viscosity (nu)<br />
1.13E-06 m²/s<br />
k 0.0005 m<br />
Re 714,587<br />
λ 0.0194<br />
1.002<br />
Hf CW/DW 474 m<br />
Hf 474 m<br />
HTOTAL 958 m<br />
Pump efficiency 85%<br />
Power 4206 kW<br />
Installed Power 6309 kW<br />
Rate 15,000 R/kW<br />
Pumpstation<br />
Cost<br />
Operation and Maintenance<br />
Costs<br />
Pumpstation Cost Split Annual O&M as % of CRC<br />
Mechanical Cost 50% Pipes 0.50%<br />
Electrical Cost 20% E&M 4.00%<br />
Civil Cost 30% Civil 0.25%<br />
Item Capital Cost<br />
Estimate<br />
A B C D E<br />
Preliminary<br />
and General<br />
(% f A)<br />
Contingencies<br />
(% of A+B)<br />
Total Capital<br />
Replacement<br />
Cost<br />
R94,635,608.41<br />
Annual<br />
O&M<br />
Cost<br />
20% 10%<br />
Pumpstation 94,635,608 18,927,122 11,356,273 124,919,003 3,591,421<br />
Pipeline 598,911,829 119,782,366 71,869,419 790,563,614 3,952,818<br />
Total 7,544,239<br />
Electricity Costs<br />
Megaflex (300 to 600 km Transmission Zone)<br />
Rate: c/kWh Rate: c/kWh (incl. rural<br />
subsidy and environmental<br />
levy charge)<br />
Rate Jun-Aug Sep-May Jun-Aug Sep-May<br />
3 9 3 9<br />
Peak 197.46 55.08 203.57 61.19<br />
Standard 51.27 33.69 57.38 39.80<br />
Off peak 27.37 23.56 33.48 29.67<br />
Rural subsidy (c/kWh) 4.1 4.1<br />
Environmental levy charge<br />
(c/kWh)<br />
2.0 2.0<br />
Energy charge daily rate allocation -<br />
Megaflex<br />
20<br />
Weekdays Saturday Sunday Total per<br />
week<br />
Appendix 2 – Cost Estimates for Potential <strong>Interventions</strong> June 2012
Water Reconciliation Strategy Study for the Large Bulk Water Supply Systems: Greater Bloemfontein Area 6<br />
Peak 5 0 0 20.83333333<br />
Standard 11 7 0 51.66666667<br />
Off peak 8 17 24 67.5<br />
Hourly Daily Monthly cost<br />
Charge charge<br />
Service & Admin charge per<br />
account<br />
R61.25<br />
Network Access Charge<br />
(R/kVA/month)<br />
R9.73<br />
Network Demand Charge<br />
(R/kVA/month)<br />
R18.46<br />
Reactive Energy Charge<br />
(R/kVaRh)<br />
R0.08<br />
Transmission Network Charge<br />
(R/kVA/month)<br />
R4.92<br />
Pumpstation capacity 4,206 kW Annual<br />
Increase<br />
4,381 kVA 2012 15%<br />
Pumping hours per day 20 h 2013 15%<br />
Daily power usage 84,121 kWh/day 2014 15%<br />
Weighted average tariff 41 c/kWh<br />
Active Energy Cost R12,508,233 per annum<br />
Service & Admin Charge R58,856 per annum<br />
Network Access Charge R511,558 per annum<br />
Network Demand Charge R502,601 per annum<br />
Reactive Energy Charge R325,459 per annum<br />
Transimission network charge R258,671 per annum<br />
Total annual cost R14,165,378<br />
Orange River Costs<br />
Orange River Tariff 2.00 R/kl<br />
Flow 10000000 kl/annum<br />
Annual Orange River Cost R20,000,000<br />
Appendix 2 – Cost Estimates for Potential <strong>Interventions</strong> June 2012
Water Reconciliation Strategy Study for the Large Bulk Water Supply Systems: Greater Bloemfontein Area 7<br />
C3. Utilising surplus capacity in the Orange River by pumping to Knellpoort Dam from Bosberg/Boskraai<br />
Dam<br />
Summary of costs Base<br />
Year<br />
Pumpstation R49,202,255<br />
Pipeline R208,793,707<br />
Subtotal R257,995,962<br />
Preliminary and<br />
General<br />
20% R51,599,192<br />
Subtotal R309,595,154<br />
Contingencies 10% R30,959,515<br />
Subtotal R340,554,670<br />
Professional Fees 10% R34,055,467<br />
Total R374,610,136<br />
Pipeline<br />
Length 100 km<br />
Design velocity 1.5 m/s<br />
D 0.600 m<br />
A 0.283 m 2<br />
v 1.346 m/s<br />
SV (km) H Hf HGL P t Pipe Rate Cost<br />
km m m m m mm DN/t R/m R<br />
0 1330 21.298 1819 489 9 600/9 3171.10 R23,783,240<br />
7.5 1373 19.027 1798 425 8 600/8 2785.09 R18,660,135<br />
14.2 1552 13.063 1779 227 5 600/5 1887.74 R8,683,617<br />
18.8 1456 17.323 1766 310 6 600/6 2187.88 R13,346,064<br />
24.9 1569 14.483 1749 180 5 600/5 1887.74 R9,627,489<br />
30 1477 18.459 1734 257 5 600/5 1887.74 R12,270,329<br />
36.5 1405 24.138 1716 311 6 600/6 2187.88 R18,596,974<br />
45 1660 21.298 1692 32 5 600/5 1887.74 R14,158,072<br />
52.5 1441 11.075 1670 229 5 600/5 1887.74 R7,362,197<br />
56.4 1391 14.199 1659 268 5 600/5 1887.74 R9,438,714<br />
61.4 1645 12.495 1645 0 5 600/5 1887.74 R8,306,069<br />
65.8 1408 6.816 1567 159 5 600/5 1887.74 R4,530,583<br />
68.2 1483 9.371 1560 77 5 600/5 1887.74 R6,229,552<br />
71.5 1373 12.779 1551 178 5 600/5 1887.74 R8,494,843<br />
76 1538 18.459 1538 0 5 600/5 1887.74 R12,270,329<br />
82.5 1391 21.298 1498 107 5 600/5 1887.74 R14,158,072<br />
90 1434 28.398 1476 42 5 600/5 1887.74 R18,877,429<br />
100 1448 1448<br />
Pipeline Cost R208,793,707<br />
Pumpstation<br />
Flow to deliver 10 Mm 3 /a<br />
Pumping hours per<br />
day<br />
20<br />
Flow 0.381 m 3 /s<br />
H1 1330 m<br />
Appendix 2 – Cost Estimates for Potential <strong>Interventions</strong> June 2012<br />
2012
Water Reconciliation Strategy Study for the Large Bulk Water Supply Systems: Greater Bloemfontein Area 8<br />
H2 1645 m<br />
HS 315 m<br />
C 125<br />
L 61.4 km<br />
Hf CW 174 m<br />
Kinematic viscosity<br />
(nu)<br />
1.13E-06 m²/s<br />
k 0.0005 m<br />
Re 714,587<br />
λ 0.0194<br />
1.002<br />
Hf CW/DW 183 m<br />
Hf 183 m<br />
HTOTAL 498 m<br />
Pump efficiency 85%<br />
Power 2187 kW<br />
Installed Power 3280 kW<br />
Rate 15,000 R/kW<br />
Pumpstation Cost R49,202,254.89<br />
Operation and Maintenance<br />
Costs<br />
Pumpstation Cost Split Annual O&M as % of CRC<br />
Mechanical Cost 50% Pipes 0.50%<br />
Electrical Cost 20% E&M 4.00%<br />
Civil Cost 30% Civil 0.25%<br />
Item Capital Cost<br />
Estimate<br />
A B C D E<br />
Preliminary<br />
and General<br />
(% of A)<br />
Contingencies<br />
(% of A+B)<br />
Total Capital<br />
Replacement<br />
Cost<br />
Appendix 2 – Cost Estimates for Potential <strong>Interventions</strong> June 2012<br />
Annual<br />
O&M<br />
Cost<br />
20% 10%<br />
Pumpstation 49,202,255 9,840,451 5,904,271 64,946,976 1,867,226<br />
Pipeline 208,793,707 41,758,741 25,055,245 275,607,693 1,378,038<br />
Total<br />
Electricity Costs<br />
3,245,264<br />
Megaflex (300 to 600 km Transmission Zone)<br />
Rate: c/kWh Rate: c/kWh (incl. rural<br />
subsidy and environmental<br />
levy charge)<br />
Rate Jun-Aug Sep-May Jun-Aug Sep-May<br />
3 9 3 9<br />
Peak 197.46 55.08 203.57 61.19<br />
Standard 51.27 33.69 57.38 39.80<br />
Off peak 27.37 23.56 33.48 29.67<br />
Rural subsidy (c/kWh) 4.1 4.1<br />
Environmental levy charge<br />
(c/kWh)<br />
2.0 2.0<br />
Energy charge daily rate allocation -<br />
Megaflex<br />
20
Water Reconciliation Strategy Study for the Large Bulk Water Supply Systems: Greater Bloemfontein Area 9<br />
Weekdays Saturday Sunday Total per<br />
week<br />
Peak 5 0 0 20.83333333<br />
Standard 11 7 0 51.66666667<br />
Off peak 8 17 24 67.5<br />
Hourly Charge Daily<br />
charge<br />
Monthly cost<br />
Service & Admin charge per<br />
account<br />
R161.25<br />
Network Access Charge<br />
(R/kVA/month)<br />
R9.73<br />
Network Demand Charge<br />
(R/kVA/month)<br />
R18.46<br />
Reactive Energy Charge<br />
(R/kVaRh)<br />
R0.08<br />
Transmission Network Charge<br />
R4.92<br />
(R/kVA/month)<br />
Pumpstation capacity 2,187 kW Annual<br />
Increase<br />
2,278 kVA 2012 15%<br />
Pumping hours per day 20 h 2013 15%<br />
Daily power usage 43,735 kWh/day 2014 15%<br />
Weighted average tariff 41 c/kWh<br />
Active Energy Cost R6,503,189 per annum<br />
Service & Admin Charge R58,856 per annum<br />
Network Access Charge R265,966 per annum<br />
Network Demand Charge R261,309 per annum<br />
Reactive Energy Charge R169,210 per annum<br />
Transimission network charge R134,486 per annum<br />
Total annual cost R7,393,016<br />
Orange River Costs<br />
Orange River Tariff 2.00 R/kl<br />
Flow 10000000 kl/annum<br />
Annual Orange River Cost R20,000,000<br />
Appendix 2 – Cost Estimates for Potential <strong>Interventions</strong> June 2012
Water Reconciliation Strategy Study for the Large Bulk Water Supply Systems: Greater Bloemfontein Area 10<br />
C5a. Pumping from Welbedacht Dam to Knellpoort Dam<br />
Summary of costs Base<br />
Year<br />
Pumpstation R34,088,438<br />
Pipeline R223,703,823<br />
Subtotal R257,792,261<br />
Preliminary and<br />
General<br />
20% R51,558,452<br />
Subtotal R309,350,713<br />
Contigencies 10% R30,935,071<br />
Subtotal R340,285,785<br />
Professional Fees 10% R34,028,578<br />
Total R374,314,363<br />
Pipeline<br />
Length 25.9 km<br />
Design velocity 1.5 m/s<br />
D 1.400 m<br />
A 1.539 m 2<br />
v 1.299 m/s<br />
SV (km) H Hf HGL P t Pipe Rate Cost<br />
km m m m m mm DN/t R/m R<br />
0 1413 0.693 1479 66 11 1 400/11 8637.21 R6,046,049<br />
0.7 1395 1.980 1478 83 11 1 400/11 8637.21 R17,274,427<br />
2.7 1427 0.990 1476 49 11 1 400/11 8637.21 R8,637,213<br />
3.7 1406 5.345 1475 69 11 1 400/11 8637.21 R46,640,952<br />
9.1 1408 0.990 1470 62 11 1 400/11 8637.21 R8,637,213<br />
10.1 1426 0.792 1469 43 11 1 400/11 8637.21 R6,909,771<br />
10.9 1410 0.198 1468 58 11 1 400/11 8637.21 R1,727,443<br />
11.1 1431 0.594 1468 37 11 1 400/11 8637.21 R5,182,328<br />
11.7 1406 4.949 1467 61 11 1 400/11 8637.21 R43,186,066<br />
16.7 1438 0.297 1462 24 11 1 400/11 8637.21 R2,591,164<br />
17 1405 1.782 1462 57 11 1 400/11 8637.21 R15,546,984<br />
18.8 1440 1.049 1460 20 11 1 400/11 8637.21 R9,155,446<br />
19.86 1402 1.445 1459 57 11 1 400/11 8637.21 R12,610,331<br />
21.32 1435 1.762 1458 23 11 1 400/11 8637.21 R15,374,240<br />
23.1 1410 1.049 1456 46 11 1 400/11 8637.21 R9,155,446<br />
24.16 1442 0.485 1455 13 11 1 400/11 8637.21 R4,232,234<br />
24.65 1418 1.237 1454 36 11 1 400/11 8637.21 R10,796,517<br />
25.9 1453 1453<br />
Pumpstation<br />
Flow to deliver 52.56 Mm 3 /a<br />
Pumping hours per<br />
day<br />
20<br />
Flow 2.000 m 3 /s<br />
H1 1413 m<br />
H2 1453 m<br />
Appendix 2 – Cost Estimates for Potential <strong>Interventions</strong> June 2012<br />
2012<br />
R223,703,823
Water Reconciliation Strategy Study for the Large Bulk Water Supply Systems: Greater Bloemfontein Area 11<br />
HS 40 m<br />
C 125<br />
L 25.9 km<br />
Hf CW 26 m<br />
Kinematic viscosity<br />
(nu)<br />
1.13E-06 m²/s<br />
k 0.0005 m<br />
Re 1,609,658<br />
λ 0.0159<br />
1.000<br />
Hf CW/DW 25 m<br />
Hf 26 m<br />
HTOTAL 66 m<br />
Pump efficiency 85%<br />
Power 1515 kW<br />
Installed Power 2273 kW<br />
Rate 15,000 R/kW<br />
Pumpstation Cost R34,088,437.90<br />
Operation and Maintenance Costs<br />
Pumpstation Cost Split Annual O&M as % of CRC<br />
Mechanical Cost 50% Pipes 0.50%<br />
Electrical Cost 20% E&M 4.00%<br />
Civil Cost 30% Civil 0.25%<br />
A B C D E<br />
Item Capital Cost Preliminary Contingencies Total Capital Annual<br />
Estimate and General (% of A+B) Replacement O&M<br />
(% of A)<br />
Cost<br />
Cost<br />
20% 10%<br />
Pumpstation 34,088,438 6,817,688 4,090,613 44,996,738 1,293,656<br />
Pipeline 223,703,823 44,740,765 26,844,459 295,289,047 1,476,445<br />
Total 2,770,101<br />
Electricity Costs<br />
Megaflex (300 to 600 km Transmission Zone)<br />
Rate: c/kWh Rate: c/kWh (incl. rural<br />
subsidy and environmental<br />
levy charge)<br />
Rate Jun-Aug Sep-May Jun-Aug Sep-May<br />
3 9 3 9<br />
Peak 197.46 55.08 203.57 61.19<br />
Standard 51.27 33.69 57.38 39.80<br />
Off peak 27.37 23.56 33.48 29.67<br />
Rural subsidy (c/kWh) 4.1 4.1<br />
Environmental levy charge (c/kWh) 2.0 2.0<br />
Energy charge daily rate allocation -<br />
Megaflex<br />
20<br />
Weekdays Saturday Sunday Total per<br />
week<br />
Peak 5 0 0 20.83333333<br />
Appendix 2 – Cost Estimates for Potential <strong>Interventions</strong> June 2012
Water Reconciliation Strategy Study for the Large Bulk Water Supply Systems: Greater Bloemfontein Area 12<br />
Standard 11 7 0 51.66666667<br />
Off peak 8 17 24 67.5<br />
Hourly<br />
Charge<br />
Service & Admin charge per<br />
account<br />
Network Access Charge<br />
(R/kVA/month)<br />
Network Demand Charge<br />
(R/kVA/month)<br />
Reactive Energy Charge (R/kVaRh) R0.08<br />
Daily<br />
charge<br />
R161.25<br />
Monthly cost<br />
R9.73<br />
R18.46<br />
Transmission Network Charge<br />
(R/kVA/month)<br />
R4.92<br />
Pumpstation capacity 1,515 kW Annual<br />
Increase<br />
1,578 kVA 2012 15%<br />
Pumping hours per day 20 h 2013 15%<br />
Daily power usage 30,301 kWh/day 2014 15%<br />
Weighted average tariff 41 c/kWh<br />
Active Energy Cost R4,505,557 per annum<br />
Service & Admin Charge R58,856 per annum<br />
Network Access Charge R184,267 per annum<br />
Network Demand Charge R181,041 per annum<br />
Reactive Energy Charge R117,233 per annum<br />
Transimission network charge R93,175 per annum<br />
Total annual cost R5,140,129<br />
Orange River Costs<br />
Orange River Tariff 2.00 R/kl<br />
Flow kl/annum<br />
Annual Orange River Cost R -<br />
Appendix 2 – Cost Estimates for Potential <strong>Interventions</strong> June 2012
Water Reconciliation Strategy Study for the Large Bulk Water Supply Systems: Greater Bloemfontein Area 13<br />
C5b. Gravity Main from Knellpoort Dam to Webedacht WTW<br />
Summary of costs Base<br />
Year<br />
Pumpstation R -<br />
Pipeline R223,703,823<br />
Subtotal R223,703,823<br />
Preliminary and<br />
General<br />
20% R44,740,765<br />
Subtotal R268,444,588<br />
Contigencies 10% R26,844,459<br />
Subtotal R295,289,047<br />
Professional Fees 10% R29,528,905<br />
Total R324,817,951<br />
Pipeline<br />
Length 26 km<br />
Design velocity 1.5 m/s<br />
D 1.400 m<br />
A 1.539 m 2<br />
v 1.308 m/s<br />
SV (km) H Hf HGL P t Pipe Rate Cost<br />
km m m m m mm DN/t R/m R<br />
0 1453 1.253 1453 0 11 1 400/11 8637.21 R10,796,517<br />
1.25 1418 0.491 1452 34 11 1 400/11 8637.21 R4,232,234<br />
1.74 1442 1.063 1451 9 11 1 400/11 8637.21 R9,155,446<br />
2.8 1410 1.785 1450 40 11 1 400/11 8637.21 R15,374,240<br />
4.58 1435 1.464 1448 13 11 1 400/11 8637.21 R12,610,331<br />
6.04 1402 1.063 1447 45 11 1 400/11 8637.21 R9,155,446<br />
7.1 1440 1.805 1446 6 11 1 400/11 8637.21 R15,546,984<br />
8.9 1405 0.301 1444 39 11 1 400/11 8637.21 R2,591,164<br />
9.2 1438 5.013 1444 6 11 1 400/11 8637.21 R43,186,066<br />
14.2 1406 0.602 1439 33 11 1 400/11 8637.21 R5,182,328<br />
14.8 1431 0.201 1438 7 11 1 400/11 8637.21 R1,727,443<br />
15 1410 0.802 1438 28 11 1 400/11 8637.21 R6,909,771<br />
15.8 1426 1.003 1437 11 11 1 400/11 8637.21 R8,637,213<br />
16.8 1408 5.414 1436 28 11 1 400/11 8637.21 R46,640,952<br />
22.2 1406 1.003 1431 25 11 1 400/11 8637.21 R8,637,213<br />
23.2 1427 2.005 1430 3 11 1 400/11 8637.21 R17,274,427<br />
25.2 1395 0.702 1428 33 11 1 400/11 8637.21 R6,046,049<br />
25.9 1413 1427<br />
Appendix 2 – Cost Estimates for Potential <strong>Interventions</strong> June 2012<br />
2012<br />
R223,703,823
Water Reconciliation Strategy Study for the Large Bulk Water Supply Systems: Greater Bloemfontein Area 14<br />
Operation and Maintenance<br />
Costs<br />
Pumpstation Cost Split Annual O&M as % of CRC<br />
Mechanical Cost 50% Pipes 0.50%<br />
Electrical Cost 20% E&M 4.00%<br />
Civil Cost 30% Civil 0.25%<br />
Item Capital Cost<br />
Estimate<br />
A B C D E<br />
Preliminary<br />
and<br />
General<br />
(% of A)<br />
Contingencies<br />
(% of A+B)<br />
Total Capital<br />
Replacement<br />
Cost<br />
Annual<br />
O&M<br />
Cost<br />
20% 10%<br />
Pumpstation - - - - -<br />
Pipeline 223,703,823 44,740,765 26,844,459 295,289,047 1,476,445<br />
Total<br />
Electricity Costs<br />
1,476,445<br />
Megaflex (300 to 600 km Transmission Zone)<br />
Rate: c/kWh Rate: c/kWh (incl. rural<br />
subsidy and environmental<br />
levy charge)<br />
Rate Jun-Aug Sep-May Jun-Aug Sep-May<br />
3 9 3 9<br />
Peak 197.46 55.08 203.57 61.19<br />
Standard 51.27 33.69 57.38 39.80<br />
Off peak 27.37 23.56 33.48 29.67<br />
Rural subsidy (c/kWh) 4.1 4.1<br />
Environmental levy charge<br />
(c/kWh)<br />
2.0 2.0<br />
Energy charge daily rate allocation -<br />
Megaflex<br />
20<br />
Weekdays Saturday Sunday Total per<br />
week<br />
Peak 5 0 0 20.83333333<br />
Standard 11 7 0 51.66666667<br />
Off peak 8 17 24 67.5<br />
Hourly Daily Monthly cost<br />
Charge charge<br />
Service & Admin charge per<br />
account<br />
R161.25<br />
Network Access Charge<br />
(R/kVA/month)<br />
R9.73<br />
Network Demand Charge<br />
(R/kVA/month)<br />
R18.46<br />
Reactive Energy Charge<br />
(R/kVaRh)<br />
R0.08<br />
Transmission Network Charge<br />
(R/kVA/month)<br />
R4.92<br />
Pumpstation capacity - kW Annual<br />
Increase<br />
- kVA 2012 15%<br />
Pumping hours per day 20 h 2013 15%<br />
Daily power usage - kWh/day 2014 15%<br />
Weighted average tariff 41 c/kWh<br />
Appendix 2 – Cost Estimates for Potential <strong>Interventions</strong> June 2012
Water Reconciliation Strategy Study for the Large Bulk Water Supply Systems: Greater Bloemfontein Area 15<br />
Active Energy Cost R - per annum<br />
Service & Admin Charge per annum<br />
Network Access Charge R - per annum<br />
Network Demand Charge R - per annum<br />
Reactive Energy Charge R - per annum<br />
Transimission network charge R - per annum<br />
Total annual cost R -<br />
Orange River Costs<br />
Orange River Tariff 2.00 R/kl<br />
Flow kl/annum<br />
Annual Orange River Cost R -<br />
Appendix 2 – Cost Estimates for Potential <strong>Interventions</strong> June 2012
Water Reconciliation Strategy Study for the Large Bulk Water Supply Systems: Greater Bloemfontein Area 16<br />
D1. Planned direct re-use - New North Eastern<br />
Summary of costs Base<br />
Year<br />
Pumpstation R12,618,806<br />
Pipeline R24,163,109<br />
Reservoir R26,213,676<br />
WTW R82,991,478<br />
Subtotal R145,987,069<br />
Preliminary and<br />
General<br />
20% R29,197,414<br />
Subtotal R175,184,482<br />
Contigencies 10% R17,518,448<br />
Subtotal R192,702,931<br />
Professional Fees 10% R19,270,293<br />
Total R211,973,224<br />
Pipeline<br />
Length 12.4 km<br />
Design velocity 1.5 m/s<br />
D 0.600 m<br />
A 0.283 m 2<br />
v 1.228 m/s<br />
SV (km) H Hf HGL P t Pipe Rate Cost<br />
km m m m m mm DN/t R/m R<br />
0 1332 9.589 1471 139 5 600/5 1887.74 R7,550,972<br />
4 1357 9.589 1461 104 5 600/5 1887.74 R7,550,972<br />
8 1375 9.829 1452 77 5 600/5 1887.74 R7,739,746<br />
12.1 1442 1.678 1442 0 5 600/5 1887.74 R1,321,420<br />
12.8 1429 1429 0 5 600/5 1887.74<br />
Pipeline Cost R24,163,109<br />
Pumpstation<br />
Flow to deliver 10.95 Mm 3 /a<br />
Pumping hours per<br />
day<br />
24<br />
Flow 0.347 m 3 /s<br />
H1 1332 m<br />
H2 1442 m<br />
HS 110 m<br />
C 125<br />
L 12.1 km<br />
Hf CW 29 m<br />
Kinematic viscosity<br />
(nu)<br />
1.13E-06 m²/s<br />
k 0.0005 m<br />
Re 652,061<br />
λ 0.0193<br />
1.000<br />
Hf CW/DW 30 m<br />
Appendix 2 – Cost Estimates for Potential <strong>Interventions</strong> June 2012<br />
2012
Water Reconciliation Strategy Study for the Large Bulk Water Supply Systems: Greater Bloemfontein Area 17<br />
Hf 30 m<br />
HTOTAL 140 m<br />
Pump efficiency 85%<br />
Power 561 kW<br />
Installed Power 841 kW<br />
Rate 15,000 R/kW<br />
Pumpstation Cost R12,618,805.73<br />
Reservoir<br />
Capacity 30 Ml<br />
Rate 880 R/m 3<br />
Reservoir Cost R26,213,676.19<br />
WTW<br />
Design Feed Flow<br />
Rate<br />
44 Ml/d<br />
Product Flow Rate 1,379 m 3 /h<br />
Recovery 80%<br />
Time operational 90%<br />
Capacity of WTP 30 Ml/d<br />
Capacity of WTP 1,241 m 3 /h<br />
Average Flux Pass 1 25 (litre/m 2 .hr)<br />
Average Flux Pass 2 (litre/m 2 .hr)<br />
No of Passes (1 or 2) 1<br />
Area (membrane) 55,176<br />
Factor Pre-treatment 1.5<br />
Cap Pre treat Cost<br />
(WRC GRAPH)<br />
Cap Desal Cost<br />
(WRC GRAPH)<br />
30,179,886<br />
52,811,592<br />
Operation and Maintenance<br />
Costs<br />
Pumpstation Cost Split Annual O&M as % of CRC<br />
Mechanical Cost 50% Pipes 0.50%<br />
Electrical Cost 20% E&M 4.00%<br />
Civil Cost 30% Civil 0.25%<br />
Item Capital Cost<br />
Estimate<br />
A B C D E<br />
Preliminary<br />
and<br />
General (%<br />
of A)<br />
Contingencies<br />
(% of A+B)<br />
Total Capital<br />
Replacement<br />
Cost<br />
R82,991,477.69<br />
Annual O&M<br />
Cost<br />
20% 10%<br />
Pumpstation 12,618,806 2,523,761 1,514,257 16,656,824 478,884<br />
Pipeline 24,163,109 4,832,622 2,899,573 31,895,304 159,477<br />
Reservoir 26,213,676 5,242,735 3,145,641 34,602,053 86,505<br />
WTW 82,991,478 16,598,296 9,958,977 109,548,751 3,149,527<br />
Total 3,874,392<br />
Electricity Costs<br />
Appendix 2 – Cost Estimates for Potential <strong>Interventions</strong> June 2012
Water Reconciliation Strategy Study for the Large Bulk Water Supply Systems: Greater Bloemfontein Area 18<br />
Megaflex (300 to 600 km Transmission Zone)<br />
Rate: c/kWh Rate: c/kWh (incl. rural<br />
subsidy and environmental<br />
levy charge)<br />
Rate Jun-Aug Sep-May Jun-Aug Sep-May<br />
3 9 3 9<br />
Peak 197.46 55.08 203.57 61.19<br />
Standard 51.27 33.69 57.38 39.80<br />
Off peak 27.37 23.56 33.48 29.67<br />
Rural subsidy (c/kWh) 4.1 4.1<br />
Environmental levy charge<br />
(c/kWh)<br />
2.0 2.0<br />
Energy charge daily rate allocation -<br />
Megaflex<br />
24<br />
Weekdays Saturday Sunday Total per<br />
week<br />
Peak 5 0 0 25<br />
Standard 11 7 0 62<br />
Off peak 8 17 24 81<br />
Hourly Daily Monthly cost<br />
Charge charge<br />
Service & Admin charge per<br />
account<br />
R161.25<br />
Network Access Charge<br />
(R/kVA/month)<br />
R 9.73<br />
Network Demand Charge<br />
(R/kVA/month)<br />
R 18.46<br />
Reactive Energy Charge<br />
(R/kVaRh)<br />
R 0.08<br />
Transmission Network Charge<br />
(R/kVA/month)<br />
R 4.92<br />
Pumpstation WTW<br />
Capacity 561 kW 1,366 kW<br />
584 kVA 1,423 kVA<br />
Pumping hours per day 24 h 24 h<br />
Daily power usage 13,460 kWh/day 32,775 kWh/day<br />
Weighted average tariff 41 c/kWh 41 c/kWh<br />
Active Energy Cost R2,001,432 per annum R4,873,383 per annum<br />
Service & Admin Charge R58,856 per annum R58,856 per annum<br />
Network Access Charge R68,212 per annum R166,092 per annum<br />
Network Demand Charge R67,017 per annum R163,184 per annum<br />
Reactive Energy Charge R52,076 per annum R126,803 per annum<br />
Transimission network charge R34,491 per annum R 83,985 per annum<br />
Total annual cost R2,282,085 R5,472,303 R 7,754,388<br />
Appendix 2 – Cost Estimates for Potential <strong>Interventions</strong> June 2012
Water Reconciliation Strategy Study for the Large Bulk Water Supply Systems: Greater Bloemfontein Area 19<br />
D2. Planned Indirect Re-use - Transfer to upstream of Mockes Dam<br />
Summary of costs Base<br />
Year<br />
Pumpstation 1 R5,846,545<br />
Pipeline 1 R29,260,015<br />
Pumpstation 2 R17,177,141<br />
Pipeline 2 R37,754,858<br />
Reservoir R26,213,676<br />
WTW R82,991,478<br />
Subtotal R199,243,712<br />
Preliminary and<br />
General<br />
20% R39,848,742<br />
Subtotal R239,092,455<br />
Contigencies 10% R23,909,245<br />
Subtotal R263,001,700<br />
Professional Fees 10% R26,300,170<br />
Total R289,301,870<br />
Pipeline<br />
Length 3.74 km<br />
Design velocity 1.5 m/s<br />
D 0.600 m<br />
A 0.283 m 2<br />
v 1.228 m/s<br />
SV (km) H Hf HGL P t Pipe Rate Cost<br />
km m m m m mm DN/t R/m R<br />
0 1333 4.795 1397 64 5 600/5 1887.74 R3,775,486<br />
2 1336 4.795 1392 56 5 600/5 1887.74 R3,775,486<br />
4 1358 4.795 1388 30 5 600/5 1887.74 R3,775,486<br />
6 1369 2.829 1383 14 5 600/5 1887.74 R2,227,537<br />
7.18 1363 2.973 1380 17 5 600/5 1887.74 R2,340,801<br />
8.42 1377 3.788 1377 0 5 600/5 1887.74 R2,982,634<br />
10 1356 3.116 1359 3 5 600/5 1887.74 R2,454,066<br />
11.3 1332 4.075 1356 24 5 600/5 1887.74 R3,209,163<br />
13 1352 5.034 1352 0 5 600/5 1887.74 R3,964,260<br />
15.1 1317 0.959 1326 9 5 600/5 1887.74 R755,097<br />
15.5 1325 1325 5 600/5 1887.74<br />
Pipeline Cost R29,260,015<br />
Pumpstation<br />
Flow to deliver 10.95 Mm 3 /a<br />
Pumping hours per<br />
day<br />
24<br />
Flow 0.347 m 3 /s<br />
H1 1333 m<br />
H2 1377 m<br />
HS 44 m<br />
C 125<br />
Appendix 2 – Cost Estimates for Potential <strong>Interventions</strong> June 2012<br />
2012
Water Reconciliation Strategy Study for the Large Bulk Water Supply Systems: Greater Bloemfontein Area 20<br />
L 8.42 km<br />
Hf CW 20 m<br />
Kinematic viscosity<br />
(nu)<br />
1.13E-06 m²/s<br />
k 0.0005 m<br />
Re 652,061<br />
λ 0.0193<br />
1.000<br />
Hf CW/DW 21 m<br />
Hf 21 m<br />
HTOTAL 65 m<br />
Pump efficiency 85%<br />
Power 260 kW<br />
Installed Power 390 kW<br />
Rate 15,000 R/kW<br />
Pumpstation Cost R5,846,544.92<br />
Pipeline<br />
Length 3.74 km<br />
Design velocity 1.5 m/s<br />
D 0.600 m<br />
A 0.283 m 2<br />
v 1.228 m/s<br />
SV (km) H Hf HGL P t Pipe Rate Cost<br />
km m m m m mm DN/t R/m R<br />
0 1304 1.918 1493 189 5 600/5 1887.74 R1,510,194<br />
0.8 1365 2.757 1491 126 5 600/5 1887.74 R2,170,904<br />
1.95 1328 4.171 1488 160 5 600/5 1887.74 R3,284,673<br />
3.69 1353 8.990 1484 131 5 600/5 1887.74 R7,079,036<br />
7.44 1319 12.130 1475 156 5 600/5 1887.74 R9,551,979<br />
12.5 1334 11.507 1463 129 5 600/5 1887.74 R9,061,166<br />
17.3 1386 6.473 1451 65 5 600/5 1887.74 R5,096,906<br />
20 1445 1445 0 5 600/5 1887.74<br />
Pipeline Cost R37,754,858<br />
Pumpstation<br />
Flow to deliver 10.95 Mm 3 /a<br />
Pumping hours per<br />
day<br />
24<br />
Flow 0.347 m 3 /s<br />
H1 1304 m<br />
H2 1445 m<br />
HS 141 m<br />
C 125<br />
L 20 km<br />
Hf CW 48 m<br />
Kinematic viscosity<br />
(nu)<br />
1.13E-06 m²/s<br />
k 0.0005 m<br />
Re 652,061<br />
Appendix 2 – Cost Estimates for Potential <strong>Interventions</strong> June 2012
Water Reconciliation Strategy Study for the Large Bulk Water Supply Systems: Greater Bloemfontein Area 21<br />
λ 0.0193<br />
1.000<br />
Hf CW/DW 50 m<br />
Hf 50 m<br />
HTOTAL 191 m<br />
Pump efficiency 85%<br />
Power 763 kW<br />
Installed Power 1145 kW<br />
Rate 15,000 R/kW<br />
Pumpstation Cost R17,177,140.76<br />
Reservoir<br />
Capacity 30 Ml<br />
Rate 880 R/m 3<br />
Reservoir Cost R26,213,676.19<br />
WTW<br />
Design Feed Flow<br />
Rate<br />
44 Ml/d<br />
Product Flow Rate 1,379 m 3 /h<br />
Recovery 80%<br />
Time operational 90%<br />
Capacity of WTP 30 Ml/d<br />
Capacity of WTP 1,241 m 3 /h<br />
Average Flux Pass 1 25 (litre/m 2 .hr)<br />
Average Flux Pass 2 (litre/m 2 .hr)<br />
No of Passes (1 or 2) 1<br />
Area (membrane) 55,176<br />
Factor Pre-treatment 1.5<br />
Cap Pre treat Cost<br />
(WRC GRAPH)<br />
Cap Desal Cost<br />
(WRC GRAPH)<br />
30,179,886<br />
52,811,592<br />
R82,991,477.69<br />
Operation and Maintenance Costs<br />
Pumpstation Cost Split Annual O&M as % of CRC<br />
Mechanical Cost 50% Pipes 0.50%<br />
Electrical Cost 20% E&M 4.00%<br />
Civil Cost 30% Civil 0.25%<br />
A B C D<br />
Item Capital Cost Preliminary Contingencies Total Capital<br />
Estimate and General (% of A+B) Replacement<br />
(% of A)<br />
Cost<br />
20% 10%<br />
Pumpstations 23,023,686 4,604,737 2,762,842 30,391,265<br />
Pipelines 67,014,873 13,402,975 8,041,785 88,459,632<br />
Reservoir 17,177,141 3,435,428 2,061,257 22,673,826<br />
WTW 37,754,858 7,550,972 4,530,583 49,836,412<br />
Appendix 2 – Cost Estimates for Potential <strong>Interventions</strong> June 2012
Water Reconciliation Strategy Study for the Large Bulk Water Supply Systems: Greater Bloemfontein Area 22<br />
Total<br />
Electricity Costs<br />
Megaflex (300 to 600 km Transmission Zone)<br />
Rate: c/kWh Rate: c/kWh (incl. rural<br />
subsidy and environmental<br />
levy charge)<br />
Rate Jun-Aug Sep-May Jun-Aug Sep-May<br />
3 9 3 9<br />
Peak 197.46 55.08 203.57 61.19<br />
Standard 51.27 33.69 57.38 39.80<br />
Off peak 27.37 23.56 33.48 29.67<br />
Rural subsidy (c/kWh) 4.1 4.1<br />
Environmental levy charge (c/kWh) 2.0 2.0<br />
Energy charge daily rate allocation -<br />
Megaflex<br />
24<br />
Weekdays Saturday Sunday Total per<br />
week<br />
Peak 5 0 0 25<br />
Standard 11 7 0 62<br />
Off peak 8 17 24 81<br />
Hourly<br />
Charge<br />
Daily charge Monthly cost<br />
Service & Admin charge per account R161.25<br />
Network Access Charge (R/kVA/month) R9.73<br />
Network Demand Charge (R/kVA/month) R18.46<br />
Reactive Energy Charge (R/kVaRh) R0.08<br />
Transmission Network Charge<br />
(R/kVA/month)<br />
R4.92<br />
Pumpstation WTW<br />
Capacity 260 kW 1,366 kW<br />
271 kVA 1,423 kVA<br />
Pumping hours per day 24 h 24 h<br />
Daily power usage 6,236 kWh/day 32,775 kWh/day<br />
Weighted average tariff 41 c/kWh 41 c/kWh<br />
Active Energy Cost R927,304 per annum R4,873,383 per annum<br />
Service & Admin Charge R58,856 per annum R58,856 per annum<br />
Network Access Charge R31,604 per annum R166,092 per annum<br />
Network Demand Charge R31,050 per annum R163,184 per annum<br />
Reactive Energy Charge R24,128 per annum R126,803 per annum<br />
Transmission network charge R15,981 per annum R83,985 per annum<br />
Total annual cost R1,088,923<br />
Appendix 2 – Cost Estimates for Potential <strong>Interventions</strong> June 2012
Water Reconciliation Strategy Study for the Large Bulk Water Supply Systems: Greater Bloemfontein Area 23<br />
D3. Planned Indirect Re-use - Krugersdrift Dam<br />
Summary of costs Base<br />
Year<br />
Pumpstation R26,055,414<br />
Pipeline R72,847,851<br />
Reservoir R25,584,631<br />
WTW R86,697,389<br />
Subtotal R211,185,286<br />
Preliminary and<br />
General<br />
20% R42,237,057<br />
Subtotal R253,422,343<br />
Contingencies 10% R25,342,234<br />
Subtotal R278,764,578<br />
Professional Fees 10% R27,876,458<br />
Total R306,641,035<br />
Pipeline<br />
Length 200 km<br />
Design velocity 1.5 m/s<br />
D 0.600 m<br />
A 0.283 m 2<br />
v 1.228 m/s<br />
SV (km) H Hf HGL P t Pipe Rate Cost<br />
km m m m m mm DN/t R/m R<br />
0 1249 23.973 1536 287 6 600/6 2187.88 R21,878,793<br />
10 1279 23.973 1512 233 5 600/5 1887.74 R18,877,429<br />
20 1328 23.973 1488 160 5 600/5 1887.74 R18,877,429<br />
30 1404 3.596 1464 60 5 600/5 1887.74 R2,831,614<br />
31.5 1460 13.185 1460 0 5 600/5 1887.74 R10,382,586<br />
37 1432 1432 0 5 600/5 1887.74<br />
Pumpstation<br />
Flow to deliver 10.95 Mm 3 /a<br />
Pumping hours per<br />
day<br />
24<br />
Flow 0.347 m 3 /s<br />
H1 1249 m<br />
H2 1460 m<br />
HS 211 m<br />
C 125<br />
L 31.5 km<br />
Hf CW 76 m<br />
Kinematic viscosity<br />
(nu)<br />
1.13E-06 m²/s<br />
k 0.0005 m<br />
Re 652,061<br />
λ 0.0193<br />
Hf CW/DW 78 m<br />
Appendix 2 – Cost Estimates for Potential <strong>Interventions</strong> June 2012<br />
2012<br />
R72,847,851
Water Reconciliation Strategy Study for the Large Bulk Water Supply Systems: Greater Bloemfontein Area 24<br />
Hf 78 m<br />
HTOTAL 289 m<br />
Pump efficiency 85%<br />
Power 1158 kW<br />
Installed Power 1737 kW<br />
Rate 15,000 R/kW<br />
Pumpstation Cost R26,055,414.44<br />
Reservoir<br />
Capacity 31 Ml<br />
Rate 827 R/m 3<br />
Reservoir Cost R25,584,631.49<br />
WTW<br />
Design Feed Flow<br />
Rate<br />
45 Ml/d<br />
Product Flow Rate 1,433 m 3 /h<br />
Recovery 80%<br />
Time operational 90%<br />
Capacity of WTP 31 Ml/d<br />
Capacity of WTP 1,289 m 3 /h<br />
Average Flux Pass 1 25 (litre/m 2 .hr)<br />
Average Flux Pass 2 (litre/m 2 .hr)<br />
No of Passes (1 or 2) 1<br />
Area (membrane) 57,304<br />
Factor Pre-treatment 1.5<br />
Cap Pre treat Cost<br />
(WRC GRAPH)<br />
Cap Desal Cost<br />
(WRC GRAPH)<br />
31,365,504<br />
55,331,885<br />
R86,697,389.07<br />
Operation and Maintenance Costs<br />
Pumpstation Cost Split Annual O&M as % of CRC<br />
Mechanical Cost 50% Pipes 0.50%<br />
Electrical Cost 20% E&M 4.00%<br />
Civil Cost 30% Civil 0.25%<br />
A B C D E<br />
Item Capital Cost Preliminary Contingencies Total Capital Annual<br />
Estimate and General (% of A+B) Replacement O&M<br />
(% of A)<br />
Cost<br />
Cost<br />
20% 10%<br />
Pumpstation 26,055,414 5,211,083 3,126,650 34,393,147 988,803<br />
Pipeline 72,847,851 14,569,570 8,741,742 96,159,163 480,796<br />
Reservoir 25,584,631 5,116,926 3,070,156 33,771,714 84,429<br />
WTW 86,697,389 17,339,478 10,403,687<br />
Total<br />
Electricity Costs<br />
4,844,194<br />
Megaflex (300 to 600 km Transmission Zone)<br />
Appendix 2 – Cost Estimates for Potential <strong>Interventions</strong> June 2012
Water Reconciliation Strategy Study for the Large Bulk Water Supply Systems: Greater Bloemfontein Area 25<br />
Rate: c/kWh Rate: c/kWh (incl. rural<br />
subsidy and environmental<br />
levy charge)<br />
Rate Jun-Aug Sep-May Jun-Aug Sep-May<br />
3 9 3 9<br />
Peak 197.46 55.08 203.57 61.19<br />
Standard 51.27 33.69 57.38 39.80<br />
Off peak 27.37 23.56 33.48 29.67<br />
Rural subsidy (c/kWh) 4.1 4.1<br />
Environmental levy charge (c/kWh) 2.0 2.0<br />
Energy charge daily rate allocation -<br />
Megaflex<br />
24<br />
Weekdays Saturday Sunday Total per<br />
week<br />
Peak 5 0 0 25<br />
Standard 11 7 0 62<br />
Off peak 8 17 24 81<br />
Hourly Daily Monthly cost<br />
Charge charge<br />
Service & Admin charge per<br />
account<br />
R161.25<br />
Network Access Charge<br />
(R/kVA/month)<br />
R9.73<br />
Network Demand Charge<br />
(R/kVA/month)<br />
R18.46<br />
Reactive Energy Charge (R/kVaRh) R 0.08<br />
Transmission Network Charge<br />
(R/kVA/month)<br />
R4.92<br />
Pumpstation WTW<br />
Capacity 1,158 kW 1,418 kW<br />
1,206 kVA 1,477 kVA<br />
Pumping hours per day 24 h 24 h<br />
Daily power usage 27,792 kWh/day 34,039 kWh/day<br />
Weighted average tariff 41 c/kWh 41 c/kWh<br />
Active Energy Cost R4,132,574 per annum R5,061,337 per annum<br />
Service & Admin Charge R58,856 per annum R58,856 per annum<br />
Network Access Charge R140,844 per annum R172,498 per annum<br />
Network Demand Charge R138,378 per annum R169,477 per annum<br />
Reactive Energy Charge R107,528 per annum R131,694 per annum<br />
Transmission network charge R71,218 per annum R87,224 per annum<br />
Total annual cost R4,649,398<br />
Appendix 2 – Cost Estimates for Potential <strong>Interventions</strong> June 2012
Water Reconciliation Strategy Study for the Large Bulk Water Supply Systems: Greater Bloemfontein Area 26<br />
D4. Planned Direct Re-use - Bloemspruit<br />
Summary of costs Base<br />
Year<br />
Pumpstation R7,286,471<br />
Pipeline R7,060,158<br />
Reservoir R26,213,676<br />
WTW R82,991,478<br />
Subtotal R123,551,783<br />
Preliminary and<br />
General<br />
20% R24,710,357<br />
Subtotal R148,262,139<br />
Contigencies 10% R14,826,214<br />
Subtotal R163,088,353<br />
Professional Fees 10% R16,308,835<br />
Total R179,397,189<br />
Pipeline<br />
Length 3.74 km<br />
Design velocity 1.5 m/s<br />
D 0.600 m<br />
A 0.283 m 2<br />
v 1.228 m/s<br />
SV (km) H Hf HGL P t Pipe Rate Cost<br />
km m m m m mm DN/t R/m R<br />
0 1376 2.397 1457 81 5 600/5 1887.74 R1,887,743<br />
1 1376 2.397 1454 78 5 600/5 1887.74 R1,887,743<br />
2 1381 0.216 1452 71 5 600/5 1887.74 R169,897<br />
2.09 1371 0.216 1452 81 5 600/5 1887.74 R169,897<br />
2.18 1378 0.767 1451 73 5 600/5 1887.74 R604,078<br />
2.5 1383 1.798 1451 68 5 600/5 1887.74 R1,415,807<br />
3.25 1402 0.743 1449 47 5 600/5 1887.74 R585,200<br />
3.56 1448 0.432 1448 0 5 600/5 1887.74 R339,794<br />
3.74 1439 1439 0 5 600/5 1887.74<br />
Pipeline Cost R7,060,158<br />
Pumpstation<br />
Flow to deliver 10.95 Mm 3 /a<br />
Pumping hours per<br />
day<br />
24<br />
Flow 0.347 m 3 /s<br />
H1 1376 m<br />
H2 1448 m<br />
HS 72 m<br />
C 125<br />
L 3.56 km<br />
Hf CW 9 m<br />
Kinematic viscosity<br />
(nu)<br />
1.13E-06 m²/s<br />
k 0.0005 m<br />
Appendix 2 – Cost Estimates for Potential <strong>Interventions</strong> June 2012<br />
2012
Water Reconciliation Strategy Study for the Large Bulk Water Supply Systems: Greater Bloemfontein Area 27<br />
Re 652,061<br />
λ 0.0193<br />
1.000<br />
Hf CW/DW 9 m<br />
Hf 9 m<br />
HTOTAL 81 m<br />
Pump efficiency 85%<br />
Power 324 kW<br />
Installed Power 486 kW<br />
Rate 15,000 R/kW<br />
Pumpstation Cost R7,286,470.58<br />
Reservoir<br />
Capacity 30 Ml<br />
Rate 880 R/m 3<br />
Reservoir Cost R26,213,676.19<br />
WTW<br />
Design Feed Flow<br />
Rate<br />
44 Ml/d<br />
Product Flow Rate 1,379 m 3 /h<br />
Recovery 80%<br />
Time operational 90%<br />
Capacity of WTP 30 Ml/d<br />
Capacity of WTP 1,241 m 3 /h<br />
Average Flux Pass 1 25 (litre/m 2 .hr)<br />
Average Flux Pass 2 (litre/m 2 .hr)<br />
No of Passes (1 or 2) 1<br />
Area (membrane) 55,176<br />
Factor Pre-treatment 1.5<br />
Cap Pre treat Cost<br />
(WRC GRAPH)<br />
Cap Desal Cost (WRC<br />
GRAPH)<br />
30,179,886<br />
52,811,592<br />
R82,991,477.69<br />
Operation and Maintenance Costs<br />
Pumpstation Cost Split Annual O&M as % of CRC<br />
Mechanical Cost 50% Pipes 0.50%<br />
Electrical Cost 20% E&M 4.00%<br />
Civil Cost 30% Civil 0.25%<br />
A B C D<br />
Item Capital Cost Preliminary Contingencies Total Capital<br />
Estimate and General (% of A+B) Replacement<br />
(% of A)<br />
Cost<br />
20% 10%<br />
Pumpstation 7,286,471 1,457,294 874,376 9,618,141<br />
Pipeline 7,060,158 1,412,032 847,219 9,319,409<br />
Reservoir 26,213,676 5,242,735 3,145,641 34,602,053<br />
Appendix 2 – Cost Estimates for Potential <strong>Interventions</strong> June 2012
Water Reconciliation Strategy Study for the Large Bulk Water Supply Systems: Greater Bloemfontein Area 28<br />
WTW 82,991,478 16,598,296 9,958,977 109,548,751<br />
Total<br />
Electricity Costs<br />
Megaflex (300 to 600 km Transmission Zone)<br />
Rate: c/kWh Rate: c/kWh (incl. rural<br />
subsidy and environmental<br />
levy charge)<br />
Rate Jun-Aug Sep-May Jun-Aug Sep-May<br />
3 9 3 9<br />
Peak 197.46 55.08 203.57 61.19<br />
Standard 51.27 33.69 57.38 39.80<br />
Off peak 27.37 23.56 33.48 29.67<br />
Rural subsidy (c/kWh) 4.1 4.1<br />
Environmental levy charge (c/kWh) 2.0 2.0<br />
Energy charge daily rate allocation -<br />
Megaflex<br />
24<br />
Weekdays Saturday Sunday Total per<br />
week<br />
Peak 5 0 0 25<br />
Standard 11 7 0 62<br />
Off peak 8 17 24 81<br />
Hourly<br />
Charge<br />
Daily charge Monthly cost<br />
Service & Admin charge per account R161.25<br />
Network Access Charge (R/kVA/month) R9.73<br />
Network Demand Charge (R/kVA/month) R18.46<br />
Reactive Energy Charge (R/kVaRh) R0.08<br />
Transmission Network Charge<br />
(R/kVA/month)<br />
R4.92<br />
Pumpstation WTW<br />
Capacity 324 kW 1,366 kW<br />
337 kVA 1,423 kVA<br />
Pumping hours per day 24 h 24 h<br />
Daily power usage 7,772 kWh/day 32,775 kWh/day<br />
Weighted average tariff 41 c/kWh 41 c/kWh<br />
Active Energy Cost R1,155,686 per annum R4,873,383 per annum<br />
Service & Admin Charge R58,856 per annum R58,856 per annum<br />
Network Access Charge R39,387 per annum R166,092 per annum<br />
Network Demand Charge R38,698 per annum R163,184 per annum<br />
Reactive Energy Charge R30,070 per annum R126,803 per annum<br />
Transmission network charge R19,916 per annum R83,985 per annum<br />
Total annual cost R1,342,614<br />
Appendix 2 – Cost Estimates for Potential <strong>Interventions</strong> June 2012
Water Reconciliation Strategy Study for the Large Bulk Water Supply Systems: Greater Bloemfontein Area 29<br />
E. Groundwater<br />
Proposed Scheme Name E1.<br />
Ikgomotseng<br />
Number of Proposed<br />
Boreholes<br />
Refurbishment & Testing of<br />
Existing Boreholes<br />
Geophysical &<br />
Geohydrological Activities<br />
E2.<br />
Bloemfontein<br />
E3.<br />
Thaba Nchu<br />
E4.<br />
Reddersburg<br />
E5.<br />
Edenburg<br />
E6.<br />
Dewetsdorp<br />
E7.<br />
Wepener<br />
E8a.<br />
De Hoek<br />
Reservoir<br />
10 675 50 8 8 7 7 28 27<br />
2 0 0 9 12 4 4 0 0<br />
E8b.<br />
Lieukop<br />
Off-take<br />
Chamber<br />
R220,000 R10,125,000 R1,000,000 R256,000 R288,000 R224,000 R238,000 R560,000 R540,000<br />
Percussion Drilling R500,000 R33,750,000 R2,500,000 R500,000 R500,000 R450,000 R450,000 R1,400,000 R1,350,000<br />
Aquifer Test Pumping Cost R220,000 R16,200,000 R1,100,000 R374,000 R440,000 R154,000 R242,000 R616,000 R594,000<br />
Pumping Equipment Cost R240,000 R16,875,000 R4,000,000 R340,000 R400,000 R140,000 R220,000 R560,000 R540,000<br />
<strong>DWA</strong>F Pump House Structure<br />
Cost<br />
R780,000 R43,875,000 R3,000,000 R1,105,000 R1,300,000 R715,000 R715,000 R1,820,000 R1,755,000<br />
Total (Well Field) R1,960,012 R120,825,675 R11,600,050 R2,575,017 R2,928,020 R1,683,011 R1,865,011 R4,956,028 R4,779,027<br />
Land Acquisition Costs (Very<br />
Rough Est from Sarel de Wet)<br />
R0 R881,134,250 R0 R0 R0 R0 R0 R107,100 R61,605<br />
Appendix 2 – Cost Estimates for Potential <strong>Interventions</strong> June 2012
Water Reconciliation Strategy Study for the Large Bulk Water Supply Systems: Greater Bloemfontein Area 30<br />
Annual Opertional Cost (GW) R160,111 R13,745,502 R1,931,000 R243,656 R291,690 R157,100 R157,100 R419,779 R403,768<br />
Distance to Reservoir (km) 1km x 2 ~30km<br />
(centroid)<br />
Pipelines and Pump Stations<br />
Capital Cost<br />
Annual Operational &<br />
Maintenance Cost (Surface<br />
Infra)<br />
300m x 50 2km 2km 2km 2km 11km 9km<br />
R6,417,576 R3,741,787,598 R21,067,200 R4,125,528 R4,125,528 R4,652,366 R4,055,832 R37,913,141 R38,465,286<br />
R77,927 R25,493,459 R216,500 R39,656 R39,656 R41,319 R39,436 R370,787 R567,795<br />
Total Scheme Capital Cost R8,377,588 R4,743,747,523 R32,667,250 R6,700,545 R7,053,548 R6,335,377 R5,920,843 R42,976,269 R43,305,918<br />
Total Scheme Operational &<br />
Maintenance Cost<br />
R238,038 R39,238,962 R2,147,500 R283,312 R331,345 R198,419 R196,536 R790,566 R971,562<br />
Appendix 2 – Cost Estimates for Potential <strong>Interventions</strong> June 2012
Water Reconciliation Strategy Study for the Large Bulk Water Supply Systems: Greater Bloemfontein Area<br />
Water Reconciliation Strategy Study for the<br />
Large Bulk Water Supply Systems:<br />
Greater Bloemfontein Area<br />
APPENDIX 3<br />
Derivation of Unit Reference Values for Potential<br />
<strong>Interventions</strong><br />
Appendix 3 – Derivation of Unit Reference Values for Potential <strong>Interventions</strong> June 2012
Water Reconciliation Strategy Study for the Large Bulk Water Supply Systems: Greater Bloemfontein Area<br />
NOTE:<br />
No unit reference values were calculated for the following interventions:<br />
A1<br />
A2<br />
B1<br />
C4<br />
D5<br />
F1<br />
Appendix 3 – Derivation of Unit Reference Values for Potential <strong>Interventions</strong> June 2012
Water Reconciliation Strategy Study for the Large Bulk Water Supply Systems: Greater Bloemfontein Area 1<br />
C1a. Utilising surplus capacity in the Orange River by pumping to Knellpoort Dam from Gariep Dam<br />
Year Capital O&M Electricty Orange<br />
River<br />
2012<br />
2013<br />
2014<br />
2015<br />
2016<br />
2017<br />
2018<br />
2019<br />
2020<br />
2021<br />
2022<br />
2023<br />
2024<br />
2025<br />
2026<br />
2027<br />
2028<br />
2029<br />
2030<br />
2031<br />
2032<br />
2033<br />
2034<br />
2035<br />
2036<br />
2037<br />
2038<br />
2039<br />
858,832,634<br />
429,416,317<br />
429,416,317<br />
-<br />
-<br />
-<br />
-<br />
-<br />
-<br />
-<br />
-<br />
-<br />
-<br />
-<br />
-<br />
-<br />
-<br />
-<br />
-<br />
-<br />
-<br />
-<br />
-<br />
-<br />
-<br />
-<br />
-<br />
-<br />
-<br />
6,669,349<br />
-<br />
-<br />
6,669,349<br />
6,669,349<br />
6,669,349<br />
6,669,349<br />
6,669,349<br />
6,669,349<br />
6,669,349<br />
6,669,349<br />
6,669,349<br />
6,669,349<br />
6,669,349<br />
6,669,349<br />
6,669,349<br />
6,669,349<br />
6,669,349<br />
6,669,349<br />
6,669,349<br />
6,669,349<br />
6,669,349<br />
6,669,349<br />
6,669,349<br />
6,669,349<br />
6,669,349<br />
6,669,349<br />
6,669,349<br />
6,669,349<br />
13,208,429<br />
-<br />
-<br />
15,692,935<br />
17,105,299<br />
17,105,299<br />
17,105,299<br />
17,105,299<br />
17,105,299<br />
17,105,299<br />
17,105,299<br />
17,105,299<br />
17,105,299<br />
17,105,299<br />
17,105,299<br />
17,105,299<br />
17,105,299<br />
17,105,299<br />
17,105,299<br />
17,105,299<br />
17,105,299<br />
17,105,299<br />
17,105,299<br />
17,105,299<br />
17,105,299<br />
17,105,299<br />
17,105,299<br />
17,105,299<br />
17,105,299<br />
40,000,000<br />
-<br />
-<br />
40,000,000<br />
40,000,000<br />
40,000,000<br />
40,000,000<br />
40,000,000<br />
40,000,000<br />
40,000,000<br />
40,000,000<br />
40,000,000<br />
40,000,000<br />
40,000,000<br />
40,000,000<br />
40,000,000<br />
40,000,000<br />
40,000,000<br />
40,000,000<br />
40,000,000<br />
40,000,000<br />
40,000,000<br />
40,000,000<br />
40,000,000<br />
40,000,000<br />
40,000,000<br />
40,000,000<br />
40,000,000<br />
40,000,000<br />
Total Annual Yield URV<br />
429,416,317<br />
429,416,317<br />
62,362,284<br />
63,774,648<br />
63,774,648<br />
63,774,648<br />
63,774,648<br />
63,774,648<br />
63,774,648<br />
63,774,648<br />
63,774,648<br />
63,774,648<br />
63,774,648<br />
63,774,648<br />
63,774,648<br />
63,774,648<br />
63,774,648<br />
63,774,648<br />
63,774,648<br />
63,774,648<br />
63,774,648<br />
63,774,648<br />
63,774,648<br />
63,774,648<br />
63,774,648<br />
63,774,648<br />
63,774,648<br />
63,774,648<br />
20000000<br />
Appendix 3 – Derivation of Unit Reference Values for Potential <strong>Interventions</strong> June 2012<br />
-<br />
-<br />
20,000,000<br />
20,000,000<br />
20,000,000<br />
20,000,000<br />
20,000,000<br />
20,000,000<br />
20,000,000<br />
20,000,000<br />
20,000,000<br />
20,000,000<br />
20,000,000<br />
20,000,000<br />
20,000,000<br />
20,000,000<br />
20,000,000<br />
20,000,000<br />
20,000,000<br />
20,000,000<br />
20,000,000<br />
20,000,000<br />
20,000,000<br />
20,000,000<br />
20,000,000<br />
20,000,000<br />
20,000,000<br />
20,000,000
Water Reconciliation Strategy Study for the Large Bulk Water Supply Systems: Greater Bloemfontein Area 2<br />
2040<br />
2041<br />
2042<br />
2043<br />
2044<br />
2045<br />
2046<br />
2047<br />
2048<br />
2049<br />
2050<br />
2051<br />
2052<br />
2053<br />
2054<br />
2055<br />
2056<br />
2057<br />
2058<br />
2059<br />
2060<br />
2061<br />
NPV<br />
(4%)<br />
NPV<br />
(6%)<br />
NPV<br />
(8%)<br />
-<br />
-<br />
-<br />
-<br />
-<br />
-<br />
-<br />
-<br />
-<br />
-<br />
-<br />
-<br />
-<br />
-<br />
-<br />
-<br />
-<br />
-<br />
-<br />
-<br />
-<br />
-<br />
6,669,349<br />
6,669,349<br />
6,669,349<br />
6,669,349<br />
6,669,349<br />
6,669,349<br />
6,669,349<br />
6,669,349<br />
6,669,349<br />
6,669,349<br />
6,669,349<br />
6,669,349<br />
6,669,349<br />
6,669,349<br />
6,669,349<br />
6,669,349<br />
6,669,349<br />
6,669,349<br />
6,669,349<br />
6,669,349<br />
6,669,349<br />
6,669,349<br />
17,105,299<br />
17,105,299<br />
17,105,299<br />
17,105,299<br />
17,105,299<br />
17,105,299<br />
17,105,299<br />
17,105,299<br />
17,105,299<br />
17,105,299<br />
17,105,299<br />
17,105,299<br />
17,105,299<br />
17,105,299<br />
17,105,299<br />
17,105,299<br />
17,105,299<br />
17,105,299<br />
17,105,299<br />
17,105,299<br />
17,105,299<br />
17,105,299<br />
40,000,000<br />
40,000,000<br />
40,000,000<br />
40,000,000<br />
40,000,000<br />
40,000,000<br />
40,000,000<br />
40,000,000<br />
40,000,000<br />
40,000,000<br />
40,000,000<br />
40,000,000<br />
40,000,000<br />
40,000,000<br />
40,000,000<br />
40,000,000<br />
40,000,000<br />
40,000,000<br />
40,000,000<br />
40,000,000<br />
40,000,000<br />
40,000,000<br />
63,774,648<br />
63,774,648<br />
63,774,648<br />
63,774,648<br />
63,774,648<br />
63,774,648<br />
63,774,648<br />
63,774,648<br />
63,774,648<br />
63,774,648<br />
63,774,648<br />
63,774,648<br />
63,774,648<br />
63,774,648<br />
63,774,648<br />
63,774,648<br />
63,774,648<br />
63,774,648<br />
63,774,648<br />
63,774,648<br />
63,774,648<br />
63,774,648<br />
2,058,397,987<br />
1,674,386,025<br />
1,431,100,899<br />
20,000,000<br />
20,000,000<br />
20,000,000<br />
20,000,000<br />
20,000,000<br />
20,000,000<br />
20,000,000<br />
20,000,000<br />
20,000,000<br />
20,000,000<br />
20,000,000<br />
20,000,000<br />
20,000,000<br />
20,000,000<br />
20,000,000<br />
20,000,000<br />
20,000,000<br />
20,000,000<br />
20,000,000<br />
20,000,000<br />
20,000,000<br />
20,000,000<br />
391,921,799<br />
278,569,359<br />
209,004,398<br />
Appendix 3 – Derivation of Unit Reference Values for Potential <strong>Interventions</strong> June 2012<br />
5.25<br />
6.01<br />
6.85
Water Reconciliation Strategy Study for the Large Bulk Water Supply Systems: Greater Bloemfontein Area 3<br />
C2. Utilising surplus capacity in the Orange River by pumping to Knellpoort Dam from Vanderkloof<br />
Dam<br />
Year Capital O&M Electricty Orange<br />
River<br />
Total Annual Yield<br />
10000000<br />
URV<br />
2012<br />
1,007,030,879 7,544,239 14,165,378 20,000,000<br />
2013<br />
503,515,440 -<br />
-<br />
-<br />
503,515,440 -<br />
2014<br />
503,515,440 -<br />
-<br />
-<br />
503,515,440 -<br />
2015<br />
-<br />
7,544,239 16,829,886 20,000,000 44,374,125 10,000,000<br />
2016<br />
-<br />
7,544,239 18,344,576 20,000,000 45,888,815 10,000,000<br />
2017<br />
-<br />
7,544,239 18,344,576 20,000,000 45,888,815 10,000,000<br />
2018<br />
-<br />
7,544,239 18,344,576 20,000,000 45,888,815 10,000,000<br />
2019<br />
-<br />
7,544,239 18,344,576 20,000,000 45,888,815 10,000,000<br />
2020<br />
-<br />
7,544,239 18,344,576 20,000,000 45,888,815 10,000,000<br />
2021<br />
-<br />
7,544,239 18,344,576 20,000,000 45,888,815 10,000,000<br />
2022<br />
-<br />
7,544,239 18,344,576 20,000,000 45,888,815 10,000,000<br />
2023<br />
-<br />
7,544,239 18,344,576 20,000,000 45,888,815 10,000,000<br />
2024<br />
-<br />
7,544,239 18,344,576 20,000,000 45,888,815 10,000,000<br />
2025<br />
-<br />
7,544,239 18,344,576 20,000,000 45,888,815 10,000,000<br />
2026<br />
-<br />
7,544,239 18,344,576 20,000,000 45,888,815 10,000,000<br />
2027<br />
-<br />
7,544,239 18,344,576 20,000,000 45,888,815 10,000,000<br />
2028<br />
-<br />
7,544,239 18,344,576 20,000,000 45,888,815 10,000,000<br />
2029<br />
-<br />
7,544,239 18,344,576 20,000,000 45,888,815 10,000,000<br />
2030<br />
-<br />
7,544,239 18,344,576 20,000,000 45,888,815 10,000,000<br />
2031<br />
-<br />
7,544,239 18,344,576 20,000,000 45,888,815 10,000,000<br />
2032<br />
-<br />
7,544,239 18,344,576 20,000,000 45,888,815 10,000,000<br />
2033<br />
-<br />
7,544,239 18,344,576 20,000,000 45,888,815 10,000,000<br />
2034<br />
-<br />
7,544,239 18,344,576 20,000,000 45,888,815 10,000,000<br />
2035<br />
-<br />
7,544,239 18,344,576 20,000,000 45,888,815 10,000,000<br />
2036<br />
-<br />
7,544,239 18,344,576 20,000,000 45,888,815 10,000,000<br />
2037<br />
-<br />
7,544,239 18,344,576 20,000,000 45,888,815 10,000,000<br />
2038<br />
-<br />
7,544,239 18,344,576 20,000,000 45,888,815 10,000,000<br />
-<br />
7,544,239 18,344,576 20,000,000 45,888,815 10,000,000<br />
Appendix 3 – Derivation of Unit Reference Values for Potential <strong>Interventions</strong> June 2012
Water Reconciliation Strategy Study for the Large Bulk Water Supply Systems: Greater Bloemfontein Area 4<br />
2039<br />
2040<br />
2041<br />
2042<br />
2043<br />
2044<br />
2045<br />
2046<br />
2047<br />
2048<br />
2049<br />
2050<br />
2051<br />
2052<br />
2053<br />
2054<br />
2055<br />
2056<br />
2057<br />
2058<br />
2059<br />
2060<br />
2061<br />
NPV<br />
(4%)<br />
NPV<br />
(6%)<br />
NPV<br />
(8%)<br />
-<br />
-<br />
-<br />
-<br />
-<br />
-<br />
-<br />
-<br />
-<br />
-<br />
-<br />
-<br />
-<br />
-<br />
-<br />
-<br />
-<br />
-<br />
-<br />
-<br />
-<br />
-<br />
-<br />
7,544,239<br />
7,544,239<br />
7,544,239<br />
7,544,239<br />
7,544,239<br />
7,544,239<br />
7,544,239<br />
7,544,239<br />
7,544,239<br />
7,544,239<br />
7,544,239<br />
7,544,239<br />
7,544,239<br />
7,544,239<br />
7,544,239<br />
7,544,239<br />
7,544,239<br />
7,544,239<br />
7,544,239<br />
7,544,239<br />
7,544,239<br />
7,544,239<br />
7,544,239<br />
18,344,576<br />
18,344,576<br />
18,344,576<br />
18,344,576<br />
18,344,576<br />
18,344,576<br />
18,344,576<br />
18,344,576<br />
18,344,576<br />
18,344,576<br />
18,344,576<br />
18,344,576<br />
18,344,576<br />
18,344,576<br />
18,344,576<br />
18,344,576<br />
18,344,576<br />
18,344,576<br />
18,344,576<br />
18,344,576<br />
18,344,576<br />
18,344,576<br />
18,344,576<br />
20,000,000<br />
20,000,000<br />
20,000,000<br />
20,000,000<br />
20,000,000<br />
20,000,000<br />
20,000,000<br />
20,000,000<br />
20,000,000<br />
20,000,000<br />
20,000,000<br />
20,000,000<br />
20,000,000<br />
20,000,000<br />
20,000,000<br />
20,000,000<br />
20,000,000<br />
20,000,000<br />
20,000,000<br />
20,000,000<br />
20,000,000<br />
20,000,000<br />
20,000,000<br />
45,888,815<br />
45,888,815<br />
45,888,815<br />
45,888,815<br />
45,888,815<br />
45,888,815<br />
45,888,815<br />
45,888,815<br />
45,888,815<br />
45,888,815<br />
45,888,815<br />
45,888,815<br />
45,888,815<br />
45,888,815<br />
45,888,815<br />
45,888,815<br />
45,888,815<br />
45,888,815<br />
45,888,815<br />
45,888,815<br />
45,888,815<br />
45,888,815<br />
45,888,815<br />
1,847,572,581<br />
1,561,030,641<br />
1,376,247,130<br />
10,000,000<br />
10,000,000<br />
10,000,000<br />
10,000,000<br />
10,000,000<br />
10,000,000<br />
10,000,000<br />
10,000,000<br />
10,000,000<br />
10,000,000<br />
10,000,000<br />
10,000,000<br />
10,000,000<br />
10,000,000<br />
10,000,000<br />
10,000,000<br />
10,000,000<br />
10,000,000<br />
10,000,000<br />
10,000,000<br />
10,000,000<br />
10,000,000<br />
10,000,000<br />
195,960,899<br />
139,284,680<br />
104,502,199<br />
Appendix 3 – Derivation of Unit Reference Values for Potential <strong>Interventions</strong> June 2012<br />
9.43<br />
11.21<br />
13.17
Water Reconciliation Strategy Study for the Large Bulk Water Supply Systems: Greater Bloemfontein Area 5<br />
C3. Utilising surplus capacity in the Orange River by pumping to Knellpoort Dam from<br />
Bosberg/Boskraai Dam<br />
Year Capital O&M Electricty Orange<br />
River<br />
2012<br />
2013<br />
2014<br />
2015<br />
2016<br />
2017<br />
2018<br />
2019<br />
2020<br />
2021<br />
2022<br />
2023<br />
2024<br />
2025<br />
2026<br />
2027<br />
2028<br />
2029<br />
2030<br />
2031<br />
2032<br />
2033<br />
2034<br />
2035<br />
2036<br />
2037<br />
2038<br />
374,610,136<br />
187,305,068<br />
187,305,068<br />
-<br />
-<br />
-<br />
-<br />
-<br />
-<br />
-<br />
-<br />
-<br />
-<br />
-<br />
-<br />
-<br />
-<br />
-<br />
-<br />
-<br />
-<br />
-<br />
-<br />
-<br />
-<br />
-<br />
-<br />
-<br />
3,245,264<br />
-<br />
-<br />
3,245,264<br />
3,245,264<br />
3,245,264<br />
3,245,264<br />
3,245,264<br />
3,245,264<br />
3,245,264<br />
3,245,264<br />
3,245,264<br />
3,245,264<br />
3,245,264<br />
3,245,264<br />
3,245,264<br />
3,245,264<br />
3,245,264<br />
3,245,264<br />
3,245,264<br />
3,245,264<br />
3,245,264<br />
3,245,264<br />
3,245,264<br />
3,245,264<br />
3,245,264<br />
3,245,264<br />
3,245,264<br />
7,393,016<br />
-<br />
-<br />
8,783,643<br />
9,574,170<br />
9,574,170<br />
9,574,170<br />
9,574,170<br />
9,574,170<br />
9,574,170<br />
9,574,170<br />
9,574,170<br />
9,574,170<br />
9,574,170<br />
9,574,170<br />
9,574,170<br />
9,574,170<br />
9,574,170<br />
9,574,170<br />
9,574,170<br />
9,574,170<br />
9,574,170<br />
9,574,170<br />
9,574,170<br />
9,574,170<br />
9,574,170<br />
9,574,170<br />
9,574,170<br />
20,000,000<br />
-<br />
-<br />
20,000,000<br />
20,000,000<br />
20,000,000<br />
20,000,000<br />
20,000,000<br />
20,000,000<br />
20,000,000<br />
20,000,000<br />
20,000,000<br />
20,000,000<br />
20,000,000<br />
20,000,000<br />
20,000,000<br />
20,000,000<br />
20,000,000<br />
20,000,000<br />
20,000,000<br />
20,000,000<br />
20,000,000<br />
20,000,000<br />
20,000,000<br />
20,000,000<br />
20,000,000<br />
20,000,000<br />
20,000,000<br />
Total Annual Yield URV<br />
187,305,068<br />
187,305,068<br />
32,028,907<br />
32,819,434<br />
32,819,434<br />
32,819,434<br />
32,819,434<br />
32,819,434<br />
32,819,434<br />
32,819,434<br />
32,819,434<br />
32,819,434<br />
32,819,434<br />
32,819,434<br />
32,819,434<br />
32,819,434<br />
32,819,434<br />
32,819,434<br />
32,819,434<br />
32,819,434<br />
32,819,434<br />
32,819,434<br />
32,819,434<br />
32,819,434<br />
32,819,434<br />
32,819,434<br />
32,819,434<br />
10000000<br />
Appendix 3 – Derivation of Unit Reference Values for Potential <strong>Interventions</strong> June 2012<br />
-<br />
-<br />
10,000,000<br />
10,000,000<br />
10,000,000<br />
10,000,000<br />
10,000,000<br />
10,000,000<br />
10,000,000<br />
10,000,000<br />
10,000,000<br />
10,000,000<br />
10,000,000<br />
10,000,000<br />
10,000,000<br />
10,000,000<br />
10,000,000<br />
10,000,000<br />
10,000,000<br />
10,000,000<br />
10,000,000<br />
10,000,000<br />
10,000,000<br />
10,000,000<br />
10,000,000<br />
10,000,000<br />
10,000,000
Water Reconciliation Strategy Study for the Large Bulk Water Supply Systems: Greater Bloemfontein Area 6<br />
2039<br />
2040<br />
2041<br />
2042<br />
2043<br />
2044<br />
2045<br />
2046<br />
2047<br />
2048<br />
2049<br />
2050<br />
2051<br />
2052<br />
2053<br />
2054<br />
2055<br />
2056<br />
2057<br />
2058<br />
2059<br />
2060<br />
2061<br />
NPV<br />
(4%)<br />
NPV<br />
(6%)<br />
NPV<br />
(8%)<br />
-<br />
-<br />
-<br />
-<br />
-<br />
-<br />
-<br />
-<br />
-<br />
-<br />
-<br />
-<br />
-<br />
-<br />
-<br />
-<br />
-<br />
-<br />
-<br />
-<br />
-<br />
-<br />
-<br />
3,245,264<br />
3,245,264<br />
3,245,264<br />
3,245,264<br />
3,245,264<br />
3,245,264<br />
3,245,264<br />
3,245,264<br />
3,245,264<br />
3,245,264<br />
3,245,264<br />
3,245,264<br />
3,245,264<br />
3,245,264<br />
3,245,264<br />
3,245,264<br />
3,245,264<br />
3,245,264<br />
3,245,264<br />
3,245,264<br />
3,245,264<br />
3,245,264<br />
3,245,264<br />
9,574,170<br />
9,574,170<br />
9,574,170<br />
9,574,170<br />
9,574,170<br />
9,574,170<br />
9,574,170<br />
9,574,170<br />
9,574,170<br />
9,574,170<br />
9,574,170<br />
9,574,170<br />
9,574,170<br />
9,574,170<br />
9,574,170<br />
9,574,170<br />
9,574,170<br />
9,574,170<br />
9,574,170<br />
9,574,170<br />
9,574,170<br />
9,574,170<br />
9,574,170<br />
20,000,000<br />
20,000,000<br />
20,000,000<br />
20,000,000<br />
20,000,000<br />
20,000,000<br />
20,000,000<br />
20,000,000<br />
20,000,000<br />
20,000,000<br />
20,000,000<br />
20,000,000<br />
20,000,000<br />
20,000,000<br />
20,000,000<br />
20,000,000<br />
20,000,000<br />
20,000,000<br />
20,000,000<br />
20,000,000<br />
20,000,000<br />
20,000,000<br />
20,000,000<br />
32,819,434<br />
32,819,434<br />
32,819,434<br />
32,819,434<br />
32,819,434<br />
32,819,434<br />
32,819,434<br />
32,819,434<br />
32,819,434<br />
32,819,434<br />
32,819,434<br />
32,819,434<br />
32,819,434<br />
32,819,434<br />
32,819,434<br />
32,819,434<br />
32,819,434<br />
32,819,434<br />
32,819,434<br />
32,819,434<br />
32,819,434<br />
32,819,434<br />
32,819,434<br />
995,704,904<br />
799,864,437<br />
676,357,285<br />
10,000,000<br />
10,000,000<br />
10,000,000<br />
10,000,000<br />
10,000,000<br />
10,000,000<br />
10,000,000<br />
10,000,000<br />
10,000,000<br />
10,000,000<br />
10,000,000<br />
10,000,000<br />
10,000,000<br />
10,000,000<br />
10,000,000<br />
10,000,000<br />
10,000,000<br />
10,000,000<br />
10,000,000<br />
10,000,000<br />
10,000,000<br />
10,000,000<br />
10,000,000<br />
195,960,899<br />
139,284,680<br />
104,502,199<br />
Appendix 3 – Derivation of Unit Reference Values for Potential <strong>Interventions</strong> June 2012<br />
5.08<br />
5.74<br />
6.47
Water Reconciliation Strategy Study for the Large Bulk Water Supply Systems: Greater Bloemfontein Area 7<br />
C5a. Pumping from Welbedacht Dam to Knellpoort Dam<br />
Year Capital O&M Electricty Orange<br />
River<br />
2012<br />
2013<br />
2014<br />
2015<br />
2016<br />
2017<br />
2018<br />
2019<br />
2020<br />
2021<br />
2022<br />
2023<br />
2024<br />
2025<br />
2026<br />
2027<br />
2028<br />
2029<br />
2030<br />
2031<br />
2032<br />
2033<br />
2034<br />
2035<br />
2036<br />
2037<br />
2038<br />
374,314,363<br />
187,157,182<br />
187,157,182<br />
-<br />
-<br />
-<br />
-<br />
-<br />
-<br />
-<br />
-<br />
-<br />
-<br />
-<br />
-<br />
-<br />
-<br />
-<br />
-<br />
-<br />
-<br />
-<br />
-<br />
-<br />
-<br />
-<br />
-<br />
-<br />
2,770,101<br />
-<br />
-<br />
2,770,101<br />
2,770,101<br />
2,770,101<br />
2,770,101<br />
2,770,101<br />
2,770,101<br />
2,770,101<br />
2,770,101<br />
2,770,101<br />
2,770,101<br />
2,770,101<br />
2,770,101<br />
2,770,101<br />
2,770,101<br />
2,770,101<br />
2,770,101<br />
2,770,101<br />
2,770,101<br />
2,770,101<br />
2,770,101<br />
2,770,101<br />
2,770,101<br />
2,770,101<br />
2,770,101<br />
2,770,101<br />
5,140,129<br />
-<br />
-<br />
6,106,987<br />
6,656,616<br />
6,656,616<br />
6,656,616<br />
6,656,616<br />
6,656,616<br />
6,656,616<br />
6,656,616<br />
6,656,616<br />
6,656,616<br />
6,656,616<br />
6,656,616<br />
6,656,616<br />
6,656,616<br />
6,656,616<br />
6,656,616<br />
6,656,616<br />
6,656,616<br />
6,656,616<br />
6,656,616<br />
6,656,616<br />
6,656,616<br />
6,656,616<br />
6,656,616<br />
6,656,616<br />
Total Annual Yield URV<br />
Appendix 3 – Derivation of Unit Reference Values for Potential <strong>Interventions</strong> June 2012<br />
-<br />
-<br />
-<br />
-<br />
-<br />
-<br />
-<br />
-<br />
-<br />
-<br />
-<br />
-<br />
-<br />
-<br />
-<br />
-<br />
-<br />
-<br />
-<br />
-<br />
-<br />
-<br />
-<br />
-<br />
-<br />
-<br />
-<br />
-<br />
187,157,182<br />
187,157,182<br />
8,877,088<br />
9,426,717<br />
9,426,717<br />
9,426,717<br />
9,426,717<br />
9,426,717<br />
9,426,717<br />
9,426,717<br />
9,426,717<br />
9,426,717<br />
9,426,717<br />
9,426,717<br />
9,426,717<br />
9,426,717<br />
9,426,717<br />
9,426,717<br />
9,426,717<br />
9,426,717<br />
9,426,717<br />
9,426,717<br />
9,426,717<br />
9,426,717<br />
9,426,717<br />
9,426,717<br />
9,426,717<br />
20000000<br />
-<br />
-<br />
20,000,000<br />
20,000,000<br />
20,000,000<br />
20,000,000<br />
20,000,000<br />
20,000,000<br />
20,000,000<br />
20,000,000<br />
20,000,000<br />
20,000,000<br />
20,000,000<br />
20,000,000<br />
20,000,000<br />
20,000,000<br />
20,000,000<br />
20,000,000<br />
20,000,000<br />
20,000,000<br />
20,000,000<br />
20,000,000<br />
20,000,000<br />
20,000,000<br />
20,000,000<br />
20,000,000<br />
20,000,000
Water Reconciliation Strategy Study for the Large Bulk Water Supply Systems: Greater Bloemfontein Area 8<br />
2039<br />
2040<br />
2041<br />
2042<br />
2043<br />
2044<br />
2045<br />
2046<br />
2047<br />
2048<br />
2049<br />
2050<br />
2051<br />
2052<br />
2053<br />
2054<br />
2055<br />
2056<br />
2057<br />
2058<br />
2059<br />
2060<br />
2061<br />
NPV<br />
(4%)<br />
NPV<br />
(6%)<br />
NPV<br />
(8%)<br />
-<br />
-<br />
-<br />
-<br />
-<br />
-<br />
-<br />
-<br />
-<br />
-<br />
-<br />
-<br />
-<br />
-<br />
-<br />
-<br />
-<br />
-<br />
-<br />
-<br />
-<br />
-<br />
-<br />
2,770,101<br />
2,770,101<br />
2,770,101<br />
2,770,101<br />
2,770,101<br />
2,770,101<br />
2,770,101<br />
2,770,101<br />
2,770,101<br />
2,770,101<br />
2,770,101<br />
2,770,101<br />
2,770,101<br />
2,770,101<br />
2,770,101<br />
2,770,101<br />
2,770,101<br />
2,770,101<br />
2,770,101<br />
2,770,101<br />
2,770,101<br />
2,770,101<br />
2,770,101<br />
6,656,616<br />
6,656,616<br />
6,656,616<br />
6,656,616<br />
6,656,616<br />
6,656,616<br />
6,656,616<br />
6,656,616<br />
6,656,616<br />
6,656,616<br />
6,656,616<br />
6,656,616<br />
6,656,616<br />
6,656,616<br />
6,656,616<br />
6,656,616<br />
6,656,616<br />
6,656,616<br />
6,656,616<br />
6,656,616<br />
6,656,616<br />
6,656,616<br />
6,656,616<br />
Appendix 3 – Derivation of Unit Reference Values for Potential <strong>Interventions</strong> June 2012<br />
-<br />
-<br />
-<br />
-<br />
-<br />
-<br />
-<br />
-<br />
-<br />
-<br />
-<br />
-<br />
-<br />
-<br />
-<br />
-<br />
-<br />
-<br />
-<br />
-<br />
-<br />
-<br />
-<br />
9,426,717<br />
9,426,717<br />
9,426,717<br />
9,426,717<br />
9,426,717<br />
9,426,717<br />
9,426,717<br />
9,426,717<br />
9,426,717<br />
9,426,717<br />
9,426,717<br />
9,426,717<br />
9,426,717<br />
9,426,717<br />
9,426,717<br />
9,426,717<br />
9,426,717<br />
9,426,717<br />
9,426,717<br />
9,426,717<br />
9,426,717<br />
9,426,717<br />
9,426,717<br />
537,234,340<br />
473,970,851<br />
431,825,757<br />
20,000,000<br />
20,000,000<br />
20,000,000<br />
20,000,000<br />
20,000,000<br />
20,000,000<br />
20,000,000<br />
20,000,000<br />
20,000,000<br />
20,000,000<br />
20,000,000<br />
20,000,000<br />
20,000,000<br />
20,000,000<br />
20,000,000<br />
20,000,000<br />
20,000,000<br />
20,000,000<br />
20,000,000<br />
20,000,000<br />
20,000,000<br />
20,000,000<br />
20,000,000<br />
391,921,799<br />
278,569,359<br />
209,004,398<br />
1.37<br />
1.70<br />
2.07
Water Reconciliation Strategy Study for the Large Bulk Water Supply Systems: Greater Bloemfontein Area 9<br />
C5b. Bi-direction pipeline between Knellpoort Dam and Webedacht WTW<br />
Year Capital O&M Electricty Orange<br />
River<br />
2012<br />
2013<br />
2014<br />
2015<br />
2016<br />
2017<br />
2018<br />
2019<br />
2020<br />
2021<br />
2022<br />
2023<br />
2024<br />
2025<br />
2026<br />
2027<br />
2028<br />
2029<br />
2030<br />
2031<br />
2032<br />
2033<br />
2034<br />
2035<br />
2036<br />
2037<br />
2038<br />
374,314,363<br />
187,157,182<br />
187,157,182<br />
-<br />
-<br />
-<br />
-<br />
-<br />
-<br />
-<br />
-<br />
-<br />
-<br />
-<br />
-<br />
-<br />
-<br />
-<br />
-<br />
-<br />
-<br />
-<br />
-<br />
-<br />
-<br />
-<br />
-<br />
-<br />
2,770,101<br />
-<br />
-<br />
2,770,101<br />
2,770,101<br />
2,770,101<br />
2,770,101<br />
2,770,101<br />
2,770,101<br />
2,770,101<br />
2,770,101<br />
2,770,101<br />
2,770,101<br />
2,770,101<br />
2,770,101<br />
2,770,101<br />
2,770,101<br />
2,770,101<br />
2,770,101<br />
2,770,101<br />
2,770,101<br />
2,770,101<br />
2,770,101<br />
2,770,101<br />
2,770,101<br />
2,770,101<br />
2,770,101<br />
2,770,101<br />
3,337,906<br />
-<br />
-<br />
3,965,766<br />
4,322,685<br />
4,322,685<br />
4,322,685<br />
4,322,685<br />
4,322,685<br />
4,322,685<br />
4,322,685<br />
4,322,685<br />
4,322,685<br />
4,322,685<br />
4,322,685<br />
4,322,685<br />
4,322,685<br />
4,322,685<br />
4,322,685<br />
4,322,685<br />
4,322,685<br />
4,322,685<br />
4,322,685<br />
4,322,685<br />
4,322,685<br />
4,322,685<br />
4,322,685<br />
4,322,685<br />
Total Annual Yield URV<br />
Appendix 3 – Derivation of Unit Reference Values for Potential <strong>Interventions</strong> June 2012<br />
-<br />
-<br />
-<br />
-<br />
-<br />
-<br />
-<br />
-<br />
-<br />
-<br />
-<br />
-<br />
-<br />
-<br />
-<br />
-<br />
-<br />
-<br />
-<br />
-<br />
-<br />
-<br />
-<br />
-<br />
-<br />
-<br />
-<br />
-<br />
187,157,182<br />
187,157,182<br />
6,735,867<br />
7,092,786<br />
7,092,786<br />
7,092,786<br />
7,092,786<br />
7,092,786<br />
7,092,786<br />
7,092,786<br />
7,092,786<br />
7,092,786<br />
7,092,786<br />
7,092,786<br />
7,092,786<br />
7,092,786<br />
7,092,786<br />
7,092,786<br />
7,092,786<br />
7,092,786<br />
7,092,786<br />
7,092,786<br />
7,092,786<br />
7,092,786<br />
7,092,786<br />
7,092,786<br />
7,092,786<br />
27000000<br />
-<br />
-<br />
27,000,000<br />
27,000,000<br />
27,000,000<br />
27,000,000<br />
27,000,000<br />
27,000,000<br />
27,000,000<br />
27,000,000<br />
27,000,000<br />
27,000,000<br />
27,000,000<br />
27,000,000<br />
27,000,000<br />
27,000,000<br />
27,000,000<br />
27,000,000<br />
27,000,000<br />
27,000,000<br />
27,000,000<br />
27,000,000<br />
27,000,000<br />
27,000,000<br />
27,000,000<br />
27,000,000<br />
27,000,000
Water Reconciliation Strategy Study for the Large Bulk Water Supply Systems: Greater Bloemfontein Area 10<br />
2039<br />
2040<br />
2041<br />
2042<br />
2043<br />
2044<br />
2045<br />
2046<br />
2047<br />
2048<br />
2049<br />
2050<br />
2051<br />
2052<br />
2053<br />
2054<br />
2055<br />
2056<br />
2057<br />
2058<br />
2059<br />
2060<br />
2061<br />
NPV<br />
(4%)<br />
NPV<br />
(6%)<br />
NPV<br />
(8%)<br />
-<br />
-<br />
-<br />
-<br />
-<br />
-<br />
-<br />
-<br />
-<br />
-<br />
-<br />
-<br />
-<br />
-<br />
-<br />
-<br />
-<br />
-<br />
-<br />
-<br />
-<br />
-<br />
-<br />
2,770,101<br />
2,770,101<br />
2,770,101<br />
2,770,101<br />
2,770,101<br />
2,770,101<br />
2,770,101<br />
2,770,101<br />
2,770,101<br />
2,770,101<br />
2,770,101<br />
2,770,101<br />
2,770,101<br />
2,770,101<br />
2,770,101<br />
2,770,101<br />
2,770,101<br />
2,770,101<br />
2,770,101<br />
2,770,101<br />
2,770,101<br />
2,770,101<br />
2,770,101<br />
4,322,685<br />
4,322,685<br />
4,322,685<br />
4,322,685<br />
4,322,685<br />
4,322,685<br />
4,322,685<br />
4,322,685<br />
4,322,685<br />
4,322,685<br />
4,322,685<br />
4,322,685<br />
4,322,685<br />
4,322,685<br />
4,322,685<br />
4,322,685<br />
4,322,685<br />
4,322,685<br />
4,322,685<br />
4,322,685<br />
4,322,685<br />
4,322,685<br />
4,322,685<br />
Appendix 3 – Derivation of Unit Reference Values for Potential <strong>Interventions</strong> June 2012<br />
-<br />
-<br />
-<br />
-<br />
-<br />
-<br />
-<br />
-<br />
-<br />
-<br />
-<br />
-<br />
-<br />
-<br />
-<br />
-<br />
-<br />
-<br />
-<br />
-<br />
-<br />
-<br />
-<br />
7,092,786<br />
7,092,786<br />
7,092,786<br />
7,092,786<br />
7,092,786<br />
7,092,786<br />
7,092,786<br />
7,092,786<br />
7,092,786<br />
7,092,786<br />
7,092,786<br />
7,092,786<br />
7,092,786<br />
7,092,786<br />
7,092,786<br />
7,092,786<br />
7,092,786<br />
7,092,786<br />
7,092,786<br />
7,092,786<br />
7,092,786<br />
7,092,786<br />
7,092,786<br />
491,669,742<br />
441,624,575<br />
407,588,646<br />
27,000,000<br />
27,000,000<br />
27,000,000<br />
27,000,000<br />
27,000,000<br />
27,000,000<br />
27,000,000<br />
27,000,000<br />
27,000,000<br />
27,000,000<br />
27,000,000<br />
27,000,000<br />
27,000,000<br />
27,000,000<br />
27,000,000<br />
27,000,000<br />
27,000,000<br />
27,000,000<br />
27,000,000<br />
27,000,000<br />
27,000,000<br />
27,000,000<br />
27,000,000<br />
529,094,428<br />
376,068,635<br />
282,155,937<br />
0.93<br />
1.17<br />
1.44
Water Reconciliation Strategy Study for the Large Bulk Water Supply Systems: Greater Bloemfontein Area 11<br />
C6. Transfer of Water from Polihali Dam<br />
Year Yield (m 3 /a) Capital O&M<br />
10,000,000 R0 R38,000,000<br />
1 2010 0.00 R0 0<br />
2 2011 0.00 R0 0<br />
3 2012 10,000,000 R0 R38,000,000<br />
4 2013 10,000,000 R0 R38,000,000<br />
5 2014 10,000,000 R0 R38,000,000<br />
6 2015 10,000,000 R0 R38,000,000<br />
7 2016 10,000,000 R0 R38,000,000<br />
8 2017 10,000,000 R0 R38,000,000<br />
9 2018 10,000,000 R0 R38,000,000<br />
10 2019 10,000,000 R0 R38,000,000<br />
11 2020 10,000,000 R0 R38,000,000<br />
12 2021 10,000,000 R0 R38,000,000<br />
13 2022 10,000,000 R0 R38,000,000<br />
14 2023 10,000,000 R0 R38,000,000<br />
15 2024 10,000,000 R0 R38,000,000<br />
16 2025 10,000,000 R0 R38,000,000<br />
17 2026 10,000,000 R0 R38,000,000<br />
18 2027 10,000,000 R0 R38,000,000<br />
19 2028 10,000,000 R0 R38,000,000<br />
20 2029 10,000,000 R0 R38,000,000<br />
21 2030 10,000,000 R0 R38,000,000<br />
22 2031 10,000,000 R0 R38,000,000<br />
23 2032 10,000,000 R0 R38,000,000<br />
24 2033 10,000,000 R0 R38,000,000<br />
25 2034 10,000,000 R0 R38,000,000<br />
26 2035 10,000,000 R0 R38,000,000<br />
27 2036 10,000,000 R0 R38,000,000<br />
28 2037 10,000,000 R0 R38,000,000<br />
29 2038 10,000,000 R0 R38,000,000<br />
30 2039 10,000,000 R0 R38,000,000<br />
31 2040 10,000,000 R0 R38,000,000<br />
32 2041 10,000,000 R0 R38,000,000<br />
33 2042 10,000,000 R0 R38,000,000<br />
34 2043 10,000,000 R0 R38,000,000<br />
35 2044 10,000,000 R0 R38,000,000<br />
Appendix 3 – Derivation of Unit Reference Values for Potential <strong>Interventions</strong> June 2012
Water Reconciliation Strategy Study for the Large Bulk Water Supply Systems: Greater Bloemfontein Area 12<br />
36 2045 10,000,000 R0 R38,000,000<br />
37 2046 10,000,000 R0 R38,000,000<br />
38 2047 10,000,000 R0 R38,000,000<br />
39 2048 10,000,000 R0 R38,000,000<br />
40 2049 10,000,000 R0 R38,000,000<br />
41 2050 10,000,000 R0 R38,000,000<br />
42 2051 10,000,000 R0 R38,000,000<br />
43 2052 10,000,000 R0 R38,000,000<br />
44 2053 10,000,000 R0 R38,000,000<br />
45 2054 10,000,000 R0 R38,000,000<br />
46 2055 10,000,000 R0 R38,000,000<br />
47 2056 10,000,000 R0 R38,000,000<br />
48 2057 10,000,000 R0 R38,000,000<br />
49 2058 10,000,000 R0 R38,000,000<br />
50 2059 10,000,000 R0 R38,000,000<br />
NPV NPV NPV URV<br />
4% 195,960,899 - 744,651,418 3.80<br />
6% 139,284,680 - 529,281,783 3.80<br />
8% 104,502,199 - 397,108,356 3.80<br />
Appendix 3 – Derivation of Unit Reference Values for Potential <strong>Interventions</strong> June 2012
Water Reconciliation Strategy Study for the Large Bulk Water Supply Systems: Greater Bloemfontein Area 13<br />
D1. Planned direct re-use - New North Eastern<br />
Year Capital O&M Electricty Orange<br />
River<br />
2012<br />
2013<br />
2014<br />
2015<br />
2016<br />
2017<br />
2018<br />
2019<br />
2020<br />
2021<br />
2022<br />
2023<br />
2024<br />
2025<br />
2026<br />
2027<br />
2028<br />
2029<br />
2030<br />
2031<br />
2032<br />
2033<br />
2034<br />
2035<br />
2036<br />
2037<br />
2038<br />
211,973,224<br />
105,986,612<br />
105,986,612<br />
-<br />
-<br />
-<br />
-<br />
-<br />
-<br />
-<br />
-<br />
-<br />
-<br />
-<br />
-<br />
-<br />
-<br />
-<br />
-<br />
-<br />
-<br />
-<br />
-<br />
-<br />
-<br />
-<br />
-<br />
-<br />
3,874,392<br />
-<br />
-<br />
3,874,392<br />
3,874,392<br />
3,874,392<br />
3,874,392<br />
3,874,392<br />
3,874,392<br />
3,874,392<br />
3,874,392<br />
3,874,392<br />
3,874,392<br />
3,874,392<br />
3,874,392<br />
3,874,392<br />
3,874,392<br />
3,874,392<br />
3,874,392<br />
3,874,392<br />
3,874,392<br />
3,874,392<br />
3,874,392<br />
3,874,392<br />
3,874,392<br />
3,874,392<br />
3,874,392<br />
3,874,392<br />
7,754,388<br />
-<br />
-<br />
9,212,989<br />
10,042,158<br />
10,042,158<br />
10,042,158<br />
10,042,158<br />
10,042,158<br />
10,042,158<br />
10,042,158<br />
10,042,158<br />
10,042,158<br />
10,042,158<br />
10,042,158<br />
10,042,158<br />
10,042,158<br />
10,042,158<br />
10,042,158<br />
10,042,158<br />
10,042,158<br />
10,042,158<br />
10,042,158<br />
10,042,158<br />
10,042,158<br />
10,042,158<br />
10,042,158<br />
10,042,158<br />
Total Annual Yield URV<br />
Appendix 3 – Derivation of Unit Reference Values for Potential <strong>Interventions</strong> June 2012<br />
-<br />
-<br />
-<br />
-<br />
-<br />
-<br />
-<br />
-<br />
-<br />
-<br />
-<br />
-<br />
-<br />
-<br />
-<br />
-<br />
-<br />
-<br />
-<br />
-<br />
-<br />
-<br />
-<br />
-<br />
-<br />
-<br />
-<br />
-<br />
105,986,612<br />
105,986,612<br />
13,087,381<br />
13,916,550<br />
13,916,550<br />
13,916,550<br />
13,916,550<br />
13,916,550<br />
13,916,550<br />
13,916,550<br />
13,916,550<br />
13,916,550<br />
13,916,550<br />
13,916,550<br />
13,916,550<br />
13,916,550<br />
13,916,550<br />
13,916,550<br />
13,916,550<br />
13,916,550<br />
13,916,550<br />
13,916,550<br />
13,916,550<br />
13,916,550<br />
13,916,550<br />
13,916,550<br />
13,916,550<br />
10950000<br />
-<br />
-<br />
10,950,000<br />
10,950,000<br />
10,950,000<br />
10,950,000<br />
10,950,000<br />
10,950,000<br />
10,950,000<br />
10,950,000<br />
10,950,000<br />
10,950,000<br />
10,950,000<br />
10,950,000<br />
10,950,000<br />
10,950,000<br />
10,950,000<br />
10,950,000<br />
10,950,000<br />
10,950,000<br />
10,950,000<br />
10,950,000<br />
10,950,000<br />
10,950,000<br />
10,950,000<br />
10,950,000<br />
10,950,000
Water Reconciliation Strategy Study for the Large Bulk Water Supply Systems: Greater Bloemfontein Area 14<br />
2039<br />
2040<br />
2041<br />
2042<br />
2043<br />
2044<br />
2045<br />
2046<br />
2047<br />
2048<br />
2049<br />
2050<br />
2051<br />
2052<br />
2053<br />
2054<br />
2055<br />
2056<br />
2057<br />
2058<br />
2059<br />
2060<br />
2061<br />
NPV<br />
(4%)<br />
NPV<br />
(6%)<br />
NPV<br />
(8%)<br />
-<br />
-<br />
-<br />
-<br />
-<br />
-<br />
-<br />
-<br />
-<br />
-<br />
-<br />
-<br />
-<br />
-<br />
-<br />
-<br />
-<br />
-<br />
-<br />
-<br />
-<br />
-<br />
-<br />
3,874,392<br />
3,874,392<br />
3,874,392<br />
3,874,392<br />
3,874,392<br />
3,874,392<br />
3,874,392<br />
3,874,392<br />
3,874,392<br />
3,874,392<br />
3,874,392<br />
3,874,392<br />
3,874,392<br />
3,874,392<br />
3,874,392<br />
3,874,392<br />
3,874,392<br />
3,874,392<br />
3,874,392<br />
3,874,392<br />
3,874,392<br />
3,874,392<br />
3,874,392<br />
10,042,158<br />
10,042,158<br />
10,042,158<br />
10,042,158<br />
10,042,158<br />
10,042,158<br />
10,042,158<br />
10,042,158<br />
10,042,158<br />
10,042,158<br />
10,042,158<br />
10,042,158<br />
10,042,158<br />
10,042,158<br />
10,042,158<br />
10,042,158<br />
10,042,158<br />
10,042,158<br />
10,042,158<br />
10,042,158<br />
10,042,158<br />
10,042,158<br />
10,042,158<br />
Appendix 3 – Derivation of Unit Reference Values for Potential <strong>Interventions</strong> June 2012<br />
-<br />
-<br />
-<br />
-<br />
-<br />
-<br />
-<br />
-<br />
-<br />
-<br />
-<br />
-<br />
-<br />
-<br />
-<br />
-<br />
-<br />
-<br />
-<br />
-<br />
-<br />
-<br />
-<br />
13,916,550<br />
13,916,550<br />
13,916,550<br />
13,916,550<br />
13,916,550<br />
13,916,550<br />
13,916,550<br />
13,916,550<br />
13,916,550<br />
13,916,550<br />
13,916,550<br />
13,916,550<br />
13,916,550<br />
13,916,550<br />
13,916,550<br />
13,916,550<br />
13,916,550<br />
13,916,550<br />
13,916,550<br />
13,916,550<br />
13,916,550<br />
13,916,550<br />
13,916,550<br />
471,873,619<br />
387,455,110<br />
333,774,974<br />
10,950,000<br />
10,950,000<br />
10,950,000<br />
10,950,000<br />
10,950,000<br />
10,950,000<br />
10,950,000<br />
10,950,000<br />
10,950,000<br />
10,950,000<br />
10,950,000<br />
10,950,000<br />
10,950,000<br />
10,950,000<br />
10,950,000<br />
10,950,000<br />
10,950,000<br />
10,950,000<br />
10,950,000<br />
10,950,000<br />
10,950,000<br />
10,950,000<br />
10,950,000<br />
214,577,185<br />
152,516,724<br />
114,429,908<br />
2.20<br />
2.54<br />
2.92
Water Reconciliation Strategy Study for the Large Bulk Water Supply Systems: Greater Bloemfontein Area 15<br />
D2. Planned Indirect Re-use - Transfer to upstream of Mockes Dam<br />
Year Capital O&M Electricty Orange<br />
River<br />
2012<br />
2013<br />
2014<br />
2015<br />
2016<br />
2017<br />
2018<br />
2019<br />
2020<br />
2021<br />
2022<br />
2023<br />
2024<br />
2025<br />
2026<br />
2027<br />
2028<br />
2029<br />
2030<br />
2031<br />
2032<br />
2033<br />
2034<br />
2035<br />
2036<br />
2037<br />
2038<br />
289,301,870<br />
144,650,935<br />
144,650,935<br />
-<br />
-<br />
-<br />
-<br />
-<br />
-<br />
-<br />
-<br />
-<br />
-<br />
-<br />
-<br />
-<br />
-<br />
-<br />
-<br />
-<br />
-<br />
-<br />
-<br />
-<br />
-<br />
-<br />
-<br />
-<br />
2,805,528<br />
-<br />
-<br />
2,805,528<br />
2,805,528<br />
2,805,528<br />
2,805,528<br />
2,805,528<br />
2,805,528<br />
2,805,528<br />
2,805,528<br />
2,805,528<br />
2,805,528<br />
2,805,528<br />
2,805,528<br />
2,805,528<br />
2,805,528<br />
2,805,528<br />
2,805,528<br />
2,805,528<br />
2,805,528<br />
2,805,528<br />
2,805,528<br />
2,805,528<br />
2,805,528<br />
2,805,528<br />
2,805,528<br />
2,805,528<br />
1,088,923<br />
-<br />
-<br />
1,293,749<br />
1,410,186<br />
1,410,186<br />
1,410,186<br />
1,410,186<br />
1,410,186<br />
1,410,186<br />
1,410,186<br />
1,410,186<br />
1,410,186<br />
1,410,186<br />
1,410,186<br />
1,410,186<br />
1,410,186<br />
1,410,186<br />
1,410,186<br />
1,410,186<br />
1,410,186<br />
1,410,186<br />
1,410,186<br />
1,410,186<br />
1,410,186<br />
1,410,186<br />
1,410,186<br />
1,410,186<br />
-<br />
-<br />
-<br />
-<br />
-<br />
-<br />
-<br />
-<br />
-<br />
-<br />
-<br />
-<br />
-<br />
-<br />
-<br />
-<br />
-<br />
-<br />
-<br />
-<br />
-<br />
-<br />
-<br />
-<br />
-<br />
-<br />
-<br />
-<br />
Total Annual Yield URV<br />
144,650,935<br />
144,650,935<br />
4,099,278<br />
4,215,715<br />
4,215,715<br />
4,215,715<br />
4,215,715<br />
4,215,715<br />
4,215,715<br />
4,215,715<br />
4,215,715<br />
4,215,715<br />
4,215,715<br />
4,215,715<br />
4,215,715<br />
4,215,715<br />
4,215,715<br />
4,215,715<br />
4,215,715<br />
4,215,715<br />
4,215,715<br />
4,215,715<br />
4,215,715<br />
4,215,715<br />
4,215,715<br />
4,215,715<br />
4,215,715<br />
10950000<br />
Appendix 3 – Derivation of Unit Reference Values for Potential <strong>Interventions</strong> June 2012<br />
-<br />
-<br />
10,950,000<br />
10,950,000<br />
10,950,000<br />
10,950,000<br />
10,950,000<br />
10,950,000<br />
10,950,000<br />
10,950,000<br />
10,950,000<br />
10,950,000<br />
10,950,000<br />
10,950,000<br />
10,950,000<br />
10,950,000<br />
10,950,000<br />
10,950,000<br />
10,950,000<br />
10,950,000<br />
10,950,000<br />
10,950,000<br />
10,950,000<br />
10,950,000<br />
10,950,000<br />
10,950,000<br />
10,950,000
Water Reconciliation Strategy Study for the Large Bulk Water Supply Systems: Greater Bloemfontein Area 16<br />
2039<br />
2040<br />
2041<br />
2042<br />
2043<br />
2044<br />
2045<br />
2046<br />
2047<br />
2048<br />
2049<br />
2050<br />
2051<br />
2052<br />
2053<br />
2054<br />
2055<br />
2056<br />
2057<br />
2058<br />
2059<br />
2060<br />
2061<br />
NPV<br />
(4%)<br />
NPV<br />
(6%)<br />
NPV<br />
(8%)<br />
-<br />
-<br />
-<br />
-<br />
-<br />
-<br />
-<br />
-<br />
-<br />
-<br />
-<br />
-<br />
-<br />
-<br />
-<br />
-<br />
-<br />
-<br />
-<br />
-<br />
-<br />
-<br />
-<br />
2,805,528<br />
2,805,528<br />
2,805,528<br />
2,805,528<br />
2,805,528<br />
2,805,528<br />
2,805,528<br />
2,805,528<br />
2,805,528<br />
2,805,528<br />
2,805,528<br />
2,805,528<br />
2,805,528<br />
2,805,528<br />
2,805,528<br />
2,805,528<br />
2,805,528<br />
2,805,528<br />
2,805,528<br />
2,805,528<br />
2,805,528<br />
2,805,528<br />
2,805,528<br />
1,410,186<br />
1,410,186<br />
1,410,186<br />
1,410,186<br />
1,410,186<br />
1,410,186<br />
1,410,186<br />
1,410,186<br />
1,410,186<br />
1,410,186<br />
1,410,186<br />
1,410,186<br />
1,410,186<br />
1,410,186<br />
1,410,186<br />
1,410,186<br />
1,410,186<br />
1,410,186<br />
1,410,186<br />
1,410,186<br />
1,410,186<br />
1,410,186<br />
1,410,186<br />
-<br />
-<br />
-<br />
-<br />
-<br />
-<br />
-<br />
-<br />
-<br />
-<br />
-<br />
-<br />
-<br />
-<br />
-<br />
-<br />
-<br />
-<br />
-<br />
-<br />
-<br />
-<br />
-<br />
4,215,715<br />
4,215,715<br />
4,215,715<br />
4,215,715<br />
4,215,715<br />
4,215,715<br />
4,215,715<br />
4,215,715<br />
4,215,715<br />
4,215,715<br />
4,215,715<br />
4,215,715<br />
4,215,715<br />
4,215,715<br />
4,215,715<br />
4,215,715<br />
4,215,715<br />
4,215,715<br />
4,215,715<br />
4,215,715<br />
4,215,715<br />
4,215,715<br />
4,215,715<br />
355,333,374<br />
323,822,651<br />
301,913,629<br />
10,950,000<br />
10,950,000<br />
10,950,000<br />
10,950,000<br />
10,950,000<br />
10,950,000<br />
10,950,000<br />
10,950,000<br />
10,950,000<br />
10,950,000<br />
10,950,000<br />
10,950,000<br />
10,950,000<br />
10,950,000<br />
10,950,000<br />
10,950,000<br />
10,950,000<br />
10,950,000<br />
10,950,000<br />
10,950,000<br />
10,950,000<br />
10,950,000<br />
10,950,000<br />
214,577,185<br />
152,516,724<br />
114,429,908<br />
Appendix 3 – Derivation of Unit Reference Values for Potential <strong>Interventions</strong> June 2012<br />
1.66<br />
2.12<br />
2.64
Water Reconciliation Strategy Study for the Large Bulk Water Supply Systems: Greater Bloemfontein Area 17<br />
D3. Planned Indirect Re-use - Krugersdrift Dam<br />
Year Capital O&M Electricty Orange<br />
River<br />
2012<br />
2013<br />
2014<br />
2015<br />
2016<br />
2017<br />
2018<br />
2019<br />
2020<br />
2021<br />
2022<br />
2023<br />
2024<br />
2025<br />
2026<br />
2027<br />
2028<br />
2029<br />
2030<br />
2031<br />
2032<br />
2033<br />
2034<br />
2035<br />
2036<br />
2037<br />
2038<br />
306,641,035<br />
153,320,518<br />
153,320,518<br />
-<br />
-<br />
-<br />
-<br />
-<br />
-<br />
-<br />
-<br />
-<br />
-<br />
-<br />
-<br />
-<br />
-<br />
-<br />
-<br />
-<br />
-<br />
-<br />
-<br />
-<br />
-<br />
-<br />
-<br />
-<br />
4,844,194<br />
-<br />
-<br />
4,844,194<br />
4,844,194<br />
4,844,194<br />
4,844,194<br />
4,844,194<br />
4,844,194<br />
4,844,194<br />
4,844,194<br />
4,844,194<br />
4,844,194<br />
4,844,194<br />
4,844,194<br />
4,844,194<br />
4,844,194<br />
4,844,194<br />
4,844,194<br />
4,844,194<br />
4,844,194<br />
4,844,194<br />
4,844,194<br />
4,844,194<br />
4,844,194<br />
4,844,194<br />
4,844,194<br />
4,844,194<br />
4,649,398<br />
-<br />
-<br />
5,523,950<br />
6,021,105<br />
6,021,105<br />
6,021,105<br />
6,021,105<br />
6,021,105<br />
6,021,105<br />
6,021,105<br />
6,021,105<br />
6,021,105<br />
6,021,105<br />
6,021,105<br />
6,021,105<br />
6,021,105<br />
6,021,105<br />
6,021,105<br />
6,021,105<br />
6,021,105<br />
6,021,105<br />
6,021,105<br />
6,021,105<br />
6,021,105<br />
6,021,105<br />
6,021,105<br />
6,021,105<br />
-<br />
-<br />
-<br />
-<br />
-<br />
-<br />
-<br />
-<br />
-<br />
-<br />
-<br />
-<br />
-<br />
-<br />
-<br />
-<br />
-<br />
-<br />
-<br />
-<br />
-<br />
-<br />
-<br />
-<br />
-<br />
-<br />
-<br />
-<br />
Total Annual Yield URV<br />
153,320,518<br />
153,320,518<br />
10,368,144<br />
10,865,299<br />
10,865,299<br />
10,865,299<br />
10,865,299<br />
10,865,299<br />
10,865,299<br />
10,865,299<br />
10,865,299<br />
10,865,299<br />
10,865,299<br />
10,865,299<br />
10,865,299<br />
10,865,299<br />
10,865,299<br />
10,865,299<br />
10,865,299<br />
10,865,299<br />
10,865,299<br />
10,865,299<br />
10,865,299<br />
10,865,299<br />
10,865,299<br />
10,865,299<br />
10,865,299<br />
10950000<br />
Appendix 3 – Derivation of Unit Reference Values for Potential <strong>Interventions</strong> June 2012<br />
-<br />
-<br />
10,950,000<br />
10,950,000<br />
10,950,000<br />
10,950,000<br />
10,950,000<br />
10,950,000<br />
10,950,000<br />
10,950,000<br />
10,950,000<br />
10,950,000<br />
10,950,000<br />
10,950,000<br />
10,950,000<br />
10,950,000<br />
10,950,000<br />
10,950,000<br />
10,950,000<br />
10,950,000<br />
10,950,000<br />
10,950,000<br />
10,950,000<br />
10,950,000<br />
10,950,000<br />
10,950,000<br />
10,950,000
Water Reconciliation Strategy Study for the Large Bulk Water Supply Systems: Greater Bloemfontein Area 18<br />
2039<br />
2040<br />
2041<br />
2042<br />
2043<br />
2044<br />
2045<br />
2046<br />
2047<br />
2048<br />
2049<br />
2050<br />
2051<br />
2052<br />
2053<br />
2054<br />
2055<br />
2056<br />
2057<br />
2058<br />
2059<br />
2060<br />
2061<br />
NPV<br />
(4%)<br />
NPV<br />
(6%)<br />
NPV<br />
(8%)<br />
-<br />
-<br />
-<br />
-<br />
-<br />
-<br />
-<br />
-<br />
-<br />
-<br />
-<br />
-<br />
-<br />
-<br />
-<br />
-<br />
-<br />
-<br />
-<br />
-<br />
-<br />
-<br />
-<br />
4,844,194<br />
4,844,194<br />
4,844,194<br />
4,844,194<br />
4,844,194<br />
4,844,194<br />
4,844,194<br />
4,844,194<br />
4,844,194<br />
4,844,194<br />
4,844,194<br />
4,844,194<br />
4,844,194<br />
4,844,194<br />
4,844,194<br />
4,844,194<br />
4,844,194<br />
4,844,194<br />
4,844,194<br />
4,844,194<br />
4,844,194<br />
4,844,194<br />
4,844,194<br />
6,021,105<br />
6,021,105<br />
6,021,105<br />
6,021,105<br />
6,021,105<br />
6,021,105<br />
6,021,105<br />
6,021,105<br />
6,021,105<br />
6,021,105<br />
6,021,105<br />
6,021,105<br />
6,021,105<br />
6,021,105<br />
6,021,105<br />
6,021,105<br />
6,021,105<br />
6,021,105<br />
6,021,105<br />
6,021,105<br />
6,021,105<br />
6,021,105<br />
6,021,105<br />
-<br />
-<br />
-<br />
-<br />
-<br />
-<br />
-<br />
-<br />
-<br />
-<br />
-<br />
-<br />
-<br />
-<br />
-<br />
-<br />
-<br />
-<br />
-<br />
-<br />
-<br />
-<br />
-<br />
10,865,299<br />
10,865,299<br />
10,865,299<br />
10,865,299<br />
10,865,299<br />
10,865,299<br />
10,865,299<br />
10,865,299<br />
10,865,299<br />
10,865,299<br />
10,865,299<br />
10,865,299<br />
10,865,299<br />
10,865,299<br />
10,865,299<br />
10,865,299<br />
10,865,299<br />
10,865,299<br />
10,865,299<br />
10,865,299<br />
10,865,299<br />
10,865,299<br />
10,865,299<br />
501,652,423<br />
432,016,263<br />
386,561,182<br />
10,950,000<br />
10,950,000<br />
10,950,000<br />
10,950,000<br />
10,950,000<br />
10,950,000<br />
10,950,000<br />
10,950,000<br />
10,950,000<br />
10,950,000<br />
10,950,000<br />
10,950,000<br />
10,950,000<br />
10,950,000<br />
10,950,000<br />
10,950,000<br />
10,950,000<br />
10,950,000<br />
10,950,000<br />
10,950,000<br />
10,950,000<br />
10,950,000<br />
10,950,000<br />
214,577,185<br />
152,516,724<br />
114,429,908<br />
Appendix 3 – Derivation of Unit Reference Values for Potential <strong>Interventions</strong> June 2012<br />
2.34<br />
2.83<br />
3.38
Water Reconciliation Strategy Study for the Large Bulk Water Supply Systems: Greater Bloemfontein Area 19<br />
D4. Planned Direct Re-use – Bloemspruit<br />
Year Capital O&M Electricity Orange<br />
River<br />
2012<br />
2013<br />
2014<br />
2015<br />
2016<br />
2017<br />
2018<br />
2019<br />
2020<br />
2021<br />
2022<br />
2023<br />
2024<br />
2025<br />
2026<br />
2027<br />
2028<br />
2029<br />
2030<br />
2031<br />
2032<br />
2033<br />
2034<br />
2035<br />
2036<br />
2037<br />
2038<br />
179,397,189<br />
89,698,594<br />
89,698,594<br />
-<br />
-<br />
-<br />
-<br />
-<br />
-<br />
-<br />
-<br />
-<br />
-<br />
-<br />
-<br />
-<br />
-<br />
-<br />
-<br />
-<br />
-<br />
-<br />
-<br />
-<br />
-<br />
-<br />
-<br />
-<br />
3,559,150<br />
-<br />
-<br />
3,559,150<br />
3,559,150<br />
3,559,150<br />
3,559,150<br />
3,559,150<br />
3,559,150<br />
3,559,150<br />
3,559,150<br />
3,559,150<br />
3,559,150<br />
3,559,150<br />
3,559,150<br />
3,559,150<br />
3,559,150<br />
3,559,150<br />
3,559,150<br />
3,559,150<br />
3,559,150<br />
3,559,150<br />
3,559,150<br />
3,559,150<br />
3,559,150<br />
3,559,150<br />
3,559,150<br />
3,559,150<br />
1,342,614<br />
-<br />
-<br />
1,595,160<br />
1,738,724<br />
1,738,724<br />
1,738,724<br />
1,738,724<br />
1,738,724<br />
1,738,724<br />
1,738,724<br />
1,738,724<br />
1,738,724<br />
1,738,724<br />
1,738,724<br />
1,738,724<br />
1,738,724<br />
1,738,724<br />
1,738,724<br />
1,738,724<br />
1,738,724<br />
1,738,724<br />
1,738,724<br />
1,738,724<br />
1,738,724<br />
1,738,724<br />
1,738,724<br />
1,738,724<br />
Total Annual Yield URV<br />
Appendix 3 – Derivation of Unit Reference Values for Potential <strong>Interventions</strong> June 2012<br />
-<br />
-<br />
-<br />
-<br />
-<br />
-<br />
-<br />
-<br />
-<br />
-<br />
-<br />
-<br />
-<br />
-<br />
-<br />
-<br />
-<br />
-<br />
-<br />
-<br />
-<br />
-<br />
-<br />
-<br />
-<br />
-<br />
-<br />
-<br />
89,698,594<br />
89,698,594<br />
5,154,310<br />
5,297,875<br />
5,297,875<br />
5,297,875<br />
5,297,875<br />
5,297,875<br />
5,297,875<br />
5,297,875<br />
5,297,875<br />
5,297,875<br />
5,297,875<br />
5,297,875<br />
5,297,875<br />
5,297,875<br />
5,297,875<br />
5,297,875<br />
5,297,875<br />
5,297,875<br />
5,297,875<br />
5,297,875<br />
5,297,875<br />
5,297,875<br />
5,297,875<br />
5,297,875<br />
5,297,875<br />
10950000<br />
-<br />
-<br />
10,950,000<br />
10,950,000<br />
10,950,000<br />
10,950,000<br />
10,950,000<br />
10,950,000<br />
10,950,000<br />
10,950,000<br />
10,950,000<br />
10,950,000<br />
10,950,000<br />
10,950,000<br />
10,950,000<br />
10,950,000<br />
10,950,000<br />
10,950,000<br />
10,950,000<br />
10,950,000<br />
10,950,000<br />
10,950,000<br />
10,950,000<br />
10,950,000<br />
10,950,000<br />
10,950,000<br />
10,950,000
Water Reconciliation Strategy Study for the Large Bulk Water Supply Systems: Greater Bloemfontein Area 20<br />
2039<br />
2040<br />
2041<br />
2042<br />
2043<br />
2044<br />
2045<br />
2046<br />
2047<br />
2048<br />
2049<br />
2050<br />
2051<br />
2052<br />
2053<br />
2054<br />
2055<br />
2056<br />
2057<br />
2058<br />
2059<br />
2060<br />
2061<br />
NPV<br />
(4%)<br />
NPV<br />
(6%)<br />
NPV<br />
(8%)<br />
-<br />
-<br />
-<br />
-<br />
-<br />
-<br />
-<br />
-<br />
-<br />
-<br />
-<br />
-<br />
-<br />
-<br />
-<br />
-<br />
-<br />
-<br />
-<br />
-<br />
-<br />
-<br />
-<br />
3,559,150<br />
3,559,150<br />
3,559,150<br />
3,559,150<br />
3,559,150<br />
3,559,150<br />
3,559,150<br />
3,559,150<br />
3,559,150<br />
3,559,150<br />
3,559,150<br />
3,559,150<br />
3,559,150<br />
3,559,150<br />
3,559,150<br />
3,559,150<br />
3,559,150<br />
3,559,150<br />
3,559,150<br />
3,559,150<br />
3,559,150<br />
3,559,150<br />
3,559,150<br />
1,738,724<br />
1,738,724<br />
1,738,724<br />
1,738,724<br />
1,738,724<br />
1,738,724<br />
1,738,724<br />
1,738,724<br />
1,738,724<br />
1,738,724<br />
1,738,724<br />
1,738,724<br />
1,738,724<br />
1,738,724<br />
1,738,724<br />
1,738,724<br />
1,738,724<br />
1,738,724<br />
1,738,724<br />
1,738,724<br />
1,738,724<br />
1,738,724<br />
1,738,724<br />
Appendix 3 – Derivation of Unit Reference Values for Potential <strong>Interventions</strong> June 2012<br />
-<br />
-<br />
-<br />
-<br />
-<br />
-<br />
-<br />
-<br />
-<br />
-<br />
-<br />
-<br />
-<br />
-<br />
-<br />
-<br />
-<br />
-<br />
-<br />
-<br />
-<br />
-<br />
-<br />
5,297,875<br />
5,297,875<br />
5,297,875<br />
5,297,875<br />
5,297,875<br />
5,297,875<br />
5,297,875<br />
5,297,875<br />
5,297,875<br />
5,297,875<br />
5,297,875<br />
5,297,875<br />
5,297,875<br />
5,297,875<br />
5,297,875<br />
5,297,875<br />
5,297,875<br />
5,297,875<br />
5,297,875<br />
5,297,875<br />
5,297,875<br />
5,297,875<br />
5,297,875<br />
272,870,042<br />
238,123,484<br />
215,206,331<br />
10,950,000<br />
10,950,000<br />
10,950,000<br />
10,950,000<br />
10,950,000<br />
10,950,000<br />
10,950,000<br />
10,950,000<br />
10,950,000<br />
10,950,000<br />
10,950,000<br />
10,950,000<br />
10,950,000<br />
10,950,000<br />
10,950,000<br />
10,950,000<br />
10,950,000<br />
10,950,000<br />
10,950,000<br />
10,950,000<br />
10,950,000<br />
10,950,000<br />
10,950,000<br />
214,577,185<br />
152,516,724<br />
114,429,908<br />
1.27<br />
1.56<br />
1.88
Water Reconciliation Strategy Study for the Large Bulk Water Supply Systems: Greater Bloemfontein Area 21<br />
E1. Ikgomotseng<br />
Year Estimated Average<br />
Yield of New<br />
Boreholes<br />
(m 3 /a)<br />
Capital O&M<br />
177,390 R8,377,588 R238,038<br />
1 2010 0.00 R8,377,588 R0.00<br />
2 2011 177,390 R0.00 R238,038<br />
3 2012 177,390 R0 R238,038<br />
4 2013 177,390 R0 R238,038<br />
5 2014 177,390 R0 R238,038<br />
6 2015 177,390 R0 R238,038<br />
7 2016 177,390 R0 R238,038<br />
8 2017 177,390 R0 R238,038<br />
9 2018 177,390 R0 R238,038<br />
10 2019 177,390 R0 R238,038<br />
11 2020 177,390 R0 R238,038<br />
12 2021 177,390 R0 R238,038<br />
13 2022 177,390 R0 R238,038<br />
14 2023 177,390 R0 R238,038<br />
15 2024 177,390 R0 R238,038<br />
16 2025 177,390 R0 R238,038<br />
17 2026 177,390 R0 R238,038<br />
18 2027 177,390 R0 R238,038<br />
19 2028 177,390 R0 R238,038<br />
20 2029 177,390 R0 R238,038<br />
21 2030 177,390 R0 R238,038<br />
22 2031 177,390 R0 R238,038<br />
23 2032 177,390 R0 R238,038<br />
24 2033 177,390 R0 R238,038<br />
25 2034 177,390 R0 R238,038<br />
26 2035 177,390 R0 R238,038<br />
27 2036 177,390 R0 R238,038<br />
28 2037 177,390 R0 R238,038<br />
29 2038 177,390 R0 R238,038<br />
30 2039 177,390 R0 R238,038<br />
31 2040 177,390 R0 R238,038<br />
32 2041 177,390 R0 R238,038<br />
33 2042 177,390 R0 R238,038<br />
34 2043 177,390 R0 R238,038<br />
35 2044 177,390 R0 R238,038<br />
36 2045 177,390 R0 R 238,038<br />
37 2046 177,390 R 0 R 238,038<br />
Appendix 3 – Derivation of Unit Reference Values for Potential <strong>Interventions</strong> June 2012
Water Reconciliation Strategy Study for the Large Bulk Water Supply Systems: Greater Bloemfontein Area 22<br />
38 2047 177,390 R 0 R 238,038<br />
39 2048 177,390 R 0 R 238,038<br />
40 2049 177,390 R0 R238,038<br />
41 2050 177,390 R0 R238,038<br />
42 2051 177,390 R0 R238,038<br />
43 2052 177,390 R0 R238,038<br />
44 2053 177,390 R0 R238,038<br />
45 2054 177,390 R0 R238,038<br />
46 2055 177,390 R0 R238,038<br />
47 2056 177,390 R0 R238,038<br />
48 2057 177,390 R0 R238,038<br />
49 2058 177,390 R0 R238,038<br />
50 2059 177,390 R0 R238,038<br />
51 2060 177,390 R0 R238,038<br />
NPV NPV NPV<br />
4% 3,664,158 8,055,373 4,916,910<br />
6% 2,637,733 7,903,385 3,539,556<br />
8% 2,009,350 7,757,026 2,696,333<br />
Appendix 3 – Derivation of Unit Reference Values for Potential <strong>Interventions</strong> June 2012
Water Reconciliation Strategy Study for the Large Bulk Water Supply Systems: Greater Bloemfontein Area 23<br />
E2. Bloemfontein<br />
Year Estimated<br />
Average Yield of<br />
New Boreholes<br />
(m 3 /a)<br />
Capital O&M<br />
27,968,490 R4,743,747,523 R39,238,962<br />
2010 0 R1,581,249,174 R0.00<br />
2011 0 R1,581,249,174 R0<br />
2012 9,322,830 R1,581,249,174 R13,079,654<br />
2013 27,968,490 R0 R39,238,962<br />
2014 27,968,490 R0 R39,238,962<br />
2015 27,968,490 R0 R39,238,962<br />
2016 27,968,490 R0 R39,238,962<br />
2017 27,968,490 R0 R39,238,962<br />
2018 27,968,490 R0 R39,238,962<br />
2019 27,968,490 R0 R39,238,962<br />
2020 27,968,490 R0 R39,238,962<br />
2021 27,968,490 R0 R39,238,962<br />
2022 27,968,490 R0 R39,238,962<br />
2023 27,968,490 R0 R39,238,962<br />
2024 27,968,490 R0 R39,238,962<br />
2025 27,968,490 R0 R39,238,962<br />
2026 27,968,490 R0 R39,238,962<br />
2027 27,968,490 R0 R39,238,962<br />
2028 27,968,490 R0 R39,238,962<br />
2029 27,968,490 R0 R39,238,962<br />
2030 27,968,490 R0 R39,238,962<br />
2031 27,968,490 R0 R39,238,962<br />
2032 27,968,490 R0 R39,238,962<br />
2033 27,968,490 R0 R39,238,962<br />
2034 27,968,490 R0 R39,238,962<br />
2035 27,968,490 R0 R39,238,962<br />
2036 27,968,490 R0 R39,238,962<br />
2037 27,968,490 R0 R39,238,962<br />
2038 27,968,490 R0 R39,238,962<br />
2039 27,968,490 R0 R39,238,962<br />
2040 27,968,490 R0 R39,238,962<br />
2041 27,968,490 R0 R39,238,962<br />
2042 27,968,490 R0 R39,238,962<br />
2043 27,968,490 R0 R39,238,962<br />
2044 27,968,490 R0 R39,238,962<br />
2045 27,968,490 R0 R39,238,962<br />
2046 27,968,490 R0 R39,238,962<br />
Appendix 3 – Derivation of Unit Reference Values for Potential <strong>Interventions</strong> June 2012
Water Reconciliation Strategy Study for the Large Bulk Water Supply Systems: Greater Bloemfontein Area 24<br />
2047 27,968,490 R0 R39,238,962<br />
2048 27,968,490 R0 R39,238,962<br />
2049 27,968,490 R0 R39,238,962<br />
2050 27,968,490 R0 R39,238,962<br />
2051 27,968,490 R0 R39,238,962<br />
2052 27,968,490 R0 R39,238,962<br />
2053 27,968,490 R0 R39,238,962<br />
2054 27,968,490 R0 R39,238,962<br />
2055 27,968,490 R0 R39,238,962<br />
2056 27,968,490 R0 R39,238,962<br />
2057 27,968,490 R0 R39,238,962<br />
2058 27,968,490 R0 R39,238,962<br />
2059 27,968,490 R0 R39,238,962<br />
2060 27,968,490 R0 R39,238,962<br />
NPV NPV NPV URV<br />
4% 535,281,275 4,388,110,405 750,983,748 9.60<br />
6% 375,335,380 4,226,697,938 526,584,403 12.66<br />
8% 278,027,495 4,075,032,483 390,064,327 16.06<br />
Appendix 3 – Derivation of Unit Reference Values for Potential <strong>Interventions</strong> June 2012
Water Reconciliation Strategy Study for the Large Bulk Water Supply Systems: Greater Bloemfontein Area 25<br />
E3. Thaba Nchu<br />
Year Estimated<br />
Average Yield of<br />
New Boreholes<br />
(m 3 /a)<br />
Capital O&M<br />
886,950 R32,667,250 R2,147,500<br />
2010 0 R16,333,625 R0.00<br />
2011 443,475 R16,333,625 R1,073,750<br />
2012 886,950 R0 R2,147,500<br />
2013 886,950 R0 R2,147,500<br />
2014 886,950 R0 R2,147,500<br />
2015 886,950 R0 R2,147,500<br />
2016 886,950 R0 R2,147,500<br />
2017 886,950 R0 R2,147,500<br />
2018 886,950 R0 R2,147,500<br />
2019 886,950 R0 R2,147,500<br />
2020 886,950 R0 R2,147,500<br />
2021 886,950 R0 R2,147,500<br />
2022 886,950 R0 R2,147,500<br />
2023 886,950 R0 R2,147,500<br />
2024 886,950 R0 R2,147,500<br />
2025 886,950 R0 R2,147,500<br />
2026 886,950 R0 R2,147,500<br />
2027 886,950 R0 R2,147,500<br />
2028 886,950 R0 R2,147,500<br />
2029 886,950 R0 R2,147,500<br />
2030 886,950 R0 R2,147,500<br />
2031 886,950 R0 R2,147,500<br />
2032 886,950 R0 R2,147,500<br />
2033 886,950 R0 R2,147,500<br />
2034 886,950 R0 R2,147,500<br />
2035 886,950 R0 R2,147,500<br />
2036 886,950 R0 R2,147,500<br />
2037 886,950 R0 R2,147,500<br />
2038 886,950 R0 R2,147,500<br />
2039 886,950 R0 R2,147,500<br />
2040 886,950 R0 R2,147,500<br />
2041 886,950 R0 R2,147,500<br />
2042 886,950 R0 R2,147,500<br />
2043 886,950 R0 R2,147,500<br />
2044 886,950 R0 R2,147,500<br />
2045 886,950 R0 R2,147,500<br />
2046 886,950 R0 R2,147,500<br />
Appendix 3 – Derivation of Unit Reference Values for Potential <strong>Interventions</strong> June 2012
Water Reconciliation Strategy Study for the Large Bulk Water Supply Systems: Greater Bloemfontein Area 26<br />
2047 886,950 R0 R2,147,500<br />
2048 886,950 R0 R2,147,500<br />
2049 886,950 R0 R2,147,500<br />
2050 886,950 R0 R2,147,500<br />
2051 886,950 R0 R2,147,500<br />
2052 886,950 R0 R2,147,500<br />
2053 886,950 R0 R2,147,500<br />
2054 886,950 R0 R2,147,500<br />
2055 886,950 R0 R2,147,500<br />
2056 886,950 R0 R2,147,500<br />
2057 886,950 R0 R2,147,500<br />
2058 886,950 R0 R2,147,500<br />
2059 886,950 R0 R2,147,500<br />
2060 886,950 R0 R2,147,500<br />
NPV NPV NPV URV<br />
4% 17,910,774 30,806,763 43,365,903 4.14<br />
6% 12,793,971 29,945,948 30,977,004 4.76<br />
8% 9,666,541 29,127,178 23,404,810 5.43<br />
Appendix 3 – Derivation of Unit Reference Values for Potential <strong>Interventions</strong> June 2012
Water Reconciliation Strategy Study for the Large Bulk Water Supply Systems: Greater Bloemfontein Area 27<br />
E4. Reddersburg<br />
Year Estimated<br />
Average Yield of<br />
New Boreholes<br />
(m 3 /a)<br />
Capital O&M<br />
88,695 R6,700,545 R283,312<br />
2010 0 R3,350,273 R0.00<br />
2011 44,348 R3,350,273 R141,656<br />
2012 88,695 R0 R283,312<br />
2013 88,695 R0 R283,312<br />
2014 88,695 R0 R283,312<br />
2015 88,695 R0 R283,312<br />
2016 88,695 R0 R283,312<br />
2017 88,695 R0 R283,312<br />
2018 88,695 R0 R283,312<br />
2019 88,695 R0 R283,312<br />
2020 88,695 R0 R283,312<br />
2021 88,695 R0 R283,312<br />
2022 88,695 R0 R283,312<br />
2023 88,695 R0 R283,312<br />
2024 88,695 R0 R283,312<br />
2025 88,695 R0 R283,312<br />
2026 88,695 R0 R283,312<br />
2027 88,695 R0 R283,312<br />
2028 88,695 R0 R283,312<br />
2029 88,695 R0 R283,312<br />
2030 88,695 R0 R283,312<br />
2031 88,695 R0 R283,312<br />
2032 88,695 R0 R283,312<br />
2033 88,695 R0 R283,312<br />
2034 88,695 R0 R283,312<br />
2035 88,695 R0 R283,312<br />
2036 88,695 R0 R283,312<br />
2037 88,695 R0 R283,312<br />
2038 88,695 R0 R283,312<br />
2039 88,695 R0 R283,312<br />
2040 88,695 R0 R283,312<br />
2041 88,695 R0 R283,312<br />
2042 88,695 R0 R283,312<br />
2043 88,695 R0 R283,312<br />
2044 88,695 R0 R283,312<br />
2045 88,695 R0 R283,312<br />
2046 88,695 R0 R283,312<br />
Appendix 3 – Derivation of Unit Reference Values for Potential <strong>Interventions</strong> June 2012
Water Reconciliation Strategy Study for the Large Bulk Water Supply Systems: Greater Bloemfontein Area 28<br />
2047 88,695 R0 R283,312<br />
2048 88,695 R0 R283,312<br />
2049 88,695 R0 R283,312<br />
2050 88,695 R0 R283,312<br />
2051 88,695 R0 R283,312<br />
2052 88,695 R0 R283,312<br />
2053 88,695 R0 R283,312<br />
2054 88,695 R0 R283,312<br />
2055 88,695 R0 R283,312<br />
2056 88,695 R0 R283,312<br />
2057 88,695 R0 R283,312<br />
2058 88,695 R0 R283,312<br />
2059 88,695 R0 R283,312<br />
2060 88,695 R0 R283,312<br />
NPV NPV NPV URV<br />
4% 1,791,077 6,318,931 5,721,100 6.72<br />
6% 1,279,397 6,142,365 4,086,679 8.00<br />
8% 966,654 5,974,423 3,087,708 9.37<br />
Appendix 3 – Derivation of Unit Reference Values for Potential <strong>Interventions</strong> June 2012
Water Reconciliation Strategy Study for the Large Bulk Water Supply Systems: Greater Bloemfontein Area 29<br />
E5. Edenburg<br />
Year Estimated<br />
Average Yield of<br />
New Boreholes<br />
(m 3 /a)<br />
Capital O&M<br />
88,695 R7,053,548 R331,345<br />
2010 0 R3,526,774 R0.00<br />
2011 44,348 R3,526,774 R165,673<br />
2012 88,695 R0 R331,345<br />
2013 88,695 R0 R331,345<br />
2014 88,695 R0 R331,345<br />
2015 88,695 R0 R331,345<br />
2016 88,695 R0 R331,345<br />
2017 88,695 R0 R331,345<br />
2018 88,695 R0 R331,345<br />
2019 88,695 R0 R331,345<br />
2020 88,695 R0 R331,345<br />
2021 88,695 R0 R331,345<br />
2022 88,695 R0 R331,345<br />
2023 88,695 R0 R331,345<br />
2024 88,695 R0 R331,345<br />
2025 88,695 R0 R331,345<br />
2026 88,695 R0 R331,345<br />
2027 88,695 R0 R331,345<br />
2028 88,695 R0 R331,345<br />
2029 88,695 R0 R331,345<br />
2030 88,695 R0 R331,345<br />
2031 88,695 R0 R331,345<br />
2032 88,695 R0 R331,345<br />
2033 88,695 R0 R331,345<br />
2034 88,695 R0 R331,345<br />
2035 88,695 R0 R331,345<br />
2036 88,695 R0 R331,345<br />
2037 88,695 R0 R331,345<br />
2038 88,695 R0 R331,345<br />
2039 88,695 R0 R331,345<br />
2040 88,695 R0 R331,345<br />
2041 88,695 R0 R331,345<br />
2042 88,695 R0 R331,345<br />
2043 88,695 R0 R331,345<br />
2044 88,695 R0 R331,345<br />
2045 88,695 R0 R331,345<br />
2046 88,695 R0 R331,345<br />
Appendix 3 – Derivation of Unit Reference Values for Potential <strong>Interventions</strong> June 2012
Water Reconciliation Strategy Study for the Large Bulk Water Supply Systems: Greater Bloemfontein Area 30<br />
2047 88,695 R0 R331,345<br />
2048 88,695 R0 R331,345<br />
2049 88,695 R0 R331,345<br />
2050 88,695 R0 R331,345<br />
2051 88,695 R0 R331,345<br />
2052 88,695 R0 R331,345<br />
2053 88,695 R0 R331,345<br />
2054 88,695 R0 R331,345<br />
2055 88,695 R0 R331,345<br />
2056 88,695 R0 R331,345<br />
2057 88,695 R0 R331,345<br />
2058 88,695 R0 R331,345<br />
2059 88,695 R0 R331,345<br />
2060 88,695 R0 R331,345<br />
NPV NPV NPV URV<br />
4% 1,791,077 6,651,830 6,691,071 7.45<br />
6% 1,279,397 6,465,962 4,779,546 8.79<br />
8% 966,654 6,289,172 3,611,207 10.24<br />
Appendix 3 – Derivation of Unit Reference Values for Potential <strong>Interventions</strong> June 2012
Water Reconciliation Strategy Study for the Large Bulk Water Supply Systems: Greater Bloemfontein Area 31<br />
E6. Dewetsdorp<br />
Year Estimated<br />
Average Yield of<br />
New Boreholes<br />
(m 3 /a)<br />
Capital O&M<br />
88,695 R6,335,377 R198,419<br />
2010 0 R3,167,689 R0.00<br />
2011 44,348 R3,167,689 R99,209<br />
2012 88,695 R0 R198,419<br />
2013 88,695 R0 R198,419<br />
2014 88,695 R0 R198,419<br />
2015 88,695 R0 R198,419<br />
2016 88,695 R0 R198,419<br />
2017 88,695 R0 R198,419<br />
2018 88,695 R0 R198,419<br />
2019 88,695 R0 R198,419<br />
2020 88,695 R0 R198,419<br />
2021 88,695 R0 R198,419<br />
2022 88,695 R0 R198,419<br />
2023 88,695 R0 R198,419<br />
2024 88,695 R0 R198,419<br />
2025 88,695 R0 R198,419<br />
2026 88,695 R0 R198,419<br />
2027 88,695 R0 R198,419<br />
2028 88,695 R0 R198,419<br />
2029 88,695 R0 R198,419<br />
2030 88,695 R0 R198,419<br />
2031 88,695 R0 R198,419<br />
2032 88,695 R0 R198,419<br />
2033 88,695 R0 R198,419<br />
2034 88,695 R0 R198,419<br />
2035 88,695 R0 R198,419<br />
2036 88,695 R0 R198,419<br />
2037 88,695 R0 R198,419<br />
2038 88,695 R0 R198,419<br />
2039 88,695 R0 R198,419<br />
2040 88,695 R0 R198,419<br />
2041 88,695 R0 R198,419<br />
2042 88,695 R0 R198,419<br />
2043 88,695 R0 R198,419<br />
2044 88,695 R0 R198,419<br />
2045 88,695 R0 R198,419<br />
2046 88,695 R0 R198,419<br />
Appendix 3 – Derivation of Unit Reference Values for Potential <strong>Interventions</strong> June 2012
Water Reconciliation Strategy Study for the Large Bulk Water Supply Systems: Greater Bloemfontein Area 32<br />
2047 88,695 R0 R198,419<br />
2048 88,695 R0 R198,419<br />
2049 88,695 R0 R198,419<br />
2050 88,695 R0 R198,419<br />
2051 88,695 R0 R198,419<br />
2052 88,695 R0 R198,419<br />
2053 88,695 R0 R198,419<br />
2054 88,695 R0 R198,419<br />
2055 88,695 R0 R198,419<br />
2056 88,695 R0 R198,419<br />
2057 88,695 R0 R198,419<br />
2058 88,695 R0 R198,419<br />
2059 88,695 R0 R198,419<br />
2060 88,695 R0 R198,419<br />
NPV NPV NPV URV<br />
4% 1,791,077 5,974,561 4,006,804 5.57<br />
6% 1,279,397 5,807,617 2,862,128 6.78<br />
8% 966,654 5,648,828 2,162,494 8.08<br />
Appendix 3 – Derivation of Unit Reference Values for Potential <strong>Interventions</strong> June 2012
Water Reconciliation Strategy Study for the Large Bulk Water Supply Systems: Greater Bloemfontein Area 33<br />
E7. Wepener<br />
Year Estimated<br />
Average Yield of<br />
New Boreholes<br />
(m 3 /a)<br />
Capital O&M<br />
88,695 R5,920,843 R196,536<br />
2010 0 R2,960,422 R0.00<br />
2011 44,348 R2,960,422 R98,268<br />
2012 88,695 R0 R196,536<br />
2013 88,695 R0 R196,536<br />
2014 88,695 R0 R196,536<br />
2015 88,695 R0 R196,536<br />
2016 88,695 R0 R196,536<br />
2017 88,695 R0 R196,536<br />
2018 88,695 R0 R196,536<br />
2019 88,695 R0 R196,536<br />
2020 88,695 R0 R196,536<br />
2021 88,695 R0 R196,536<br />
2022 88,695 R0 R196,536<br />
2023 88,695 R0 R196,536<br />
2024 88,695 R0 R196,536<br />
2025 88,695 R0 R196,536<br />
2026 88,695 R0 R196,536<br />
2027 88,695 R0 R196,536<br />
2028 88,695 R0 R196,536<br />
2029 88,695 R0 R196,536<br />
2030 88,695 R0 R196,536<br />
2031 88,695 R0 R196,536<br />
2032 88,695 R0 R196,536<br />
2033 88,695 R0 R196,536<br />
2034 88,695 R0 R196,536<br />
2035 88,695 R0 R196,536<br />
2036 88,695 R0 R196,536<br />
2037 88,695 R0 R196,536<br />
2038 88,695 R0 R196,536<br />
2039 88,695 R0 R196,536<br />
2040 88,695 R0 R196,536<br />
2041 88,695 R0 R196,536<br />
2042 88,695 R0 R196,536<br />
2043 88,695 R0 R196,536<br />
2044 88,695 R0 R196,536<br />
2045 88,695 R0 R196,536<br />
2046 88,695 R0 R196,536<br />
Appendix 3 – Derivation of Unit Reference Values for Potential <strong>Interventions</strong> June 2012
Water Reconciliation Strategy Study for the Large Bulk Water Supply Systems: Greater Bloemfontein Area 34<br />
2047 88,695 R0 R196,536<br />
2048 88,695 R0 R196,536<br />
2049 88,695 R0 R196,536<br />
2050 88,695 R0 R196,536<br />
2051 88,695 R0 R196,536<br />
2052 88,695 R0 R196,536<br />
2053 88,695 R0 R196,536<br />
2054 88,695 R0 R196,536<br />
2055 88,695 R0 R196,536<br />
2056 88,695 R0 R196,536<br />
2057 88,695 R0 R196,536<br />
2058 88,695 R0 R196,536<br />
2059 88,695 R0 R196,536<br />
2060 88,695 R0 R196,536<br />
NPV NPV NPV URV<br />
4% 1,791,077 5,583,635 3,968,779 5.33<br />
6% 1,279,397 5,427,615 2,834,967 6.46<br />
8% 966,654 5,279,215 2,141,972 7.68<br />
Appendix 3 – Derivation of Unit Reference Values for Potential <strong>Interventions</strong> June 2012
Water Reconciliation Strategy Study for the Large Bulk Water Supply Systems: Greater Bloemfontein Area 35<br />
E8a. De Hoek Reservoir<br />
Year Estimated<br />
Average Yield of<br />
New Boreholes<br />
(m 3 /a)<br />
Capital O&M<br />
443,475 R42,976,269 R790,566<br />
2010 0 R21,488,135 R0.00<br />
2011 221,738 R21,488,135 R395,283<br />
2012 443,475 R0 R790,566<br />
2013 443,475 R0 R790,566<br />
2014 443,475 R0 R790,566<br />
2015 443,475 R0 R790,566<br />
2016 443,475 R0 R790,566<br />
2017 443,475 R0 R790,566<br />
2018 443,475 R0 R790,566<br />
2019 443,475 R0 R790,566<br />
2020 443,475 R0 R790,566<br />
2021 443,475 R0 R790,566<br />
2022 443,475 R0 R790,566<br />
2023 443,475 R0 R790,566<br />
2024 443,475 R0 R790,566<br />
2025 443,475 R0 R790,566<br />
2026 443,475 R0 R790,566<br />
2027 443,475 R0 R790,566<br />
2028 443,475 R0 R790,566<br />
2029 443,475 R0 R790,566<br />
2030 443,475 R0 R790,566<br />
2031 443,475 R0 R790,566<br />
2032 443,475 R0 R790,566<br />
2033 443,475 R0 R790,566<br />
2034 443,475 R0 R790,566<br />
2035 443,475 R0 R790,566<br />
2036 443,475 R0 R790,566<br />
2037 443,475 R0 R790,566<br />
2038 443,475 R0 R790,566<br />
2039 443,475 R0 R790,566<br />
2040 443,475 R0 R790,566<br />
2041 443,475 R0 R790,566<br />
2042 443,475 R0 R790,566<br />
2043 443,475 R0 R790,566<br />
2044 443,475 R0 R790,566<br />
2045 443,475 R0 R790,566<br />
2046 443,475 R0 R790,566<br />
Appendix 3 – Derivation of Unit Reference Values for Potential <strong>Interventions</strong> June 2012
Water Reconciliation Strategy Study for the Large Bulk Water Supply Systems: Greater Bloemfontein Area 36<br />
2047 443,475 R0 R790,566<br />
2048 443,475 R0 R790,566<br />
2049 443,475 R0 R790,566<br />
2050 443,475 R0 R790,566<br />
2051 443,475 R0 R790,566<br />
2052 443,475 R0 R790,566<br />
2053 443,475 R0 R790,566<br />
2054 443,475 R0 R790,566<br />
2055 443,475 R0 R790,566<br />
2056 443,475 R0 R790,566<br />
2057 443,475 R0 R790,566<br />
2058 443,475 R0 R790,566<br />
2059 443,475 R0 R790,566<br />
2060 443,475 R0 R790,566<br />
NPV NPV NPV URV<br />
4% 8,955,387 40,528,656 15,964,418 6.31<br />
6% 6,396,986 39,396,189 11,403,656 7.94<br />
8% 4,833,270 38,319,033 8,616,082 9.71<br />
Appendix 3 – Derivation of Unit Reference Values for Potential <strong>Interventions</strong> June 2012
Water Reconciliation Strategy Study for the Large Bulk Water Supply Systems: Greater Bloemfontein Area 37<br />
E8b. Lieukop Off-take Chamber<br />
Year Estimated<br />
Average Yield of<br />
New Boreholes<br />
(m 3 /a)<br />
Capital O&M<br />
425,736 R43,305,918 R971,562<br />
2010 0 R21,652,959 R0.00<br />
2011 212,868 R21,652,959 R485,781<br />
2012 425,736 R0 R971,562<br />
2013 425,736 R0 R971,562<br />
2014 425,736 R0 R971,562<br />
2015 425,736 R0 R971,562<br />
2016 425,736 R0 R971,562<br />
2017 425,736 R0 R971,562<br />
2018 425,736 R0 R971,562<br />
2019 425,736 R0 R971,562<br />
2020 425,736 R0 R971,562<br />
2021 425,736 R0 R971,562<br />
2022 425,736 R0 R971,562<br />
2023 425,736 R0 R971,562<br />
2024 425,736 R0 R971,562<br />
2025 425,736 R0 R971,562<br />
2026 425,736 R0 R971,562<br />
2027 425,736 R0 R971,562<br />
2028 425,736 R0 R971,562<br />
2029 425,736 R0 R971,562<br />
2030 425,736 R0 R971,562<br />
2031 425,736 R0 R971,562<br />
2032 425,736 R0 R971,562<br />
2033 425,736 R0 R971,562<br />
2034 425,736 R0 R971,562<br />
2035 425,736 R0 R971,562<br />
2036 425,736 R0 R971,562<br />
2037 425,736 R0 R971,562<br />
2038 425,736 R0 R971,562<br />
2039 425,736 R0 R971,562<br />
2040 425,736 R0 R971,562<br />
2041 425,736 R0 R971,562<br />
2042 425,736 R0 R971,562<br />
2043 425,736 R0 R971,562<br />
2044 425,736 R0 R971,562<br />
2045 425,736 R0 R971,562<br />
2046 425,736 R0 R971,562<br />
Appendix 3 – Derivation of Unit Reference Values for Potential <strong>Interventions</strong> June 2012
Water Reconciliation Strategy Study for the Large Bulk Water Supply Systems: Greater Bloemfontein Area 38<br />
2047 425,736 R0 R971,562<br />
2048 425,736 R0 R971,562<br />
2049 425,736 R0 R971,562<br />
2050 425,736 R0 R971,562<br />
2051 425,736 R0 R971,562<br />
2052 425,736 R0 R971,562<br />
2053 425,736 R0 R971,562<br />
2054 425,736 R0 R971,562<br />
2055 425,736 R0 R971,562<br />
2056 425,736 R0 R971,562<br />
2057 425,736 R0 R971,562<br />
2058 425,736 R0 R971,562<br />
2059 425,736 R0 R971,562<br />
2060 425,736 R0 R971,562<br />
NPV NPV NPV URV<br />
4% 8,597,172 40,839,530 19,619,406 7.03<br />
6% 6,141,106 39,698,376 14,014,476 8.75<br />
8% 4,639,940 38,612,958 10,588,699 10.60<br />
Appendix 3 – Derivation of Unit Reference Values for Potential <strong>Interventions</strong> June 2012
Water Reconciliation Strategy Study for the Large Bulk Water Supply Systems: Greater Bloemfontein Area 39<br />
G2. Transfer of Mine Water to Bloemfontein<br />
Year Yield (m3/a) Capital O&M<br />
20,075,000 R633,000,000 R59,000,000<br />
1 2010 0.00 R300,000,000 0<br />
2 2011 0.00 R333,000,000 0<br />
3 2012 R20,075,000 R0 0<br />
4 2013 R20,075,000 R0 0<br />
5 2014 R20,075,000 R0 0<br />
6 2015 20,075,000 R0 R59,000,000<br />
7 2016 20,075,000 R0 R59,000,000<br />
8 2017 20,075,000 R0 R59,000,000<br />
9 2018 20,075,000 R0 R59,000,000<br />
10 2019 20,075,000 R0 R59,000,000<br />
11 2020 20,075,000 R0 R59,000,000<br />
12 2021 20,075,000 R0 R59,000,000<br />
13 2022 20,075,000 R0 R59,000,000<br />
14 2023 20,075,000 R0 R59,000,000<br />
15 2024 20,075,000 R0 R59,000,000<br />
16 2025 20,075,000 R0 R59,000,000<br />
17 2026 20,075,000 R0 R59,000,000<br />
18 2027 20,075,000 R0 R59,000,000<br />
19 2028 20,075,000 R0 R59,000,000<br />
20 2029 20,075,000 R0 R59,000,000<br />
21 2030 20,075,000 R0 R59,000,000<br />
22 2031 20,075,000 R0 R59,000,000<br />
23 2032 20,075,000 R0 R59,000,000<br />
24 2033 20,075,000 R0 R59,000,000<br />
25 2034 20,075,000 R0 R59,000,000<br />
26 2035 20,075,000 R0 R59,000,000<br />
27 2036 20,075,000 R0 R59,000,000<br />
28 2037 20,075,000 R0 R59,000,000<br />
29 2038 20,075,000 R0 R59,000,000<br />
30 2039 20,075,000 R0 R59,000,000<br />
31 2040 20,075,000 R0 R59,000,000<br />
32 2041 20,075,000 R0 R59,000,000<br />
33 2042 20,075,000 R0 R59,000,000<br />
34 2043 20,075,000 R0 R59,000,000<br />
Appendix 3 – Derivation of Unit Reference Values for Potential <strong>Interventions</strong> June 2012
Water Reconciliation Strategy Study for the Large Bulk Water Supply Systems: Greater Bloemfontein Area 40<br />
35 2044 20,075,000 R0 R59,000,000<br />
36 2045 20,075,000 R0 R59,000,000<br />
37 2046 20,075,000 R0 R59,000,000<br />
38 2047 20,075,000 R0 R59,000,000<br />
39 2048 20,075,000 R0 R59,000,000<br />
40 2049 20,075,000 R0 R59,000,000<br />
41 2050 20,075,000 R0 R59,000,000<br />
42 2051 20,075,000 R0 R59,000,000<br />
43 2052 20,075,000 R0 R59,000,000<br />
44 2053 20,075,000 R0 R59,000,000<br />
45 2054 20,075,000 R0 R59,000,000<br />
46 2055 20,075,000 R0 R59,000,000<br />
47 2056 20,075,000 R0 R59,000,000<br />
48 2057 20,075,000 R0 R59,000,000<br />
49 2058 20,075,000 R0 R59,000,000<br />
50 2059 20,075,000 R0 R59,000,000<br />
NPV NPV NPV URV<br />
4% 393,391,506 596,338,757 1,004,791,375 4.07<br />
6% 279,613,994 579,387,682 681,420,314 4.51<br />
8% 209,788,164 563,271,605 486,205,702 5.00<br />
Appendix 3 – Derivation of Unit Reference Values for Potential <strong>Interventions</strong> June 2012
Water Reconciliation Strategy Study for the<br />
Large Bulk Water Supply Systems:<br />
Greater Bloemfontein Area<br />
APPENDIX 4<br />
Groundwater Potential for Small Towns
Water Reconciliation Strategy Study for the Bulk Water Supply Systems: Greater Bloemfontein Area i<br />
EXECUTIVE SUMMARY<br />
GHT Consulting Scientists were appointed to undertake a groundwater potential study for each of the small<br />
towns (Wepener, Dewetsdorp, Reddersburg, and Edenburg) located within the Greater Bloemfontein study<br />
area. The purpose of the investigation was to identify local groundwater resources and evaluate the<br />
potential of utilising groundwater to meet the anticipated future increase in water requirements. Currently,<br />
all these small towns receive water from Bloem Water and only a small percentage of the bulk water<br />
requirements are met through groundwater. To date, groundwater supply in the small towns has been<br />
problematic as most of the local municipalities do not have the technical capacity to manage the well fields<br />
and it is easier to rely on Bloem Water to supply all potable water requirements. However, in order to meet<br />
future water requirements, groundwater may be the most feasible source of water, as the bulk water<br />
infrastructure to the town will limit the supply of water above the design capacity threshold.<br />
This report details the assessment and results for each of the small towns. For each of the towns, potential<br />
dolerite dykes have been identified which need to be further investigated. It should be noted that there was<br />
no information confirming if these structures are water bearing and if so what the true sustainable yields are<br />
of these structures, not the estimate yields, as well as the associated groundwater qualities.<br />
The study concluded that it is viable to further investigate the groundwater resources for each of the small<br />
towns. It is recommended that any future orientated groundwater exploration study at least include the<br />
following components:<br />
Geophysical siting of groundwater exploration boreholes;<br />
Percussion drilling of the boreholes;<br />
Aquifer test pumping of successfully drilled exploration boreholes according to <strong>DWA</strong> specifications to<br />
determine the sustainable yields of the newly drilled boreholes;<br />
Sampling of all successfully drilled boreholes to determine the groundwater quality of the local site<br />
aquifer;<br />
Aquifer test pumping analyses of data to calculate sustainable yields and pump schedules; and<br />
Compilation of a Geohydrological <strong>Report</strong>.<br />
Appendix 4 – Groundwater Potential Study for Small Towns June 2012
Water Reconciliation Strategy Study for the Bulk Water Supply Systems: Greater Bloemfontein Area ii<br />
TABLE OF CONTENTS<br />
<strong>Page</strong> No<br />
1. BACKGROUND ................................................................................................................ 1<br />
1.1 INTRODUCTION ............................................................................................................................ 1<br />
1.2 OBJECTIVES OF THE STUDY ...................................................................................................... 1<br />
2. GEOLOGY ......................................................................................................................... 3<br />
2.1 LITHOSTRATIGRAPHY AND DEPOSITION HISTORY ................................................................. 3<br />
2.2 INTRUSIVE KAROO DOLERITE ................................................................................................... 4<br />
2.2.1 Geometry, structure and mechanisms of emplacement of dolerite dykes .......................... 5<br />
2.3 GEOHYDROLOGICAL IMPLICATIONS OF GEOLOGY ................................................................ 6<br />
2.3.1 Sediments ......................................................................................................................... 6<br />
2.3.2 Dolerite intrusions .............................................................................................................. 7<br />
2.4 HYDROSTRATIGRAPHY OF THE BEAUFORT GROUP .............................................................. 7<br />
2.5 GENERAL AQUIFER INFORMATION ........................................................................................... 7<br />
3. WEPENER ....................................................................................................................... 11<br />
3.1 CLIMATE ..................................................................................................................................... 11<br />
3.2 GEOLOGY ................................................................................................................................... 11<br />
3.2.1 General aquifer information of the Wepener District ........................................................ 11<br />
3.3 GROUN<strong>DWA</strong>TER POTENTIAL INVESTIGATION ....................................................................... 15<br />
3.3.1 Aerial photo interpretation ................................................................................................ 15<br />
3.4 AERIAL MAGNETIC DATA INTERPRETATIONS ........................................................................ 15<br />
3.4.1 The Magnetic Method ...................................................................................................... 15<br />
3.4.2 The Aerial Magnetic Method ............................................................................................ 15<br />
3.4.3 Results of the aerial magnetic data interpretation ............................................................ 16<br />
3.4.4 Geological map interpretations ........................................................................................ 16<br />
3.5 RECHARGE WATER BUDGET CALCULATIONS AND ESTIMATED THEORETICAL<br />
YIELDS OF POTENTIAL DYKE STRUCTURES .......................................................................... 19<br />
3.5.1 Recharge water budget calculations ................................................................................ 19<br />
3.6 ESTIMATION OF THEORETICAL POTENTIAL YIELD OF THE DOLERITE<br />
DYKE STRUCTURES .................................................................................................................. 24<br />
3.7 SUMMARY OF THE RESULTS – GROUN<strong>DWA</strong>TER RESOURCE POTENTIAL OF THE<br />
INTRUSIVE DOLERITE STRUCTURES ...................................................................................... 25<br />
3.7.1 Cost estimate of developing the proposed borehole fields ............................................... 25<br />
3.8 DETERMINATION OF HIGH GROUN<strong>DWA</strong>TER ABSTRACTION AREAS ................................... 26<br />
3.9 CONCLUSIONS AND RECOMMENDATIONS ............................................................................ 28<br />
4. DEWETSDORP ............................................................................................................... 33<br />
4.1 CLIMATE ..................................................................................................................................... 33<br />
4.2 GEOLOGY ................................................................................................................................... 33<br />
4.2.1 General aquifer information of the Dewetsdorp District .................................................... 33<br />
4.3 GROUN<strong>DWA</strong>TER POTENTIAL INVESTIGATIONS ..................................................................... 37<br />
4.3.1 Aerial photo interpretation ................................................................................................ 37<br />
4.3.2 Results of the aerial magnetic data interpretation ............................................................ 37<br />
4.3.3 Geological map interpretations ........................................................................................ 37<br />
4.4 RECHARGE WATER BUDGET CALCULATIONS AND ESTIMATED THEORETICAL<br />
YIELDS OF POTENTIAL DOLERITE STRUCTURES .................................................................. 39<br />
4.4.1 Recharge water budget calculations ................................................................................ 39<br />
4.5 ESTIMATION OF THEORETICAL POTENTIAL YIELD OF THE DOLERITE<br />
DYKE STRUCTURES .................................................................................................................. 45<br />
4.6 SUMMARY OF THE RESULTS – GROUN<strong>DWA</strong>TER RESOURCE POTENTIAL OF THE<br />
INTRUSIVE DOLERITE STRUCTURES ...................................................................................... 46<br />
4.6.1 Cost estimate of developing the proposed borehole fields ............................................... 47<br />
4.7 DETERMINATION OF HIGH GROUN<strong>DWA</strong>TER ABSTRACTION AREAS ................................... 47<br />
4.8 CONCLUSIONS AND RECOMMENDATIONS ............................................................................ 50<br />
Appendix 4 – Groundwater Potential Study for Small Towns June 2012
Water Reconciliation Strategy Study for the Bulk Water Supply Systems: Greater Bloemfontein Area iii<br />
5. REDDERSBURG ............................................................................................................. 55<br />
5.1 CLIMATE ..................................................................................................................................... 55<br />
5.2 GEOLOGY ................................................................................................................................... 55<br />
5.2.1 General aquifer information for Reddersburg ................................................................... 55<br />
5.3 GROUN<strong>DWA</strong>TER POTENTIAL INVESTIGATIONS ..................................................................... 58<br />
5.3.1 Aerial photo interpretation ................................................................................................ 58<br />
5.3.2 Results of the aerial data interpretation ........................................................................... 58<br />
5.3.3 Geological map interpretations ........................................................................................ 58<br />
5.4 RECHARGE WATER BUDGET CALCULATIONS AND ESTIMATED THEORETICAL<br />
YIELDS OF POTENTIAL DOLERITE STRUCTURES .................................................................. 62<br />
5.4.1 Recharge water budget calculations ................................................................................ 62<br />
5.5 ESTIMATION OF THEORETICAL POTENTIAL YIELD OF THE DOLERITE STRUCTURES ...... 68<br />
5.6 SUMMARY OF THE RESULTS – GROUN<strong>DWA</strong>TER RESOURCE POTENTIAL OF THE<br />
INTRUSIVE DOLERITE STRUCTURES ...................................................................................... 69<br />
5.6.1 Cost estimate of developing the proposed borehole fields ............................................... 70<br />
5.7 DETERMINATION OF HIGH GROUN<strong>DWA</strong>TER ABSTRACTION AREAS ................................... 70<br />
5.8 CONCLUSIONS AND RECOMMENDATIONS ............................................................................ 73<br />
6. EDENBURG .................................................................................................................... 78<br />
6.1 CLIMATE ..................................................................................................................................... 78<br />
6.2 GEOLOGY ................................................................................................................................... 78<br />
6.2.1 General aquifer information of the Edenburg District ....................................................... 78<br />
6.3 GROUN<strong>DWA</strong>TER POTENTIAL INVESTIGATIONS ..................................................................... 81<br />
6.3.1 Aerial photo interpretation ................................................................................................ 81<br />
6.3.2 Results of the aerial data interpretation ........................................................................... 81<br />
6.3.3 Geological map interpretations ........................................................................................ 81<br />
6.4 RECHARGE WATER BUDGET CALCULATIONS AND ESTIMATED THEORETICAL<br />
YIELD OF POTENTIAL DOLERITE DYKE STRUCTURES ......................................................... 85<br />
6.4.1 Recharge water budget calculations ................................................................................ 85<br />
6.5 ESTIMATION OF THEORETICAL POTENTIAL YIELD OF THE DOLERITE<br />
DYKE STRUCTURES .................................................................................................................. 91<br />
6.6 SUMMARY OF THE RESULTS – GROUN<strong>DWA</strong>TER RESOURCE POTENTIAL OF THE<br />
INTRUSIVE DOLERITE STRUCTURES ...................................................................................... 92<br />
6.6.1 Cost estimate of developing the proposed borehole fields ............................................... 93<br />
6.7 DETERMINATION OF HIGH GROUN<strong>DWA</strong>TER ABSTRACTION AREAS ................................... 93<br />
6.8 CONCLUSIONS AND RECOMMENDATIONS ............................................................................ 96<br />
7. REFERENCES .............................................................................................................. 101<br />
Appendix 4 – Groundwater Potential Study for Small Towns June 2012
Water Reconciliation Strategy Study for the Bulk Water Supply Systems: Greater Bloemfontein Area iv<br />
TABLES<br />
Table 3.1. Summary of the average available recharge to the Dyke Groups. The assumption thus<br />
made is that the available recharge volume correlates roughly to the sustainable yield<br />
available from the Dolerite Dyke groups. .............................................................................. 20<br />
Table 3.2: Recharge Volume Calculation Scenarios for Dyke Group A ................................................. 20<br />
Table 3.3: Recharge Volume Calculation Scenarios for Dyke Group B ................................................. 21<br />
Table 3.4: Recharge Volume Calculation Scenarios for Dyke Group C ................................................. 21<br />
Table 3.5: Recharge Volume Calculation Scenarios for Dyke Group D ................................................. 21<br />
Table 3.6: Theoretically estimated Dyke Group yields or groundwater resource potential based<br />
on the geometric mean of sustainable yields of Karoo Borehole Fields, see assumption<br />
section below the table for further information regarding the calculations ............................. 25<br />
Table 3.7: Estimation of the Borehole Field Development Cost for the Dyke Groups. Note that<br />
the costing does not make provision for Surface Infrastructure such as Electrical<br />
Supply Lines and Pipeline Networks etc. .............................................................................. 26<br />
Table 3.8: Coordinates of the Identified Irrigation Pivots ....................................................................... 26<br />
Table 4.1: Summary of the Average Available Recharge to the Dyke Groups. The assumption<br />
thus made is that the Available Recharge Volume correlates roughly to the Sustainable<br />
Yield available from the Dolerite Dyke Groups...................................................................... 40<br />
Table 4.2: Recharge Volume Calculation Scenarios for Dyke Group A ................................................. 40<br />
Table 4.3: Recharge Volume Calculation Scenarios for Dyke Group B ................................................. 41<br />
Table 4.4. Recharge Volume Calculation Scenarios for Dyke Group C ................................................. 41<br />
Table 4.5: Recharge Volume Calculation Scenarios for Dyke Group D ................................................. 41<br />
Table 4.6: Recharge Volume Calculation Scenarios for Dyke Group E ................................................. 42<br />
Table 4.7: Recharge Volume Calculation Scenarios for Dyke Group F ................................................. 42<br />
Table 4.8: Theoretically Estimated Dyke Group Yields or Groundwater Resource Potential<br />
based on the Geometric Mean of Sustainable Yields of Karoo Borehole Fields, see<br />
assumption section below the table for further information regarding the calculations .......... 46<br />
Table 4.9: Estimation of the Borehole Field Development Cost for the Dyke Groups. Note that<br />
the costing does not make provision for Surface Infrastructure such as Electrical<br />
Supply Lines and Pipeline Networks etc ............................................................................... 47<br />
Table 4.10: Coordinates of the Identified Irrigation Pivots ....................................................................... 48<br />
Table 5.1: Summary of the Average Available Recharge to the Dyke Groups. The assumption<br />
thus made is that the Available Recharge Volume correlates roughly to the Sustainable<br />
Yield Available from the Dolerite Dyke Groups ..................................................................... 63<br />
Table 5.2: Recharge Volume Calculation Scenarios for Dyke Group A ................................................. 63<br />
Table 5.3: Recharge Volume Calculation Scenarios for Dyke Group B ................................................. 64<br />
Table 5.4: Recharge Volume Calculation Scenarios for Dyke Group C ................................................. 64<br />
Table 5.5: Recharge Volume Calculation Scenarios for Dyke Group D ................................................. 64<br />
Table 5.6: Recharge Volume Calculation Scenarios for Dyke Group E ................................................. 65<br />
Table 5.7: Recharge Volume Calculation Scenarios for Dyke Group F ................................................. 65<br />
Table 5.8: Theoretically Estimated Dyke Group Yields or Groundwater Resource Potential<br />
based on the Geometric Mean of Sustainable Yields of Karoo Borehole Fields,<br />
see assumption section below the table for further information regarding the calculations ... 69<br />
Table 5.9: Estimation of the Borehole Field Development Cost for the Dyke Groups.<br />
Note that the Costing does not make provision for Surface Infrastructure<br />
such as Electrical Supply Lines and Pipeline Networks etc .................................................. 70<br />
Table 5.10: Coordinates of the Identified Irrigation Pivots ....................................................................... 71<br />
Table 6.1: Summary of the Average Available Recharge to the Dyke Groups. The assumption<br />
thus made is that the Available Recharge Volume correlates roughly to the Sustainable<br />
Yield available from the Dolerite Dyke Groups...................................................................... 86<br />
Table 6.2: Recharge Volume Calculation Scenarios for Dyke Group A ................................................. 86<br />
Table 6.3: Recharge Volume Calculation Scenarios for Dyke Group B ................................................. 87<br />
Table 6.4: Recharge Volume Calculation Scenarios for Dyke Group C1 & C2 ...................................... 87<br />
Table 6.5: Recharge Volume Calculation Scenarios for Dyke Group D ................................................. 87<br />
Table 6.6: Recharge Volume Calculation Scenarios for Dyke Group E ................................................. 88<br />
Appendix 4 – Groundwater Potential Study for Small Towns June 2012
Water Reconciliation Strategy Study for the Bulk Water Supply Systems: Greater Bloemfontein Area v<br />
Table 6.7: Recharge Volume Calculation Scenarios for Dyke Group F ................................................. 88<br />
Table 6.8: Theoretically Estimated Dyke Group Yields or Groundwater Resource Potential based<br />
on the Geometric Mean of Sustainable Yields of Karoo Borehole Fields, see<br />
assumption section below the table for further information regarding the calculations .......... 92<br />
Table 6.9: Estimation of the Borehole Field Development Cost for the Dyke Groups. Note that the<br />
Costing does not make provision for Surface Infrastructure such as Electrical<br />
Supply Lines and Pipeline Networks etc ............................................................................... 93<br />
Table 6.10: Coordinates of the Identified Irrigation Pivots ....................................................................... 94<br />
FIGURES<br />
Figure 2.1: Schematic Areal Distribution of Lithostratigraphic Units in the Main Karoo Basin<br />
(after Johnson et al., 1997) ..................................................................................................... 3<br />
Figure 2.2: Generalised Stratigraphy and Lithology of the Karoo Supergroup of the Main Karoo Basin<br />
(Johnson et al., 1997) ............................................................................................................. 4<br />
Figure 2.3: Groundwater Component of River Flow (base flow), Groundwater Resources of<br />
South Africa, <strong>DWA</strong>F, 1995 ...................................................................................................... 8<br />
Figure 2.4: Depth of Groundwater Level, Groundwater Resources of South Africa, <strong>DWA</strong>F, 1995 ............ 9<br />
Figure 2.5: Mean Annual Recharge, Groundwater Resources of South Africa, <strong>DWA</strong>F, 1995 ................. 10<br />
Figure 2.6: Groundwater Recharge Estimation Map (Vegter, 1995) ....................................................... 10<br />
Figure 3.1: Locality Map of the Wepener Study Area .............................................................................. 12<br />
Figure 3.2: Geological Map of the Wepener Study Area ......................................................................... 13<br />
Figure 3.3: Locality Map of the Aerial Photo Interpretations of the Wepener Study Area ........................ 14<br />
Figure 3.4: Aerial Magnetic Data Contour Map for the Wepener Area. Note that the red and yellow<br />
areas denote areas of Higher Magnetic Intensity that are associated with Dolerite Sill<br />
Intrusions. The green and blue areas refer to Sedimentary Rocks of the Beaufort Group<br />
(Karoo Supergroup) .............................................................................................................. 17<br />
Figure 3.5: Geological Map of the Wepener Study Area. The Geological Map confirms the<br />
presence of at least 31 Potential Dolerite Dykes as determined by the Aerial<br />
Photo Interpretations ............................................................................................................ 18<br />
Figure 3.6: Locality Map of the Delineated Dolerite Dyke Groups near Wepener as utilised for the<br />
Groundwater Resource Potential Estimation ........................................................................ 22<br />
Figure 3.7: Locality Map of the Estimated Mini-Catchments of the Dyke Groups near Wepener ............ 23<br />
Figure 3.8: Locality Map of the Potential High Groundwater Abstraction Areas in the vicinity of<br />
Wepener. Note that the Irrigation Pivots are situated next to the Caledon River.<br />
Therefore it is more likely that these pivots utilised Surface Water than Groundwater.<br />
It is recommended that these areas be investigated to confirm the observation ................... 27<br />
Figure 4.1: Locality Map of the Dewetsdorp Study Area ......................................................................... 34<br />
Figure 4.2: Geological Map of the Dewetsdorp Study Area .................................................................... 35<br />
Figure 4.3: Locality Map of the Aerial Photo Interpretations of the Dewetsdorp Study Area ................... 36<br />
Figure 4.4: Aerial Magnetic Data Contour Map for the Dewetsdorp Area. Note that the red and yellow<br />
areas denote areas of Higher Magnetic Intensity that are associated with Dolerite Sill<br />
Intrusions. The green and blue areas refer to Sedimentary Rocks of the Beaufort Group<br />
(Karoo Supergroup) .............................................................................................................. 38<br />
Figure 4.5: Locality Map of the Delineated Dolerite Dyke Groups near Dewetsdorp as utilised for the<br />
Groundwater Resource Potential Estimation ........................................................................ 43<br />
Figure 4.6: Locality Map of the Estimated Mini-Catchments of the Dyke Groups near Dewetsdorp ........ 44<br />
Figure 4.7: Locality Map of the Potential High Groundwater Abstraction Areas in the vicinity of<br />
Dewetsdorp. Note that the Irrigation Pivots are situated next to Non-Perennial Streams<br />
and Small Dams. Therefore it is more likely that these Pivots utilised Surface Water<br />
than Groundwater. It is recommended that these areas be investigated to confirm<br />
the observation ..................................................................................................................... 49<br />
Figure 5.1: Locality Map of the Reddersburg Study Area ....................................................................... 56<br />
Figure 5.2: Geological Map of the Reddersburg Study Area ................................................................... 57<br />
Figure 5.3: Locality Map of the Aerial Photo Interpretations of the Reddersburg Study Area .................. 59<br />
Appendix 4 – Groundwater Potential Study for Small Towns June 2012
Water Reconciliation Strategy Study for the Bulk Water Supply Systems: Greater Bloemfontein Area vi<br />
Figure 5.4: Aerial Magnetic Data Contour Map for the Reddersburg Area. Note that the red<br />
and pinkish / purple areas denote areas of Higher Nagnetic Intensity that are associated<br />
with Dolerite Sill Intrusions. The green and blue areas refer to Sedimentary Rocks<br />
of the Beaufort Group (Karoo Supergroup) ........................................................................... 60<br />
Figure 5.5: Geological Map of the Reddersburg Study Area. The Geological Map confirms the<br />
presence of at least 52 Potential Dolerite Dykes as determined by the Aerial Photo<br />
Interpretations ....................................................................................................................... 61<br />
Figure 5.6: Locality Map of the Delineated Dolerite Dyke Groups near Reddersburg as utilised<br />
for the Groundwater Resource Potential Estimation ............................................................. 66<br />
Figure 5.7: Locality Map of the estimated Mini-Catchments of the Dyke Groups near Reddersburg ...... 67<br />
Figure 5.8: Locality Map of the Potential High Groundwater Abstraction Areas in the vicinity of<br />
Reddersburg. Note that the Irrigation Pivots are situated next to the Riet River and<br />
other Non-Perennial Streams. Therefore it is more likely that these Pivots utilised Surface<br />
Water than Groundwater. It is recommended that these areas be investigated to confirm<br />
the observation ..................................................................................................................... 72<br />
Figure 6.1: Locality Map of the Edenburg Study Area ............................................................................. 79<br />
Figure 6.2: Geological Map of the Edenburg Study Area ........................................................................ 80<br />
Figure 6.3: Locality Map of the Aerial Photo Interpretations of the Edenburg Study Area ....................... 82<br />
Figure 6.4: Aerial Magnetic Data Contour Map for the Edenburg Area. Note that the yellow, red<br />
and pinkish / purple areas denote areas of higher magnetic intensity that are associated<br />
with Dolerite Sill Intrusions. The light green and blue areas refer to sedimentary<br />
rocks of the Adelaide Subgroup of the Beaufort Group (Karoo Supergroup) ........................ 83<br />
Figure 6.5: Geological Map of the Edenburg Study Area. The Geological Map confirms the<br />
Presence of at least 36 Potential Dolerite Dykes as determined by the Aerial Photo<br />
Interpretations ....................................................................................................................... 84<br />
Figure 6.6: Locality Map of the Delineated Dolerite Dyke Groups near Edenburg as utilised for the<br />
Groundwater Resource Potential Estimation ........................................................................ 89<br />
Figure 6.7: Locality Map of the Estimated Mini-Catchments of the Dyke Groups near Edenburg ........... 90<br />
Figure 6.8: Locality Map of the Potential High Groundwater Abstraction Areas in the Vicinity of<br />
Edenburg. Note that the Irrigation Pivots are situated next to the Riet River and other<br />
Non-Perennial Streams. Therefore it is more likely that these Pivots utilised Surface<br />
Water than Groundwater. It is recommended that these areas be investigated to<br />
confirm the observation ........................................................................................................ 95<br />
Appendix 4 – Groundwater Potential Study for Small Towns June 2012
Water Reconciliation Strategy Study for the Bulk Water Supply Systems: Greater Bloemfontein Area vii<br />
GLOSSARY OF TERMS<br />
GEOHYDROLOGICAL TERMS DEFINITIONS<br />
Aquiclude,<br />
Aquitards,<br />
Confined Aquifer,<br />
Diffusivity (KD/S),<br />
Hydrocensus,<br />
Hydraulic Conductivity (K),<br />
Leaky Aquifer,<br />
Porosity,<br />
Specific Yield (Sy),<br />
Storativity (S),<br />
Storativity Ratio,<br />
Sustainable Yield,<br />
Transmissivity (KD or T),<br />
Unconfined Aquifer,<br />
Recharge,<br />
An aquiclude is an impermeable geological unit that does not transmit water at all. Dense<br />
unfractured igneous or metamorphic rocks are typical aquicludes.<br />
An aquitard is a geological unit that is permeable enough to transmit water in significant<br />
quantities when viewed over large and long periods, but its permeability is not sufficient to<br />
justify production boreholes being placed in it. Clays, loams and shales are typical aquitards.<br />
A confined aquifer is bounded above and below by an aquiclude. In a confined aquifer, the<br />
pressure of the water is usually higher than thatt of the atmosphere, so that if a borehole taps<br />
the aquifer, the water in it stands above the top of the aquifer, or even above the ground<br />
surface. We then speak of a free-flowing or artesian borehole.<br />
The hydraulic diffusivity is the ratio of the transmissivity and the storativity of a saturated<br />
aquifer. It governs the propagation of chances an hydraulic head in the aqiufer. Diffusivity<br />
has the dimension of Length 2 /Time.<br />
A field survey by which all relevant information regarding groundwater is amassed. This<br />
typically includes yields, borehole equipment, groundwater levels, casing height / diameter,<br />
WGS84 coordinates, potential pollution risks, photos etc.<br />
The hydraulic conductivity is the constant of proportionality in Darcy’s law. It is defined as<br />
the volume of water that will move through a porous meduim in a unit time under a unit<br />
hydraulic gradient through a unit area measured at right angles to the direction of flow.<br />
A leaky aquifer, also known as a semi-confined aquifer, is an aquifer whose upper and lower<br />
boundaries is aquitards, or one boundary is an aquitard and the other is an aquiclude. Water<br />
is free to move through the aquitards, either upwards or downwards. If a leaky aquifer is in<br />
hydrological equilibrium, the waterlevel in a borehole tapping it may coincide with the water<br />
table.<br />
The porosity of a rock is its property of containing pores or voids. With consolidated rocks<br />
and hardrocks, a distinction is usually made between primary porosity, which is present when<br />
the rock is formed and secondary porosity, which develops later as a result of solution or<br />
fracturing.<br />
The specific yield is the volume of water that an unconfined aquifer releases from storage per<br />
unit surface area of aquifer per unit decline of the water table. The values of the specific yield<br />
range from 0.01 to 0.3 and are much higher than the storativities of confined aquifers.<br />
The storativity of a saturated confined aquifer of thickness D is the volume of water released<br />
from storage per unit surface area of the aquifer per unit decline in the component of hydraulic<br />
head normal to that surface.<br />
The storativity ratio is a parameter that controls the flow from the aquifer matrix blocks into<br />
the fractures of a confined fractured aquifer of the double-porosity type.<br />
This usually refers to a yield calcualted from aquifer test pumping by a professional<br />
geohydrologist. The yield refers to the recommended abstraction rate and pumping schedule<br />
for continues use.<br />
Transmissivity is the product of the average hydraulic conductivity K and the saturated<br />
thickness of the aquifer D. Consequently, transmissivity is the rate of flow under a unit<br />
hydraulic gradient throught a cross-section of unit width over the whole saturated thickness<br />
of the aquifer.<br />
An unconfined aquifer, also known as a water table aquifer, is bounded below by a aquiclude,<br />
but is not restricted by any confining layer above it. Its upper boundary is the water table<br />
and is free to rise and fall.<br />
Groundwater recharge or deep drainage or deep percolation is a hydrologic process where<br />
water moves downward from surface water to groundwater. This process usually occurs in<br />
the vadose zone below plant roots and is often expressed as a flux to the water table surface.<br />
Recharge occurs both naturally (through the water cycle) and anthropologically (i.e., "artificial<br />
groundwater recharge"), where rainwater and or reclaimed water is routed to the subsurface.<br />
Appendix 4 – Groundwater Potential Study for Small Towns June 2012
Water Reconciliation Strategy Study for the Bulk Water Supply Systems: Greater Bloemfontein Area viii<br />
Acronym / Abbreviation Definition<br />
CRD Cumulative Rainfall Departure.<br />
<strong>DWA</strong>F Department of Water Affairs and Forestry.<br />
GHT Geo-Hydro Technologies.<br />
magl Metres Above Ground Level.<br />
MAP Mean Annual Precipitation.<br />
mbgl Metres Below Ground Level.<br />
mamsl Metres Above Mean Sea level.<br />
SVF Saturated Volume Fluctuation.<br />
TOR Terms of Reference.<br />
VIP’s Ventilated In-Pit Latrines.<br />
WRC Water Research Commission.<br />
P:\Projects\402992 Bloem Recon\FINAL REPORTS\Appendix 4 - Groundwater Potential for Small Towns.docx<br />
Appendix 4 – Groundwater Potential Study for Small Towns June 2012
Water Reconciliation Strategy Study for the Bulk Water Supply Systems: Greater Bloemfontein Area 1<br />
1. BACKGROUND<br />
1.1 INTRODUCTION<br />
GHT Consulting was appointed by Aurecon and the Department of Water Affairs to perform a groundwater<br />
potential study for the small towns located within the study area. Groundwater potential for urban use was<br />
considered in the following towns:<br />
Wepener<br />
Dewetsdorp<br />
Reddersburg<br />
Edenburg<br />
Excelsior<br />
1.2 OBJECTIVES OF THE STUDY<br />
The objectives of the groundwater potential study are as follows:<br />
GIS geological maps (Geological Survey) will be employed to determine possible water bearing<br />
structures / lineaments for a 10 - 15 km radius around the towns<br />
Aerial photo interpretations to determine possible water bearing structures / lineaments for a 10 - 15<br />
km radius around the towns;<br />
GIS Ortho photos or will be employed to identify potential dolerite dykes structures, which<br />
are the primary drilling targets for groundwater resource development in the Karoo Super<br />
Group geology.<br />
Aerial magnetic interpretations to determine potential water bearing structures / lineaments for a 10 -<br />
15 km radius around the towns.<br />
GIS aerial magnetic data obtained from the Council for Geosciences will be employed to<br />
identify potential intrusive dolerite structures such as sills and dykes, which are the primary<br />
drilling targets for groundwater resource development in the Karoo Super Group geology.<br />
GIS map compilation wherein the identified potential water bearing structures are geo-referenced<br />
and denoted spatially;<br />
The Map Info Professional 7.5 GIS Packaged will be utilised in the compilation of the<br />
necessary locality maps.<br />
Determination of high groundwater abstraction areas in the vicinity of the identified town by means of<br />
a hydrocensus; and<br />
High groundwater abstraction areas will be determined around the towns by means aerial<br />
photographs, which include Google Earth Images and Ortho Photos. The typical features<br />
that will be observed are large scale irrigation in the absence of perennial rivers. Note that<br />
no field surveys will be employed due to budget constraints.<br />
Recharge volume estimation will be calculated based on a surface area approach assuming a 2%,<br />
3% as well as the Vegter Map recharge percentage and <strong>DWA</strong>F estimates maps of 1995. Mini subcatchments<br />
will be identified in the areas of the observed potential structures by means of<br />
topographical contours. The surface area of these mini sub-catchments will be incorporated to<br />
calculate the recharge volume to the potential structure(s). The water demand for each town will be<br />
obtained from Aurecon to determine the recharge area needed to address demand.<br />
Appendix 4 – Groundwater Potential Study for Small Towns June 2012
Water Reconciliation Strategy Study for the Bulk Water Supply Systems: Greater Bloemfontein Area 2<br />
Compilation of a Geohydrological <strong>Report</strong>, which will contain all the information generated during the<br />
study as well as conclusions and recommendations regarding the groundwater potential of the area.<br />
Note that this is a desktop study and that no fieldwork is included in the terms of reference or in the<br />
costing.<br />
Appendix 4 – Groundwater Potential Study for Small Towns June 2012
Water Reconciliation Strategy Study for the Bulk Water Supply Systems: Greater Bloemfontein Area 3<br />
2. GEOLOGY<br />
This section contains the general geology, geological logging and soil characteristics information collected<br />
during the completion of the project.<br />
2.1 LITHOSTRATIGRAPHY AND DEPOSITION HISTORY<br />
This section has been adapted from the Hydrogeology of the Main Karoo Basin, WRC <strong>Report</strong> No.<br />
TT179/02. The lithostratigraphy of the Arlington / Leratswana district consists of the following:<br />
Karoo Supergroup (refer to Figure 2.1);<br />
Beaufort Group (Upper Stage, which comprises of sedimentary rocks such as purple and green shale<br />
and mudstone).<br />
Figure 2.1: Schematic Areal Distribution of Lithostratigraphic Units in the Main Karoo Basin<br />
(after Johnson et al., 1997)<br />
Appendix 4 – Groundwater Potential Study for Small Towns June 2012
Water Reconciliation Strategy Study for the Bulk Water Supply Systems: Greater Bloemfontein Area 4<br />
Figure 2.2: Generalised Stratigraphy and Lithology of the Karoo Supergroup of the Main Karoo<br />
Basin (Johnson et al., 1997)<br />
2.2 INTRUSIVE KAROO DOLERITE<br />
Towards the end of the Cape Orogeny a thermal dome uplift developed beneath almost the entire South<br />
African continent. Dolerite intrusions represent the roots of the volcanic system and are presumed to be of<br />
the same age as the extrusive lavas (Fitch and Miller, 1984). Extensive magmatic activity lead to dolerite<br />
dykes, inclined sheets and sills to intrude the sedimentary rocks of the Karoo Supergroup during the<br />
Jurassic period to the north of the compressional sphere of the Cape Fold Belt. The level of erosion that<br />
affected the Main Karoo basin has revealed the deep portions of the intrusive system, which displays a high<br />
degree of tectonic complexity. The Karoo intrusives can either occur as dykes (linear features), sills<br />
(horizontal or inclined sheets) or ring-complexes. The Karoo dolerite, which includes a wide range of<br />
petrological facies, consists of an interconnected network of dykes and sills and it is nearly impossible to<br />
single out any particular intrusive or tectonic event. It would, however, appear that a very large number of<br />
fractures were intruded simultaneously by magma and that the dolerite intrusive network acted as a shallow<br />
stockwork-like reservoir.<br />
Early mapping of the dolerite intrusives was carried out by Rogers and Du Toit (1903) in the Western Cape<br />
and Du Toit (1905) in the Eastern Cape. Further contributions on their tectonic and structural aspects<br />
include Du Toit (1920), Mask (1966) and Walker and Poldervaart (1949). More recently the Geological<br />
Survey has published most of the 1:250 000 maps of the entire Karoo Basin. Detailed mapping of dolerite<br />
occurrences at specific localities in the southern Free State were conducted by Burger et al., (1981) and in<br />
the Western Karoo by Chevallier and Woodford (1999).<br />
Appendix 4 – Groundwater Potential Study for Small Towns June 2012
Water Reconciliation Strategy Study for the Bulk Water Supply Systems: Greater Bloemfontein Area 5<br />
In the study areas sills are the most abundant dolerite appearance and may be horizontal or slightly<br />
inclined. Geophysical data indicated also the presence of dyke structure although very few in number.<br />
2.2.1 Geometry, structure and mechanisms of emplacement of dolerite dykes<br />
Dolerite dykes are the primary targets for groundwater exploration and it is therefore important to<br />
understand the geometry, structure and mechanisms of emplacement.<br />
Emplacement Mode: Dolerite dykes, like many other magmatic intrusions, develop by rapid hydraulic<br />
fracturing via the propagation of a fluid-filled open fissure, resulting in a massive magmatic intrusion with a<br />
neat and transgressive contact with country rock. This fracturing mechanism is in contrast to the slow<br />
mode of hydraulic fracturing responsible for breccia-intrusions (i.e. kimberlite). For the intrusion to develop<br />
the magma pressure at the tip of the fissure must overcome the tensile strength of the surrounding rock.<br />
Dykes can develop vertically upwards or lateral along-strike over very long distances, as long as the<br />
magma pressure at the tip of the fissure is maintained. The intrusion of dolerite and basaltic dykes are<br />
therefore never accompanied by brecciation, deformation or shearing of the host-rock, at least during their<br />
propagation.<br />
Dyke Attitude: All the dykes are sub-vertical with a dip rarely below 70 degrees. Kruger and Kok (1976)<br />
reports dips of dykes in the north eastern Free State varying between 65 to 90 degrees. The attitude of<br />
dykes often change with depth (i.e. are curved or dislocated), as observed from many detailed borehole<br />
logs. This phenomenon can be attributed to vertical offsetting as a result of vertical en-échelon<br />
segmentation or due to interconnecting of dykes between sediment layers.<br />
Dyke Width: The average thickness of Karoo dolerite dykes ranges between 2 and 10 m (Woodford and<br />
Chevallier, 2001). In general, the width of a dyke is a function of its length. In other words, the wider a<br />
dyke is, the longer it will be (this probably also applies to the vertical extension of the feature). For<br />
example, the major E-W dykes of Western Karoo Domain can attain widths of up to 70 m, while the<br />
Middelburg dyke is 80 m wide. The radiating E-W dykes of Eastern Karoo have widths of up to 300 m in<br />
places. No relationship has been found between trend and thickness (Woodford and Chevallier, 2001).<br />
En-échelon Pattern: Dolerite dykes often exhibit an en-échelon pattern along strike, which are clearly<br />
detected by mapping. This is especially the case with the E-W shear dykes and their associated riedelshears.<br />
Displacements in the vertical section also occur, often associated with horizontal, transgressive<br />
fracturing. These offsets are often observed, except through drilling.<br />
Dyke Related Fracturing: The country rock is often fractured during and after dyke emplacement. These<br />
fractures form a set of master joints parallel to its strike over a distance that does not vary greatly with the<br />
thickness of the dyke (between 5 and 15 m). The dolerite dykes are also affected by thermal- or columnar-<br />
jointing perpendicular to their margins. These thermal joints also ex tends into the host rock over a<br />
distance not exceeding 0.3 to 0.5 m from the contact. Van Wyk (1963) observed two types of jointing<br />
associated with dyke intrusions in a number of coal mines in the Vryheid Dundee area, namely:<br />
Three sets of pervasive-thermal, columnar joints that are approximately 120 degrees apart; and<br />
Joints parallel to the contact, confined mainly to the host rock alongside the dyke.<br />
Many cases of tectonic reactivation of the dolerite have been observed in the Loxton-Victoria West area<br />
(Woodford and Chevallier, 2001), especially on the N-S dykes that have been reactivated by cretaceous<br />
kimberlite activity or by more recent master jointing. Reactivation often results in sub-vertical fissures within<br />
the country rock and/or dyke itself, which are commonly highly weathered and filled with secondary<br />
calcite/calcrete (width of up to 150 mm) uplifting or brecciation of the sediment along the dyke contact.<br />
Deformation and Contact Metamorphism of Host Rock: Localised upwarping of the country rock is often<br />
Appendix 4 – Groundwater Potential Study for Small Towns June 2012
Water Reconciliation Strategy Study for the Bulk Water Supply Systems: Greater Bloemfontein Area 6<br />
observed adjacent to dipping dykes. Hydraulic fissure propagation, as mentioned above, cannot be<br />
responsible for this phenomena, as the magma would have to be cool and become viscous in order cause<br />
such deformation. This upwarping of the country rock is commonly a near-surface phenomenon related to<br />
supergene formation of clays with a high expansion coefficient resulting in the ‘swelling’ of rock mass. In<br />
nearly every case, the dolerite magma shows marked chilling against the sediments into which it has been<br />
injected. The chill zone generally exhibits the effects of contact metamorphism, where argillites are altered<br />
to hornfels or lydianite and arenaceous units are crystallised to quartzite. Enslin (1951) and Van Wyk<br />
(1963) state that the jointed contact zone is less than 30 c wide, irrespectively of dyke thickness.<br />
Petrography and Dyke Weathering: The effect of variable cooling of dykes following intrusion is also<br />
apparent in the way which dykes weather in the Western Karoo, namely:<br />
Thick dykes (>8 m) generally exhibit a prominent chill-margin containing a fine grained, porphyritic,<br />
melanocratic dolerite that weathers to produce well-rounded, small, white-speckled boulders (i.e.<br />
spheroidal weathering). This zone is normally only 0.5 to 1.5 m wide and exhibits well-developed<br />
thermal-shrinkage joints. The central portion of such dykes consist of medium to coarse grained,<br />
mesocratic and occasionally leucocratic dolerite that decomposes to a uniform ‘gravely’ material,<br />
which exhibits an exfoliation type of pattern. Sporadic fractures or meta-sedimentary veins are<br />
encountered in this zone and they often do not extend into the country rock. Magnetic traverses<br />
across these features normally produce two distinctive peaks.<br />
Thin dykes (
Water Reconciliation Strategy Study for the Bulk Water Supply Systems: Greater Bloemfontein Area 7<br />
2.3.2 Dolerite intrusions<br />
Extensive weathered zones often develop in dolerite sills that are situated in low lying and well drained<br />
areas – ‘similar to weathered basins’ described in other crystalline basement rocks (Enslin, 1943; Wright<br />
and Burgess, 1992). These localised, shallow intergranular aquifers are capable of storing large volumes<br />
of groundwater. Although abstraction from these dense-massive structures are only possible where<br />
extensive weathering has occurred at depth (below the aquifer water table).<br />
Dolerite ring-dykes and inclined sheets seldom form negative features of the landscape, as they are more<br />
resistant to weathering. The hydrological properties weathered dolerite rings and inclined sheets seem<br />
very variable. Vegter (1995) states that the upper or lower contact sills located within the weathered zone,<br />
i.e. 20 to 50 mbgl, are favourable zones for striking groundwater. Recent extensive exploration drilling<br />
along dolerite inclined sheets and ring dykes in the Victoria West area (Chevallier et al., 2001), shows that<br />
the contact between the sediment and the dolerite within the first 50 m below surface did not yield<br />
significant volumes of groundwater.<br />
The contact between dolerite dykes and the host rock, within the weathered zone, remains the most<br />
important target for groundwater exploration (Vegter, 1995 & Smart, 1998).<br />
2.4 HYDROSTRATIGRAPHY OF THE BEAUFORT GROUP<br />
The main sediment source area for the Beaufort rocks lay along the high-lying, southern margin of the<br />
Basin. The coarser grained rocks are, therefore, found near the Cape Fold Belt (alluvial fan and braided<br />
stream environments), while mudstone, shale and fine-grained sandstones dominate the more distal central<br />
and northern portion (meandering river and floodplain environment) of the Basin. The sedimentary units in<br />
the Group therefore usually have very low primary permeabilities. The geometry of these aquifers is<br />
complicated by the lateral migration of meandering streams over a floodplain. Aquifers in the Beaufort<br />
Group will thus not only be multi-layered, but also multi-porous with variable thicknesses.<br />
The contact plane between two different sedimentary layers will cause a discontinuity in the hydraulic<br />
properties of the composite aquifer. The pumping of a multi-layered aquifer will thus cause the piezometric<br />
pressure in the more permeable layers to drop faster than in the less permeable layers. It is therefore<br />
possible to completely extract the more permeable layers of the multi-layered Beaufort aquifers, without<br />
materially affecting the piezometric pressure in the less permeable layers. This complex behaviour of<br />
aquifers in the Beaufort Group is further complicated by the fact that many of the coarser, and thus more<br />
permeable, sedimentary bodies are lens-shaped. The life-span of a high-yielding borehole in the Beaufort<br />
Group may therefore be limited, if the aquifer is not recharged frequently.<br />
2.5 GENERAL AQUIFER INFORMATION<br />
The following section is based on the Groundwater Resources of South Africa Maps, <strong>DWA</strong>F, 1995. The<br />
groundwater component of river flow (base flow) is 0 – 10 mm/a in the Wepener district (refer to Figure<br />
2.3). The groundwater depth in the study area is approximately 10 – 20 mbgl (standard deviation range<br />
from mean is between 8 – 15 m), refer to Figure 2.4. The mean annual recharge of the area are between<br />
25 - 37 mm/a (refer to Figure 2.5). In general the recommended drilling depths are 20 to 30 metres or<br />
deeper for the study area. The storage types of the aquifer quantified as fractures restricted principally to a<br />
zone below the groundwater level. Pores in disintegrated / decomposed, partly decomposed rock and<br />
fractures which are principally restricted to a zone directly below the groundwater level. Storage coefficient<br />
in order of magnitude for the study area is 0.001 to 0.01.<br />
Appendix 4 – Groundwater Potential Study for Small Towns June 2012
Water Reconciliation Strategy Study for the Bulk Water Supply Systems: Greater Bloemfontein Area 8<br />
Figure 2.3: Groundwater Component of River Flow (base flow), Groundwater Resources of<br />
South Africa, <strong>DWA</strong>F, 1995<br />
Appendix 4 – Groundwater Potential Study for Small Towns June 2012
Water Reconciliation Strategy Study for the Bulk Water Supply Systems: Greater Bloemfontein Area 9<br />
Figure 2.4: Depth of Groundwater Level, Groundwater Resources of South Africa, <strong>DWA</strong>F, 1995<br />
Appendix 4 – Groundwater Potential Study for Small Towns June 2012
Water Reconciliation Strategy Study for the Bulk Water Supply Systems: Greater Bloemfontein Area 10<br />
Figure 2.5: Mean Annual Recharge, Groundwater Resources of South Africa, <strong>DWA</strong>F, 1995<br />
Figure 2.6: Groundwater Recharge Estimation Map (Vegter, 1995)<br />
Appendix 4 – Groundwater Potential Study for Small Towns June 2012
Water Reconciliation Strategy Study for the Bulk Water Supply Systems: Greater Bloemfontein Area 11<br />
3. WEPENER<br />
The study area is located in the north eastern part of the Free State Province in Water Management Area<br />
13. The study area is also located in Drainage Area D, Quaternary sub-catchment D23G and D23J<br />
(Surface Water Resources of South Africa, First Edition, 1994). The locality map of the Wepener study area<br />
can be viewed in Figure 3.1.<br />
3.1 CLIMATE<br />
The investigated area has hot summers and cool winters, and a predominantly summer rainfall. The air<br />
temperatures range from an average maximum of 30 to 32 o C in January to an average minimum of 0 to 2<br />
o C in July, meaning conditions with hot summers and cold winters (South African Atlas of Agrohydrology<br />
and –Climatology, 1997).<br />
Wepener has no rainfall station, therefore the rainfall for Dewetsdorp is assumed for Wepener. Dewetsdorp<br />
is located approximately 35 km away from Wepener in a north westerly direction. The mean annual rainfall<br />
is 592.7 mm/a, which occurs mainly as thunderstorms but soft rains also do occur (Rainfall Station Gauge<br />
No.: 0232 275, Dewetsdorp Police Station, Surface Water Resources of South Africa, 1990).<br />
3.2 GEOLOGY<br />
3.2.1 General aquifer information of the Wepener District<br />
The following section is based on the Groundwater Resources of South Africa Maps, <strong>DWA</strong>F, 1995.<br />
The groundwater component of river flow (base flow) is 0 – 10 mm/a in the Wepener district (refer to<br />
Figure 2.3). The groundwater depth in the study area is approximately 10 – 20 mbgl (standard deviation<br />
range from mean is between 8 – 15 m), refer to Figure 2.4. The mean annual recharge of the area are<br />
between 25 - 37 mm/a (refer to Figure 2.5).<br />
In general the recommended drilling depths are 20 to 30 metres or deeper for the study area. The storage<br />
types of the aquifer quantified as fractures restricted principally to a zone below the groundwater level.<br />
Pores in disintegrated / decomposed, partly decomposed rock and fractures which are principally restricted<br />
to a zone directly below the groundwater level. Storage coefficient in order of magnitude for the study area<br />
is 0.001 to 0.01.<br />
Appendix 4 – Groundwater Potential Study for Small Towns June 2012
Water Reconciliation Strategy Study for the Bulk Water Supply Systems: Greater Bloemfontein Area 12<br />
Figure 3.1: Locality Map of the Wepener Study Area<br />
Appendix 4 – Groundwater Potential Study for Small Towns June 2012
Water Reconciliation Strategy Study for the Bulk Water Supply Systems: Greater Bloemfontein Area 13<br />
Figure 3.2: Geological Map of the Wepener Study Area<br />
Appendix 4 – Groundwater Potential Study for Small Towns June 2012
Water Reconciliation Strategy Study for the Bulk Water Supply Systems: Greater Bloemfontein Area 14<br />
Figure 3.3: Locality Map of the Aerial Photo Interpretations of the Wepener Study Area<br />
Appendix 4 – Groundwater Potential Study for Small Towns June 2012
Water Reconciliation Strategy Study for the Bulk Water Supply Systems: Greater Bloemfontein Area 15<br />
3.3 GROUN<strong>DWA</strong>TER POTENTIAL INVESTIGATION<br />
This section includes the geophysical information obtained during the survey to detect possible geological<br />
features and structures, which may act as preferential pathways for groundwater flow, which may act as<br />
target areas for groundwater exploration for water supply purposes.<br />
3.3.1 Aerial photo interpretation<br />
The aerial photo interpretation of the Wepener study area revealed 31 potential dolerite dyke structures that<br />
can be verified by means of geophysical methods and percussion drilling. The dolerite dyke structures are<br />
considered the primary targets for groundwater exploration in the Karoo Supergroup geology. The aerial<br />
photo map of the study area can be viewed in Figure 3.3.<br />
3.4 AERIAL MAGNETIC DATA INTERPRETATIONS<br />
3.4.1 The Magnetic Method<br />
The magnetic geophysical method proved an effective method for the detection of dolerite structures, which<br />
includes dykes and sills.<br />
The normal magnetic field of the earth can be visualised as a field of a bar magnet placed at the centre of<br />
the earth. Any changes in this "normal" magnetic field superimposed by dykes, for example, can be<br />
measured by a magnetometer. These measurements (changes) in magnetism can then, through the<br />
process of modelling, be interpreted in terms of the dip, strike, depth and width of the body that causes the<br />
anomaly. Since these geological magnetic features might be remnant (i.e. permanently) magnetised, a<br />
feature, which is normally not known to the modeller, no unique solution of the model exists. By making<br />
certain reasonable assumptions about the geology, restrictions can be placed on some of the geological<br />
features of the body. The magnetic method is an extremely useful method to map of dykes, which are good<br />
groundwater exploration targets.<br />
3.4.2 The Aerial Magnetic Method<br />
Airborne magnetic surveys can encompass large areas in a relatively short period of time, using helicopters<br />
or low flying aircraft trailing a magnetometer. Although these surveys do not have the same spatial<br />
resolution of ground surveys, they are invaluable for tracing larger structural features, and especially major<br />
dyke intrusions into the Karoo sediments. The entire Karoo basin has been covered by aeromagnetic<br />
surveys, which were carried out on behalf of the Council for Geoscience and are available on digital format.<br />
Airborne magnetometers all measure the total magnetic field and are of two main types, fluxgate<br />
magnetometers and proton magnetometers. The fluxgate magnetometer which measures the field relative<br />
to a selected datum uses two systems of coils, one, much as in ground magnetometers, measures the<br />
relative field, while the second system of coils together with associate electronics and motor driven gimbals<br />
maintains the measuring coil in the direction of the total magnetic field irrespective of aircraft heading and<br />
attitude. The proton magnetometer measures the absolute value of the total field and needs no<br />
sophisticated orient mechanism. Proton magnetometers are favoured in most recent installations. There<br />
are other more sensitive magnetometers used in petroleum surveys.<br />
The sensing head of the magnetometer is either carried in an extended “stinger” on the tail, mounted on the<br />
wingtip or is towed in a “bird” to keep the measuring elements away from the magnetic influence of the<br />
aircraft.<br />
Magnetic data is recorded continuously during flight on a paper recorder, magnetic tape or electronically.<br />
The flight path of the aircraft is recorded by photographing the ground traversed with a special 35 mm<br />
Appendix 4 – Groundwater Potential Study for Small Towns June 2012
Water Reconciliation Strategy Study for the Bulk Water Supply Systems: Greater Bloemfontein Area 16<br />
camera. Numbered timing marks, known as fiducials, are recorded on both the film and on the paper<br />
record (or magnetic tape) on which the magnetic data appears. A radio altimeter records the aircraft height<br />
above ground and feeds height information to the pilot. The aircraft is navigated with the aid of existing<br />
aerial photographs, large scale maps or by using electronic navigational aids. The sensitivity of the<br />
airborne magnetometers is in the order of 0.5 to 1 nT.<br />
3.4.3 Results of the aerial magnetic data interpretation<br />
The aerial magnetic map revealed numerous dolerite sill intrusions in the study area (refer to Figure 3.4).<br />
The study area is located on the sedimentary rocks of the Beaufort Group of the Karoo Supergroup. The<br />
green and blue areas on the aerial magnetic contour map denote sedimentary rocks. Dolerite intrusives<br />
such as dykes and sill structures are denoted as the red and yellow areas of the aerial magnetics map.<br />
The available aerial magnetic data available for the study area are of a low resolution, which brings about<br />
that the smaller dolerite dyke structures occurring within the area cannot be detected due to the spacing of<br />
the flight lines for the aerial magnetic survey. The potential dolerite dykes denoted on the aerial magnetics<br />
map was determined by means of aerial photo interpretations as well as geological maps.<br />
3.4.4 Geological map interpretations<br />
The geological map interpretation of the Wepener study area revealed 31 potential dolerite dyke structures,<br />
which confirms the aerial photo interpretations, which also indicated the potential presence of these dolerite<br />
structures. The aerial photo map of the study area can be viewed in Figure 3.5.<br />
Appendix 4 – Groundwater Potential Study for Small Towns June 2012
Water Reconciliation Strategy Study for the Bulk Water Supply Systems: Greater Bloemfontein Area 17<br />
Figure 3.4: Aerial Magnetic Data Contour Map for the Wepener Area. Note that the red and yellow areas denote areas of Higher Magnetic Intensity that are associated with Dolerite Sill Intrusions. The green and blue areas<br />
refer to Sedimentary Rocks of the Beaufort Group (Karoo Supergroup)<br />
Appendix 4 – Groundwater Potential Study for Small Towns June 2012
Water Reconciliation Strategy Study for the Bulk Water Supply Systems: Greater Bloemfontein Area 18<br />
Figure 3.5: Geological Map of the Wepener Study Area. The Geological Map confirms the presence of at least 31 Potential Dolerite Dykes as determined by the Aerial Photo Interpretations<br />
Appendix 4 – Groundwater Potential Study for Small Towns June 2012
Water Reconciliation Strategy Study for the Bulk Water Supply Systems: Greater Bloemfontein Area 19<br />
3.5 RECHARGE WATER BUDGET CALCULATIONS AND ESTIMATED<br />
THEORETICAL YIELDS OF POTENTIAL DYKE STRUCTURES<br />
The following section evaluates the theoretical groundwater resource potential of the identified potential<br />
dolerite dyke structures by means of recharge water budget calculations based on potential minicatchments<br />
of dolerite dyke groups as well as theoretical yields of the structures based on average<br />
sustainable yield calculations by means of aquifer test pumping of borehole fields in the Karoo Super Group<br />
geology.<br />
Note that these resource potential calculations are only rough approximations of the potential sustainable<br />
yield volumes. The only method of determining the sustainable yield volume of a dolerite structure(s) is by<br />
geophysical siting, percussion drilling and aquifer test pumping of the borehole(s). Long-term groundwater<br />
monitoring is also important to observed and understand the aquifer dynamics. After sufficient data is<br />
generated a numerical model flow may be constructed to determine the capture zones of the individual<br />
boreholes as well as the capture zone of the well field as a whole.<br />
3.5.1 Recharge water budget calculations<br />
The estimate recharge volume scenarios are based on a 2% and a 3% recharge percentages of the annual<br />
mean rainfall (592.7 mm/a, Surface Water Resources of South Africa, 1990) as well as recharge<br />
estimations according to the Groundwater Resources of South Africa (<strong>DWA</strong>F, 1995) and the Vegter<br />
Recharge Map (1995). The recharge maps can be viewed in Figure 2.5 and Figure 2.6.<br />
It must be noted that the recharge volume calculations are only estimates of recharge to the estimated minicatchments<br />
of the dyke groups as delineated in Figure 3.6 and Figure 3.7. The aim of the recharge<br />
volume calculations is to estimate the available recharge volume available to the dyke groups in the study<br />
area. The assumption thus made is that the available recharge volume correlates roughly to the<br />
sustainable yield available from the dolerite dyke groups. This method is only a rough approximation of<br />
potential sustainable yields due to that the sustainability of the intrusive structure is a function of the capture<br />
zone, which in turn entails the dynamics of the aquifer system (The Water budget Myth Revisited; Why<br />
Hydrogeologists Model, Bredehoeft, 2002). The main tool for investigating the capture zone and aquifer<br />
dynamics is the numerical groundwater model. Unfortunately not enough geohydrological information<br />
exists in terms of aquifer parameters to construct such a model. Therefore only rough estimation can be<br />
made regarding the groundwater resource potential.<br />
The results of the groundwater resource potential estimations based on recharge volume scenarios are as<br />
follows (the summary of the recharge volumes can be studied in Table 3.1):<br />
Estimated groundwater resource potential is estimated for Dyke Group A as approximately 658 m 3 /d<br />
(refer to Table 3.2).<br />
Estimated groundwater resource potential is estimated for Dyke Group B as approximately 7 651<br />
m 3 /d (refer to Table 3.3).<br />
Estimated groundwater resource potential is estimated for Dyke Groups C as approximately 743 m 3 /d<br />
(refer to Table 3.4).<br />
Estimated groundwater resource potential is estimated for Dyke Group D as approximately 1 370<br />
m 3 /d (refer to Table 3.5).<br />
The estimated high growth scenario for the average annual daily water demand for Wepener was<br />
obtained from Aurecon and is 2 871 m 3 /d or kl/d. The estimated recharge area needed to address<br />
the above demand is approximately 30.4 km 2 .<br />
Appendix 4 – Groundwater Potential Study for Small Towns June 2012
Water Reconciliation Strategy Study for the Bulk Water Supply Systems: Greater Bloemfontein Area 20<br />
Table 3.1. Summary of the average available recharge to the Dyke Groups. The assumption<br />
thus made is that the available recharge volume correlates roughly to the<br />
sustainable yield available from the Dolerite Dyke groups.<br />
Dyke Group Name<br />
Average Recharge Available To Dyke Groups<br />
Estimation of Recharge Volume<br />
(m 3 /a)<br />
Estimation of Recharge Volume<br />
(m 3 /d)<br />
Dyke Group A 240 186 658<br />
Dyke Group B 2 792 741 7 651<br />
Dyke Group C 271 132 743<br />
Dyke Group D 499 899 1 370<br />
Total 3 803 959 10 422<br />
Assumptions:<br />
* Note that the recharge volume calculations are a function of the mean annual rainfall of the area,<br />
recharge percentage assigned and the surface area of the dyke group catchment. Also note that the<br />
estimated available recharge to the aquifer is only available for abstraction purposes if sufficient<br />
dolerite dykes structures and associated fractures are available in geology of the site aquifer.<br />
* Note the average recharge volumes in this table are based on the recharge percentages as obtained<br />
from the Vegter Maps and <strong>DWA</strong>F Groundwater Resources of South Africa Maps.<br />
Table 3.2: Recharge Volume Calculation Scenarios for Dyke Group A<br />
Dyke Group<br />
Name<br />
Dyke Group A<br />
Assumptions:<br />
Recharge Scenario<br />
Estimation of Dyke<br />
Group Catchment Area<br />
(m 2 )<br />
Average Rainfall<br />
(mm/a)<br />
Recharge<br />
Percentage<br />
(%)<br />
Recharge<br />
(mm/a)<br />
Estimation of<br />
Recharge Volume<br />
(m 3 /a)<br />
Estimation of<br />
Recharge Volume<br />
(m 3 /d)<br />
2% Recharge 6 962 000 592.7 2.0 12 82 528 226<br />
3% Recharge 6 962 000 592.7 3.0 18 123 791 339<br />
Vegter Map Recharge,<br />
(32 mm/a)<br />
<strong>DWA</strong>F, Groundwater<br />
Resources of SA Recharge (37 mm/a)<br />
6 962 000 592.7 5.4 32.00 222 762 610<br />
6 962 000 592.7 6.2 37.00 257 610 706<br />
Average:<br />
(Vegter Map & <strong>DWA</strong>F, SA GW Resources)<br />
* Note that the recharge volume calculations are a function of the mean annual rainfall of the area, recharge percentage assigned and the surface area of the dyke group<br />
catchment. Also note that the estimated available recharge to the aquifer is only available for abstraction purposes if sufficient dolerite dykes structures and associated<br />
fractures are available in geology of the site aquifer.<br />
Appendix 4 – Groundwater Potential Study for Small Towns June 2012<br />
658
Water Reconciliation Strategy Study for the Bulk Water Supply Systems: Greater Bloemfontein Area 21<br />
Table 3.3: Recharge Volume Calculation Scenarios for Dyke Group B<br />
Dyke Group<br />
Name<br />
Dyke Group B<br />
Recharge Scenario<br />
Estimation of Dyke<br />
Group Catchment Area<br />
(m 2 )<br />
Average Rainfall<br />
(mm/a)<br />
Recharge<br />
Percentage<br />
(%)<br />
Recharge<br />
(mm/a)<br />
Table 3.4: Recharge Volume Calculation Scenarios for Dyke Group C<br />
Table 3.5: Recharge Volume Calculation Scenarios for Dyke Group D<br />
Estimation of<br />
Recharge Volume<br />
(m 3 /a)<br />
Estimation of<br />
Recharge Volume<br />
(m 3 /d)<br />
2% Recharge 80 950 000 592.7 2.0 12 959 581 2 629<br />
3% Recharge 80 950 000 592.7 3.0 18 1 439 372 3 943<br />
Vegter Map Recharge,<br />
(32 mm/a)<br />
<strong>DWA</strong>F, Groundwater<br />
Resources of SA Recharge (37 mm/a)<br />
80 950 000 592.7 5.4 32 2 590 150 7 096<br />
80 950 000 592.7 6.2 37 2 995 333 8 206<br />
Average:<br />
(Vegter Map & <strong>DWA</strong>F, SA GW Resources)<br />
Assumptions:<br />
* Note that the recharge volume calculations are a function of the mean annual rainfall of the area, recharge percentage assigned and the surface area of the dyke group<br />
catchment. Also note that the estimated available recharge to the aquifer is only available for abstraction purposes if sufficient dolerite dykes structures and associated<br />
fractures are available in geology of the site aquifer.<br />
Dyke Group<br />
Name<br />
Dyke Group C<br />
Recharge Scenario<br />
Estimation of Dyke<br />
Group Catchment Area<br />
(m 2 )<br />
Average Rainfall<br />
(mm/a)<br />
Recharge<br />
Percentage<br />
(%)<br />
Recharge<br />
(mm/a)<br />
Estimation of<br />
Recharge Volume<br />
(m 3 /a)<br />
Appendix 4 – Groundwater Potential Study for Small Towns June 2012<br />
7 651<br />
Estimation of<br />
Recharge Volume<br />
(m 3 /d)<br />
2% Recharge 7 859 000 592.7 2.0 12 93 161 255<br />
3% Recharge 7 859 000 592.7 3.0 18 139 741 383<br />
Vegter Map Recharge,<br />
(32 mm/a)<br />
<strong>DWA</strong>F, Groundwater<br />
Resources of SA Recharge (37 mm/a)<br />
7 859 000 592.7 5.4 32 251 464 689<br />
7 859 000 592.7 6.2 37 290 801 797<br />
Average:<br />
(Vegter Map & <strong>DWA</strong>F, SA GW Resources)<br />
Assumptions:<br />
* Note that the recharge volume calculations are a function of the mean annual rainfall of the area, recharge percentage assigned and the surface area of the dyke group<br />
catchment. Also note that the estimated available recharge to the aquifer is only available for abstraction purposes if sufficient dolerite dykes structures and associated<br />
fractures are available in geology of the site aquifer.<br />
Dyke Group<br />
Name<br />
Dyke Group D<br />
Recharge Scenario<br />
Estimation of Dyke<br />
Group Catchment Area<br />
(m 2 )<br />
Average Rainfall<br />
(mm/a)<br />
Recharge<br />
Percentage<br />
(%)<br />
Recharge<br />
(mm/a)<br />
Estimation of<br />
Recharge Volume<br />
(m 3 /a)<br />
743<br />
Estimation of<br />
Recharge Volume<br />
(m 3 /d)<br />
2% Recharge 14 490 000 592.7 2.0 12 171 764 471<br />
3% Recharge 14 490 000 592.7 3.0 18 257 647 706<br />
Vegter Map Recharge,<br />
(32 mm/a)<br />
<strong>DWA</strong>F, Groundwater<br />
Resources of SA Recharge (37 mm/a)<br />
14 490 000 592.7 5.4 32 463 635 1 270<br />
14 490 000 592.7 6.2 37 536 163 1 469<br />
Average:<br />
(Vegter Map & <strong>DWA</strong>F, SA GW Resources)<br />
Assumptions:<br />
* Note that the recharge volume calculations are a function of the mean annual rainfall of the area, recharge percentage assigned and the surface area of the dyke group<br />
catchment. Also note that the estimated available recharge to the aquifer is only available for abstraction purposes if sufficient dolerite dykes structures and associated<br />
fractures are available in geology of the site aquifer.<br />
1 370
Water Reconciliation Strategy Study for the Bulk Water Supply Systems: Greater Bloemfontein Area 22<br />
Figure 3.6: Locality Map of the Delineated Dolerite Dyke Groups near Wepener as utilised for the Groundwater Resource Potential Estimation<br />
Appendix 4 – Groundwater Potential Study for Small Towns June 2012
Water Reconciliation Strategy Study for the Bulk Water Supply Systems: Greater Bloemfontein Area 23<br />
Figure 3.7: Locality Map of the Estimated Mini-Catchments of the Dyke Groups near Wepener<br />
Appendix 4 – Groundwater Potential Study for Small Towns June 2012
Water Reconciliation Strategy Study for the Bulk Water Supply Systems: Greater Bloemfontein Area 24<br />
3.6 ESTIMATION OF THEORETICAL POTENTIAL YIELD OF THE DOLERITE<br />
DYKE STRUCTURES<br />
The theoretical potential yield or groundwater resource potential estimation of the dolerite dyke structure in<br />
this section is based on the geometric mean of sustainable yield calculations of borehole fields in the Karoo<br />
Super Group geology. The aquifer test data for the geometric mean utilised were taken from the borehole<br />
fields of Petrusburg, Philipstown, Edenville, Colesberg, Igomotseng, Winburg, Brandfort and the Drie<br />
Susters Area<br />
The groundwater resource potential is calculated by utilising the above mentioned geometric mean of 60.48<br />
m 3 /d per borehole or 2.1 L/s per borehole based on an 8-hour pump cycle and 16-hour recovery period per<br />
day. The lengths of the potential structures were taken into account whereby a borehole was spaced on<br />
the structure every 250 metres. Therefore the number of the boreholes that can be spaced on the structure<br />
multiplied by the geometric mean (2.1 L/s over 8-hours a day) is equal to the estimated groundwater<br />
resource potential of the dolerite dyke structure.<br />
The assumptions of the method are as follows:<br />
That potential dolerite dykes are water bearing.<br />
An average geometric mean sustainable yield of 60.48 m3/d or 2.1 L/s with an 8-hour pump schedule<br />
and a 16 hour recovery period per borehole (Geometric mean average obtained from borehole fields<br />
of Petrusburg, Philipstown, Edenville, Colesberg, Igomotseng, Winburg, Brandfort and the Drie<br />
Susters Area).<br />
Spacing of the boreholes every 250 m along the strike of the dolerite dyke structure (note that no<br />
boreholes are placed at the end points of the structures).<br />
The results of the potential yields of the dolerite dyke groups based on the geometric mean of sustainable<br />
yield calculations are as follows (refer to Figure 3.6 as well as Table 3.6):<br />
The groundwater resource potential for Dyke Group A is estimated at 847 m 3 /d. The number of<br />
dykes of the dolerite group is 3 with a combined length of 5.0 km upon, which 14 potential boreholes<br />
are spaced for calculation purposes.<br />
The groundwater resource potential for Dyke Group B is estimated at 12 761 m 3 /d. The number of<br />
dykes of the dolerite group is 17 with a combined length of 62.60 km upon, which 211 potential<br />
boreholes are spaced for calculation purposes.<br />
The groundwater resource potential for Dyke Group C is estimated at 1 210 m 3 /d. The number of<br />
dykes of the dolerite group is 4 with a combined length of 7.0 km upon, which 20 potential boreholes<br />
are spaced for calculation purposes.<br />
The groundwater resource potential for Dyke Group D is estimated at 1 331 m 3 /d. The number of<br />
dykes of the dolerite group is 5 with a combined length of 8.0 km upon, which 22 potential boreholes<br />
are spaced for calculation purposes.<br />
Appendix 4 – Groundwater Potential Study for Small Towns June 2012
Water Reconciliation Strategy Study for the Bulk Water Supply Systems: Greater Bloemfontein Area 25<br />
Table 3.6: Theoretically estimated Dyke Group yields or groundwater resource potential based<br />
on the geometric mean of sustainable yields of Karoo Borehole Fields, see<br />
assumption section below the table for further information regarding the<br />
calculations<br />
Dyke Group<br />
Name<br />
Theoretically Estimated Dyke Group Yields (Geomean)<br />
Number of<br />
Dykes<br />
Total Length<br />
of Dykes<br />
(km)<br />
Number of Potential<br />
Boreholes<br />
(250 m Spacing)<br />
Estimated Yield<br />
of Dyke Groups<br />
(m 3 /d)<br />
A 3 5.00 14 847<br />
B 17 62.60 211 12 761<br />
C 4 7.00 20 1 210<br />
D 5 8.00 22 1 331<br />
Total 29 82.6 267 16 148<br />
Assumptions:<br />
* That potential dolerite dykes are water bearing.<br />
* An average geomean sustainable yield of 60.48 m<br />
* Refer to Dyke Group Map for the spatial localities.<br />
3 /d base on a 2.1 L/s with a 8-hour<br />
pump schedule and a 14 recovery period per borehole (Geomean average obtained from<br />
borehole fields of Petrusburg, Philipstown, Edenville, Colesberg, Igomotseng, Winburg,<br />
Brandfort and the Drie Susters Area).<br />
* Spacing of the boreholes every 250 m along the strike of the dolerite dyke structure<br />
(note that no boreholes are placed at the end points of the structures).<br />
3.7 SUMMARY OF THE RESULTS – GROUN<strong>DWA</strong>TER RESOURCE POTENTIAL<br />
OF THE INTRUSIVE DOLERITE STRUCTURES<br />
This section combines the groundwater potential estimation, which includes the recharge based approach<br />
as the lower boundary and the geometric mean approach as the upper boundary of the estimated<br />
groundwater potential range. The summary of the estimated groundwater resource potential for the<br />
delineated dyke groups are as follows (refer to Figure 3.6):<br />
The groundwater resource potential for Dyke Group A is estimated in the order of between 658 to<br />
847 m 3 /d.<br />
The groundwater resource potential for Dyke Group B is estimated in the order of between 7 651 to<br />
12 761 m 3 /d.<br />
The groundwater resource potential for Dyke Group C is estimated in the order of between 743 to<br />
1 210 m 3 /d.<br />
The groundwater resource potential for Dyke Group D is estimated in the order of between 1 331 to<br />
1 370 m 3 /d.<br />
3.7.1 Cost estimate of developing the proposed borehole fields<br />
The estimated costing for developing the proposed borehole fields only includes the cost for the<br />
geophysical siting, percussion drilling, aquifer test pumping, pump equipment and pump house structure<br />
costs of the proposed borehole fields and does not include the cost of the surface infrastructure such as the<br />
electrical supply lines and pipeline networks and associated reservoirs etc. The estimated costs for<br />
developing the borehole fields are as follows (refer to Table 3.7):<br />
The estimated cost for the development of the borehole field for Dyke Group A is R 2 576 000<br />
The estimated cost for the development of the borehole field for Dyke Group B is R 37 769 000<br />
Appendix 4 – Groundwater Potential Study for Small Towns June 2012
Water Reconciliation Strategy Study for the Bulk Water Supply Systems: Greater Bloemfontein Area 26<br />
The estimated cost for the development of the borehole field for Dyke Group C is R 3 580 000<br />
The estimated cost for the development of the borehole field for Dyke Group D is R 3 938 000<br />
Table 3.7: Estimation of the Borehole Field Development Cost for the Dyke Groups. Note that<br />
the costing does not make provision for Surface Infrastructure such as Electrical<br />
Supply Lines and Pipeline Networks etc.<br />
Dyke Group<br />
Name<br />
Number of<br />
Boreholes to be<br />
Developed<br />
Estimated<br />
Potential Yield<br />
(m 3 /d)<br />
Estimation of the Borehole Field Development Cost for the Dyke Groups<br />
Geophysical &<br />
Geohydrological<br />
Activity Costs<br />
Cost of Percussion<br />
Drilling of the<br />
Boreholes<br />
3.8 DETERMINATION OF HIGH GROUN<strong>DWA</strong>TER ABSTRACTION AREAS<br />
A high groundwater abstraction area hydrocensus was conducted to determine if groundwater is utilised<br />
extensively in a 10 -15 km radius around the community of Wepener. The hydrocensus was undertaken by<br />
means of aerial photographs. Five irrigation pivots were identified to the north east of Wepener (refer to<br />
Figure 3.8). The coordinates of the irrigation pivots can be viewed in Table 3.8.<br />
Table 3.8: Coordinates of the Identified Irrigation Pivots<br />
Aquifer Test<br />
Pumping Cost of<br />
Boreholes<br />
Pumping<br />
Equ i pm e n t C ost<br />
Pump House<br />
Structure Cost<br />
It is important to note that the irrigation pivots are situated next to the Caledon River (refer to Figure 3.8).<br />
Therefore it is more likely that these irrigation pivots utilised surface water than groundwater. It is<br />
recommended that these areas be investigated to confirm the observation. Groundwater is also utilised by<br />
many farmers for domestic purposes at their farmsteads. Groundwater uses may include, drinking water<br />
purposes, washing of clothes and food preparation as well as watering of the farmstead gardens.<br />
Appendix 4 – Groundwater Potential Study for Small Towns June 2012<br />
Total C ost of<br />
Borehole Field<br />
(Excl. Vat)<br />
Dyke Group A 14 658 - 847 R 308 000.00 R 700 000.00 R 308 000.00 R 350 000.00 R 910 000.00 R 2 576 000.00<br />
Dyke Group B 211 7 651 - 12 761 R 4 642 000.00 R 10 550 000.00 R 4 642 000.00 R 4 220 000.00 R 13 715 000.00 R 37 769 000.00<br />
Dyke Group C 20 743 - 1 210 R 440 000.00 R 1 000 000.00 R 440 000.00 R 400 000.00 R 1 300 000.00 R 3 580 000.00<br />
Dyke Group D 22 1 331 - 1 370 R 484 000.00 R 1 100 000.00 R 484 000.00 R 440 000.00 R 1 430 000.00 R 3 938 000.00<br />
Total Cost R 47 863 000.00<br />
* Note that the above costing only includes the geophysical siting, percussion drilling, aquifer test pumping, pump equipment and pump house structure costs of the proposed<br />
borehole fields and do not include the cost of the surface infrastructure such as the electrical supply lines and pipeline networks etc.<br />
Coordinates (WGS84)<br />
Pivot Site Name<br />
Eas t S ou th<br />
Pivot A 27.04588 -29.62038<br />
Pivot B 27.05359 -29.61798<br />
Pivot C 27.05518 -29.62396<br />
Pivot D 27.04953 -29.62707<br />
Pivot E 27.05570 -29.63004
Water Reconciliation Strategy Study for the Bulk Water Supply Systems: Greater Bloemfontein Area 27<br />
Figure 3.8: Locality Map of the Potential High Groundwater Abstraction Areas in the vicinity of Wepener. Note that the Irrigation Pivots are situated next to the Caledon River. Therefore it is more likely that these pivots<br />
utilised Surface Water than Groundwater. It is recommended that these areas be investigated to confirm the observation<br />
Appendix 4 – Groundwater Potential Study for Small Towns June 2012
Water Reconciliation Strategy Study for the Bulk Water Supply Systems: Greater Bloemfontein Area 28<br />
3.9 CONCLUSIONS AND RECOMMENDATIONS<br />
The following conclusions and recommendations are based on the information supplied in this report:<br />
CATCHMENT<br />
The study area is located in north eastern part of the Free State Province in Water Management Area 13.<br />
The study area is also located in Drainage Area D, Quaternary sub-catchment D23G and D23J (Surface<br />
Water Resources of South Africa, First Edition, 1994).<br />
CLIMATE<br />
The investigated area has hot summers and cool winters, and a predominantly summer rainfall. The air<br />
temperatures range from an average maximum of 30 to 32 o C in January to an average minimum of 0 to 2 o C<br />
in July, meaning conditions with hot summers and cold winters (South African Atlas of Agrohydrology and –<br />
Climatology, 1997).<br />
Wepener has no rainfall station, therefore the rainfall for Dewetsdorp is assumed for Wepener. Dewetsdorp<br />
is located approximately 35 km away from Wepener in a north westerly direction. The mean annual rainfall<br />
is 592.7 mm/a, which occurs mainly as thunderstorms but soft rains also do occur (Rainfall Station Gauge<br />
No.: 0232 275, Dewetsdorp Police Station, Surface Water Resources of South Africa, 1990).<br />
GEOLOGY<br />
The geology of the Wepener district consists of the Karoo Super Group geology and more specifically of the<br />
Beaufort Group Upper Stage, which comprises of sedimentary rocks such as purple and green shale and<br />
mudstone<br />
The whole sedimentary sequence has been intruded by dolerite dyke and sill structures. The dolerite dykes<br />
are the primary targets for groundwater resource development.<br />
GENERAL AQUIFER INFORMATION OF THE WEPENER DISTRICT<br />
The following section is based on the Groundwater Resources of South Africa Maps, <strong>DWA</strong>F, 1995.<br />
The groundwater component of river flow (base flow) is 0 – 10 mm/a in the Wepener district. The<br />
groundwater depth in the study area is approximately 10 – 20 mbgl (standard deviation range from mean is<br />
between 8 – 15 m). The mean annual recharge of the area are between 25 - 37 mm/a.<br />
In general the recommended drilling depths are 20 to 30 metres or deeper for the study area. The storage<br />
types of the aquifer quantified as fractures restricted principally to a zone below the groundwater level.<br />
Pores in disintegrated / decomposed, partly decomposed rock and fractures which are principally restricted<br />
to a zone directly below the groundwater level. Storage coefficient in order of magnitude for the study area<br />
is 0.001 to 0.01.<br />
GROUN<strong>DWA</strong>TER POTENTIAL INVESTIGATION<br />
This section includes the geophysical information obtained during the survey to detect possible geological<br />
features and structures, which may act as preferential pathways for groundwater flow, which may act as<br />
target areas for groundwater exploration for water supply purposes.<br />
Aerial Photo Interpretation<br />
The aerial photo interpretation of the Wepener study area revealed 31 potential dolerite dyke structures that<br />
can be verified by means of geophysical methods and percussion drilling. The dolerite dyke structures are<br />
considered the primary targets for groundwater exploration in the Karoo Supergroup geology.<br />
Appendix 4 – Groundwater Potential Study for Small Towns June 2012
Water Reconciliation Strategy Study for the Bulk Water Supply Systems: Greater Bloemfontein Area 29<br />
Aerial Magnetic Data Interpretation<br />
The aerial magnetic map revealed numerous dolerite sill intrusions in the study area. The study area is<br />
located on the sedimentary rocks of the Beaufort Group of the Karoo Supergroup. The green and blue<br />
areas on the aerial magnetic contour map denote sedimentary rocks. Dolerite intrusives such as dykes and<br />
sill structures are denoted as the red and yellow areas of the aerial magnetics map.<br />
The available aerial magnetic data available for the study area are of a low resolution, which brings about<br />
that the smaller dolerite dyke structures occurring within the area cannot be detected due to the spacing of<br />
the flight lines for the aerial magnetic survey. The potential dolerite dykes denoted on the aerial magnetics<br />
map was determined by means of aerial photo interpretations as well as geological maps.<br />
Geological Map Interpretation<br />
The geological map interpretation of the Wepener study area revealed 31 potential dolerite dyke structures,<br />
which confirms the aerial photo interpretations, which also indicated the potential presence of these dolerite<br />
structures.<br />
RECHARGE WATER BUDGET CALCULATIONS AND ESTIMATED THEORETICAL YIELDS OF<br />
POTENTIAL DOLERITE DYKE STRUCTURES<br />
The following section evaluates the theoretical groundwater resource potential of the identified potential<br />
dolerite dyke structures by means of recharge water budget calculations based on potential minicatchments<br />
of dolerite dyke groups as well as theoretical yields of the structures based on average<br />
sustainable yield calculations by means of aquifer test pumping of borehole fields in the Karoo Super Group<br />
geology.<br />
Note that these resource potential calculations are only rough approximations of the potential sustainable<br />
yield volumes. The only method of determining the sustainable yield volume of a dolerite structure(s) is by<br />
geophysical siting, percussion drilling and aquifer test pumping of the borehole(s). Long-term groundwater<br />
monitoring is also important to observed and understand the aquifer dynamics. After sufficient data is<br />
generated a numerical model flow may be constructed to determine the capture zones of the individual<br />
boreholes as well as the capture zone of the well field as a whole.<br />
Recharge Water Budget Calculations<br />
The estimate recharge volume scenarios are based on a 2% and a 3% recharge percentages of the annual<br />
mean rainfall (592.7 mm/a, Surface Water Resources of South Africa, 1990) as well as recharge<br />
estimations according to the Groundwater Resources of South Africa (<strong>DWA</strong>F, 1995) and the Vegter<br />
Recharge Map (1995).<br />
It must be noted that the recharge volume calculations are only estimates of recharge to the estimated minicatchments<br />
of the dyke groups. The aim of the recharge volume calculations is to estimate the available<br />
recharge volume available to the dyke groups in the study area. The assumption thus made is that the<br />
available recharge volume correlates roughly to the sustainable yield available from the dolerite dyke<br />
groups. This method is only a rough approximation of potential sustainable yields due to that the<br />
sustainability of the intrusive structure is a function of the capture zone, which in turn entails the dynamics<br />
of the aquifer system (The Water budget Myth Revisited; Why Hydrogeologist Model, Bredehoeft, 2002).<br />
The main to tool for investigating the capture zone and aquifer dynamics is the numerical groundwater<br />
model. Unfortunately not enough geohydrological information exists in terms of aquifer parameters to<br />
construct such a model. Therefore only rough estimation can be made regarding the groundwater resource<br />
potential.<br />
Appendix 4 – Groundwater Potential Study for Small Towns June 2012
Water Reconciliation Strategy Study for the Bulk Water Supply Systems: Greater Bloemfontein Area 30<br />
The results of the groundwater resource potential estimations based on recharge volume scenarios are as<br />
follows:<br />
Estimated groundwater resource potential is estimated for Dyke Group A as approximately 658 m 3 /d.<br />
Estimated groundwater resource potential is estimated for Dyke Group B as approximately 7 651<br />
m 3 /d.<br />
Estimated groundwater resource potential is estimated for Dyke Groups C as approximately<br />
743 m 3 /d.<br />
Estimated groundwater resource potential is estimated for Dyke Group D as approximately 1 370<br />
m 3 /d.<br />
The estimated high growth scenario for the average annual daily water demand for Wepener was obtained<br />
from Aurecon and is 2 871 m 3 /d or kl/d. The estimated recharge area needed to address the above<br />
demand is approximately 30.4 km 2 .<br />
Estimation of Theoretical Potential Yield of the Dolerite Dyke Structures<br />
The theoretical potential yield or groundwater resource potential estimation of the dolerite dyke structure in<br />
this section is based on the geometric mean of sustainable yield calculations of borehole fields in the Karoo<br />
Super Group geology. The aquifer test data for the geometric mean utilised were taken from the borehole<br />
fields of Petrusburg, Philipstown, Edenville, Colesberg, Igomotseng, Winburg, Brandfort and the Drie<br />
Susters Area<br />
The groundwater resource potential is calculated by utilising the above mentioned geometric mean of 60.48<br />
m 3 /d per borehole or 2.1 L/s per borehole based on an 8-hour pump cycle and 16-hour recovery period per<br />
day. The length of the potential structures were taken into account whereby a borehole was spaced on the<br />
structure every 250 metres. Therefore the number of the boreholes that can be spaced on the structure<br />
multiplied by the geometric mean (2.1 L/s over 8-hours a day) is equal to the estimated groundwater<br />
resource potential of the dolerite dyke structure.<br />
The assumptions of the method are as follows:<br />
That potential dolerite dykes are water bearing.<br />
An average geometric mean sustainable yield of 60.48 m 3 /d or 2.1 L/s with an 8-hour pump schedule<br />
and a 14 recovery period per borehole (Geometric mean average obtained from borehole fields of<br />
Petrusburg, Philipstown, Edenville, Colesberg, Igomotseng, Winburg, Brandfort and the Drie Susters<br />
Area).<br />
Spacing of the boreholes every 250 m along the strike of the dolerite dyke structure (note that no<br />
boreholes are placed at the end points of the structures).<br />
The results of the potential yields of the dolerite dyke groups based on the geometric mean of sustainable<br />
yield calculations are as follows:<br />
The groundwater resource potential for Dyke Group A is estimated at 847 m 3 /d. The number of<br />
dykes of the dolerite group is 3 with a combined length of 5.0 km upon, which 14 potential boreholes<br />
are spaced for calculation purposes.<br />
The groundwater resource potential for Dyke Group B is estimated at 12 761 m 3 /d. The number of<br />
dykes of the dolerite group is 17 with a combined length of 62.60 km upon, which 211 potential<br />
boreholes are spaced for calculation purposes.<br />
The groundwater resource potential for Dyke Group C is estimated at 1 210 m 3 /d. The number of<br />
dykes of the dolerite group is 4 with a combined length of 7.0 km upon, which 20 potential boreholes<br />
are spaced for calculation purposes.<br />
Appendix 4 – Groundwater Potential Study for Small Towns June 2012
Water Reconciliation Strategy Study for the Bulk Water Supply Systems: Greater Bloemfontein Area 31<br />
The groundwater resource potential for Dyke Group D is estimated at 1 331 m 3 /d. The number of<br />
dykes of the dolerite group is 5 with a combined length of 8.0 km upon, which 22 potential boreholes<br />
are spaced for calculation purposes.<br />
Summary of the Results Groundwater Resource Potential of the Intrusive Dolerite Structures<br />
This section combines the groundwater potential estimation, which includes the recharge based approach<br />
as the lower boundary and the geometric mean approach as the upper boundary of the estimated<br />
groundwater potential range. The summary of the estimated groundwater resource potential for the<br />
delineated dyke groups are as follows:<br />
The groundwater resource potential for Dyke Group A is estimated in the order of between 658 to<br />
847 m 3 /d.<br />
The groundwater resource potential for Dyke Group B is estimated in the order of between 7 651 to<br />
12 761 m 3 /d.<br />
The groundwater resource potential for Dyke Group C is estimated in the order of between 743 to<br />
1 210 m 3 /d.<br />
The groundwater resource potential for Dyke Group D is estimated in the order of between 1 331 to<br />
1 370 m 3 /d.<br />
The estimated costing for developing the proposed borehole fields only includes the cost for the<br />
geophysical siting, percussion drilling, aquifer test pumping, pump equipment and pump house structure<br />
costs of the proposed borehole fields and do not include the cost of the surface infrastructure such as the<br />
electrical supply lines and pipeline networks and associated reservoirs etc.<br />
The estimated costing for developing the borehole fields are as follows:<br />
The estimated cost for the development of the borehole field for Dyke Group A is R 2 576 000<br />
The estimated cost for the development of the borehole field for Dyke Group B is R 37 769 000<br />
The estimated cost for the development of the borehole field for Dyke Group C is R 3 580 000<br />
The estimated cost for the development of the borehole field for Dyke Group D is R 3 938 000<br />
DETERMINATION OF HIGH GROUN<strong>DWA</strong>TER ABSTRACTION AREAS<br />
A high groundwater abstraction area hydrocensus was conducted to determine if groundwater is utilised<br />
extensively in a 10 -15 km radius around the community of Wepener. The hydrocensus was undertaken by<br />
means of aerial photographs. Five irrigation pivots were identified to the north east of Wepener.<br />
It is important to note that the irrigation pivots are situated next to the Caledon River. Therefore it is more<br />
likely that these irrigation pivots utilised surface water than groundwater. It is recommended that these<br />
areas be investigated to confirm the observation. Groundwater is also utilised by many farmers for<br />
domestic purposes at their farmsteads. Groundwater uses may include, drinking water purposes, washing<br />
of clothes and food preparation as well as watering of the farmstead gardens.<br />
FINAL CONCLUSIONS AND RECOMMENDATIONS<br />
It is concluded that 31 potential dolerite dykes was observed that can be further investigated. Information<br />
absent regarding the observed dolerite structures are that it is currently unknown if these structures are<br />
water bearing. If so what the true sustainable yields are of these structures, not the estimate yields, as well<br />
as the associated groundwater qualities.<br />
The desktop study indicate that it is viable to further investigate the groundwater resources of Wepener<br />
based on the numerous potential dolerite dykes observed in the vicinity of Wepener. It is recommended<br />
that any future orientated groundwater exploration study at least include the following components:<br />
Appendix 4 – Groundwater Potential Study for Small Towns June 2012
Water Reconciliation Strategy Study for the Bulk Water Supply Systems: Greater Bloemfontein Area 32<br />
Geophysical siting of groundwater exploration boreholes;<br />
Percussion drilling of the boreholes;<br />
Aquifer test pumping of successfully drilled exploration boreholes according to <strong>DWA</strong> specifications to<br />
determine the sustainable yields of the newly drilled boreholes;<br />
Sampling of all successfully drilled boreholes to determine the groundwater quality of the local site<br />
aquifer;<br />
Aquifer test pumping analyses of data to calculate sustainable yields and pump schedules.<br />
Compilation of a Geohydrological <strong>Report</strong>.<br />
Appendix 4 – Groundwater Potential Study for Small Towns June 2012
Water Reconciliation Strategy Study for the Bulk Water Supply Systems: Greater Bloemfontein Area 33<br />
4. DEWETSDORP<br />
The study area is located in north eastern part of the Free State Province in Water Management Area 13.<br />
The study area is also located in Drainage Area C and D, Quaternary sub-catchment C52A and D23H<br />
(Surface Water Resources of South Africa, First Edition, 1994). The locality map of the Dewetsdorp study<br />
area can be viewed in Figure 4.1.<br />
4.1 CLIMATE<br />
The investigated area has hot summers and cool winters, and a predominantly summer rainfall. The air<br />
temperatures range from an average maximum of 30 to 32 o C in January to an average minimum of 0 to 2<br />
o C in July, meaning conditions with hot summers and cold winters (South African Atlas of Agrohydrology<br />
and –Climatology, 1997).<br />
The mean annual rainfall is 592.7 mm/a, which occurs mainly as thunderstorms but soft rains also do occur<br />
(Rainfall Station Gauge No.: 0232 275, Dewetsdorp Police Station, Surface Water Resources of South<br />
Africa, 1990).<br />
4.2 GEOLOGY<br />
4.2.1 General aquifer information of the Dewetsdorp District<br />
The following section is based on the Groundwater Resources of South Africa Maps, <strong>DWA</strong>F, 1995.<br />
The groundwater component of river flow (base flow) is negligible in the Dewetsdorp district (refer to Figure<br />
2.3). The groundwater depth in the study area is approximately 10 – 20 mbgl (standard deviation range<br />
from mean is between 8 – 15 m), refer to Figure 2.4. The mean annual recharge of the area are between<br />
15 - 25 mm/a (refer to Figure 2.3).<br />
In general the recommended drilling depths are 20 to 30 metres or deeper for the study area. The storage<br />
types of the aquifer quantified as fractures restricted principally to a zone below the groundwater level.<br />
Pores in disintegrated / decomposed, partly decomposed rock and fractures which are principally restricted<br />
to a zone directly below the groundwater level. Storage coefficient in order of magnitude for the study area<br />
is 0.001 to 0.01.<br />
Appendix 4 – Groundwater Potential Study for Small Towns June 2012
Water Reconciliation Strategy Study for the Bulk Water Supply Systems: Greater Bloemfontein Area 34<br />
Figure 4.1: Locality Map of the Dewetsdorp Study Area<br />
Appendix 4 – Groundwater Potential Study for Small Towns June 2012
Water Reconciliation Strategy Study for the Bulk Water Supply Systems: Greater Bloemfontein Area 35<br />
Figure 4.2: Geological Map of the Dewetsdorp Study Area<br />
Appendix 4 – Groundwater Potential Study for Small Towns June 2012
Water Reconciliation Strategy Study for the Bulk Water Supply Systems: Greater Bloemfontein Area 36<br />
Figure 4.3: Locality Map of the Aerial Photo Interpretations of the Dewetsdorp Study Area<br />
Appendix 4 – Groundwater Potential Study for Small Towns June 2012
Water Reconciliation Strategy Study for the Bulk Water Supply Systems: Greater Bloemfontein Area 37<br />
4.3 GROUN<strong>DWA</strong>TER POTENTIAL INVESTIGATIONS<br />
This section includes the geophysical information obtained during the survey to detect possible geological<br />
features and structures, which may act as preferential pathways for groundwater flow, which may act as<br />
target areas for groundwater exploration for water supply purposes.<br />
4.3.1 Aerial photo interpretation<br />
The aerial photo interpretation of the Dewetsdorp study area revealed 26 potential dolerite dyke structures<br />
that can be verified by means of geophysical methods and percussion drilling. The dolerite dyke structures<br />
are considered the primary targets for groundwater exploration in the Karoo Supergroup geology. The<br />
aerial photo map of the study area can be viewed in Figure 4.3.<br />
4.3.2 Results of the aerial magnetic data interpretation<br />
The aerial magnetic map revealed numerous dolerite sill intrusions in the study area (refer to Figure 4.4).<br />
The study area is located on the sedimentary rocks of the Beaufort Group of the Karoo Supergroup. The<br />
green and blue areas on the aerial magnetic contour map denote sedimentary rocks. Dolerite intrusives<br />
such as dykes and sill structures are denoted as the red and yellow areas of the aerial magnetics map.<br />
The available aerial magnetic data available for the study area are of a low resolution, which brings about<br />
that the smaller dolerite dyke structures occurring within the area cannot be detected due to the spacing of<br />
the flight lines for the aerial magnetic survey. The potential dolerite dykes denoted on the aerial magnetics<br />
map was determined by means of aerial photo interpretations as well as geological maps.<br />
4.3.3 Geological map interpretations<br />
The geological map interpretation of the Dewetsdorp study area revealed 26 potential dolerite dyke<br />
structures, which confirms the aerial photo interpretations, which also indicated the potential presence of<br />
these dolerite structures. The aerial photo map of the study area can be viewed in Figure 4.5.<br />
Appendix 4 – Groundwater Potential Study for Small Towns June 2012
Water Reconciliation Strategy Study for the Bulk Water Supply Systems: Greater Bloemfontein Area 38<br />
Figure 4.4: Aerial Magnetic Data Contour Map for the Dewetsdorp Area. Note that the red and yellow areas denote areas of Higher Magnetic Intensity that are associated with Dolerite Sill Intrusions. The green and blue<br />
areas refer to Sedimentary Rocks of the Beaufort Group (Karoo Supergroup)<br />
Appendix 4 – Groundwater Potential Study for Small Towns June 2012
Water Reconciliation Strategy Study for the Bulk Water Supply Systems: Greater Bloemfontein Area 39<br />
4.4 RECHARGE WATER BUDGET CALCULATIONS AND ESTIMATED<br />
THEORETICAL YIELDS OF POTENTIAL DOLERITE STRUCTURES<br />
The following section evaluates the theoretical groundwater resource potential of the identified potential<br />
dolerite dyke structures by means of recharge water budget calculations based on potential minicatchments<br />
of dolerite dyke groups as well as theoretical yields of the structures based on average<br />
sustainable yield calculations by means of aquifer test pumping of borehole fields in the Karoo Super Group<br />
geology.<br />
Note that these resource potential calculations are only rough approximations of the potential sustainable<br />
yield volumes. The only method of determining the sustainable yield volume of a dolerite structure(s) is by<br />
geophysical siting, percussion drilling and aquifer test pumping of the borehole(s). Long-term groundwater<br />
monitoring is also important to observed and understand the aquifer dynamics. After sufficient data is<br />
generated a numerical model flow may be constructed to determine the capture zones of the individual<br />
boreholes as well as the capture zone of the well field as a whole.<br />
4.4.1 Recharge water budget calculations<br />
The estimate recharge volume scenarios are based on a 2% and a 3% recharge percentages of the annual<br />
mean rainfall (592.7 mm/a, Surface Water Resources of South Africa, 1990) as well as recharge<br />
estimations according to the Groundwater Resources of South Africa (<strong>DWA</strong>F, 1995) and the Vegter<br />
Recharge Map (1995). The recharge maps can be viewed in Figure 2.5 and Figure 2.6.<br />
It must be noted that the recharge volume calculations are only estimates of recharge to the estimated minicatchments<br />
of the dyke groups as delineated in Figure 4.5 and Figure 4.6. The aim of the recharge volume<br />
calculations is to estimate the available recharge volume available to the dyke groups in the study area.<br />
The assumption thus made is that the available recharge volume correlates roughly to the sustainable yield<br />
available from the dolerite dyke groups. This method is only a rough approximation of potential sustainable<br />
yields because the sustainability of the intrusive structure is a function of the capture zone, which in turn<br />
entails the dynamics of the aquifer system (The Water budget Myth Revisited; Why Hydrogeologist Model,<br />
Bredehoeft, 2002). The main to tool for investigating the capture zone and aquifer dynamics is the<br />
numerical groundwater model. Unfortunately not enough geohydrological information exists in terms of<br />
aquifer parameters to construct such a model. Therefore only rough estimation can be made regarding the<br />
groundwater resource potential.<br />
The results of the groundwater resource potential estimations based on recharge volume scenarios are as<br />
follows (the summary of the recharge volumes can be studied in Table 4.1):<br />
Estimated groundwater resource potential is estimated for Dyke Group A as approximately 1 845<br />
m 3 /d (refer to Table 4.2).<br />
Estimated groundwater resource potential is estimated for Dyke Group B as approximately 2 570<br />
m 3 /d (refer to Table 4.3).<br />
Estimated groundwater resource potential is estimated for Dyke Groups C as approximately 1 057<br />
m 3 /d (refer to Table 4.4).<br />
Estimated groundwater resource potential is estimated for Dyke Group D as approximately 647 m 3 /d<br />
(refer to Table 4.5).<br />
Estimated groundwater resource potential is estimated for Dyke Group E as approximately 1 072<br />
m 3 /d (refer to Table 4.6).<br />
Estimated groundwater resource potential is estimated for Dyke Group F as approximately 2 469<br />
m 3 /d (refer to Table 4.7).<br />
Appendix 4 – Groundwater Potential Study for Small Towns June 2012
Water Reconciliation Strategy Study for the Bulk Water Supply Systems: Greater Bloemfontein Area 40<br />
The estimated high growth scenario for the average annual daily water demand for Dewetsdorp was<br />
obtained from Aurecon and is 3 203 m 3 /d or kl/d. The estimated recharge area needed to address the<br />
above demand is approximately 52.0 km 2 .<br />
Table 4.1: Summary of the Average Available Recharge to the Dyke Groups. The assumption<br />
thus made is that the Available Recharge Volume correlates roughly to the<br />
Sustainable Yield available from the Dolerite Dyke Groups<br />
Dyke Group Name<br />
Average Recharge Available To Dyke Groups<br />
Estimation of Recharge Volume<br />
(m 3 /a)<br />
Estimation of Recharge Volume<br />
(m 3 /d)<br />
Dyke Group A 673 344 1 845<br />
Dyke Group B 938 226 2 570<br />
Dyke Group C 385 733 1 057<br />
Dyke Group D 236 076 647<br />
Dyke Group E 391 134 1 072<br />
Dyke Group F 901 318 2 469<br />
Total 3 525 830 9 660<br />
Assumptions:<br />
* Note that the recharge volume calculations are a function of the mean annual rainfall of the area,<br />
recharge percentage assigned and the surface area of the dyke group catchment. Also note that the<br />
estimated available recharge to the aquifer is only available for abstraction purposes if sufficient<br />
dolerite dykes structures and associated fractures are available in geology of the site aquifer.<br />
* Note the average recharge volumes in this table are based on the recharge percentages as obtained<br />
from the Vegter Maps and <strong>DWA</strong>F Groundwater Resources of South Africa Maps.<br />
Table 4.2: Recharge Volume Calculation Scenarios for Dyke Group A<br />
Dyke Group<br />
Name<br />
Dyke Group A<br />
Assumptions:<br />
Recharge Scenario<br />
Es ti m ati on of Dyk e<br />
Group Catchment Area<br />
(m 2 )<br />
Average Rainfall<br />
(mm/a)<br />
Recharge<br />
Percentage<br />
(%)<br />
Recharge<br />
(mm/a)<br />
Esti m ati on of<br />
Recharge Volume<br />
(m 3 /a)<br />
Es ti m ati on of<br />
Recharge Volume<br />
(m 3 /d)<br />
2% Recharge 29 920 000 592.7 2.0 12 354 672 972<br />
3% Recharge 29 920 000 592.7 3.0 18 532 008 1 458<br />
Vegter Map Recharge,<br />
(20 mm/a)<br />
<strong>DWA</strong>F, Groundwater<br />
Resources of SA Recharge (25 mm/a)<br />
29 920 000 592.7 3.4 20.00 598 331 1 639<br />
29 920 000 592.7 4.2 25.01 748 357 2 050<br />
Average:<br />
(Vegter Map & <strong>DWA</strong>F, SA GW Resources)<br />
* Note that the recharge volume calculations are a function of the mean annual rainfall of the area, recharge percentage assigned and the surface area of the dyke group<br />
catchment. Also note that the estimated available recharge to the aquifer is only available for abstraction purposes if sufficient dolerite dykes structures and associated<br />
fractures are available in geology of the site aquifer.<br />
Appendix 4 – Groundwater Potential Study for Small Towns June 2012<br />
1 845
Water Reconciliation Strategy Study for the Bulk Water Supply Systems: Greater Bloemfontein Area 41<br />
Table 4.3: Recharge Volume Calculation Scenarios for Dyke Group B<br />
Dyke Group<br />
Name<br />
Dyke Group B<br />
Recharge Scenario<br />
Es ti m ati on of Dyk e<br />
Group Catchment Area<br />
(m 2 )<br />
Average Rainfall<br />
(mm/a)<br />
Recharge<br />
Percentage<br />
(%)<br />
Recharge<br />
(mm/a)<br />
Table 4.4. Recharge Volume Calculation Scenarios for Dyke Group C<br />
Table 4.5: Recharge Volume Calculation Scenarios for Dyke Group D<br />
Esti m ati on of<br />
Recharge Volume<br />
(m 3 /a)<br />
Es ti m ati on of<br />
Recharge Volume<br />
(m 3 /d)<br />
2% Recharge 41 690 000 592.7 2.0 12 494 193 1 354<br />
3% Recharge 41 690 000 592.7 3.0 18 741 290 2 031<br />
Vegter Map Recharge,<br />
(20 mm/a)<br />
<strong>DWA</strong>F, Groundwater<br />
Resources of SA Recharge (25 mm/a)<br />
41 690 000 592.7 3.4 20 833 704 2 284<br />
41 690 000 592.7 4.2 25 1 042 748 2 857<br />
Average:<br />
(Vegter Map & <strong>DWA</strong>F, SA GW Resources)<br />
Assumptions:<br />
* Note that the recharge volume calculations are a function of the mean annual rainfall of the area, recharge percentage assigned and the surface area of the dyke group<br />
catchment. Also note that the estimated available recharge to the aquifer is only available for abstraction purposes if sufficient dolerite dykes structures and associated<br />
fractures are available in geology of the site aquifer.<br />
Dyke Group<br />
Name<br />
Dyke Group C<br />
Recharge Scenario<br />
Es ti m ati on of Dyk e<br />
Group Catchment Area<br />
(m 2 )<br />
Average Rainfall<br />
(mm/a)<br />
Recharge<br />
Percentage<br />
(%)<br />
Recharge<br />
(mm/a)<br />
Esti m ati on of<br />
Recharge Volume<br />
(m 3 /a)<br />
Appendix 4 – Groundwater Potential Study for Small Towns June 2012<br />
2 570<br />
Es ti m ati on of<br />
Recharge Volume<br />
(m 3 /d)<br />
2% Recharge 17 140 000 592.7 2.0 12 203 178 557<br />
3% Recharge 17 140 000 592.7 3.0 18 304 766 835<br />
Vegter Map Recharge,<br />
(20 mm/a)<br />
<strong>DWA</strong>F, Groundwater<br />
Resources of SA Recharge (25 mm/a)<br />
17 140 000 592.7 3.4 20 342 761 939<br />
17 140 000 592.7 4.2 25 428 705 1 175<br />
Average:<br />
(Vegter Map & <strong>DWA</strong>F, SA GW Resources)<br />
Assumptions:<br />
* Note that the recharge volume calculations are a function of the mean annual rainfall of the area, recharge percentage assigned and the surface area of the dyke group<br />
catchment. Also note that the estimated available recharge to the aquifer is only available for abstraction purposes if sufficient dolerite dykes structures and associated<br />
fractures are available in geology of the site aquifer.<br />
Dyke Group<br />
Name<br />
Dyke Group D<br />
Recharge Scenario<br />
Es ti m ati on of Dyk e<br />
Group Catchment Area<br />
(m 2 )<br />
Average Rainfall<br />
(mm/a)<br />
Recharge<br />
Percentage<br />
(%)<br />
Recharge<br />
(mm/a)<br />
Esti m ati on of<br />
Recharge Volume<br />
(m 3 /a)<br />
1 057<br />
Es ti m ati on of<br />
Recharge Volume<br />
(m 3 /d)<br />
2% Recharge 10 490 000 592.7 2.0 12 124 348 341<br />
3% Recharge 10 490 000 592.7 3.0 18 186 523 511<br />
Vegter Map Recharge,<br />
(20 mm/a)<br />
<strong>DWA</strong>F, Groundwater<br />
Resources of SA Recharge (25 mm/a)<br />
10 490 000 592.7 3.4 20 209 776 575<br />
10 490 000 592.7 4.2 25 262 375 719<br />
Average:<br />
(Vegter Map & <strong>DWA</strong>F, SA GW Resources)<br />
Assumptions:<br />
* Note that the recharge volume calculations are a function of the mean annual rainfall of the area, recharge percentage assigned and the surface area of the dyke group<br />
catchment. Also note that the estimated available recharge to the aquifer is only available for abstraction purposes if sufficient dolerite dykes structures and associated<br />
fractures are available in geology of the site aquifer.<br />
647
Water Reconciliation Strategy Study for the Bulk Water Supply Systems: Greater Bloemfontein Area 42<br />
Table 4.6: Recharge Volume Calculation Scenarios for Dyke Group E<br />
Dyke Group<br />
Name<br />
Dyke Group E<br />
Assumptions:<br />
Recharge Scenario<br />
Es ti m ati on of Dyk e<br />
Group Catchment Area<br />
(m 2 )<br />
Average Rainfall<br />
(mm/a)<br />
Recharge<br />
Percentage<br />
(%)<br />
Recharge<br />
(mm/a)<br />
Table 4.7: Recharge Volume Calculation Scenarios for Dyke Group F<br />
Esti m ati on of<br />
Recharge Volume<br />
(m 3 /a)<br />
Es ti m ati on of<br />
Recharge Volume<br />
(m 3 /d)<br />
2% Recharge 17 380 000 592.7 2.0 12 206 023 564<br />
3% Recharge 17 380 000 592.7 3.0 18 309 034 847<br />
Vegter Map Recharge,<br />
(20 mm/a)<br />
<strong>DWA</strong>F, Groundwater<br />
Resources of SA Recharge (25 mm/a)<br />
17 380 000 592.7 3.4 20 347 560 952<br />
17 380 000 592.7 4.2 25 434 708 1 191<br />
Average:<br />
(Vegter Map & <strong>DWA</strong>F, SA GW Resources)<br />
* Note that the recharge volume calculations are a function of the mean annual rainfall of the area, recharge percentage assigned and the surface area of the dyke group<br />
catchment. Also note that the estimated available recharge to the aquifer is only available for abstraction purposes if sufficient dolerite dykes structures and associated<br />
fractures are available in geology of the site aquifer.<br />
Dyke Group<br />
Name<br />
Dyke Group F<br />
Assumptions:<br />
Recharge Scenario<br />
Es ti m ati on of Dyk e<br />
Group Catchment Area<br />
(m 2 )<br />
Average Rainfall<br />
(mm/a)<br />
Recharge<br />
Percentage<br />
(%)<br />
Recharge<br />
(mm/a)<br />
Esti m ati on of<br />
Recharge Volume<br />
(m 3 /a)<br />
Appendix 4 – Groundwater Potential Study for Small Towns June 2012<br />
1 072<br />
Es ti m ati on of<br />
Recharge Volume<br />
(m 3 /d)<br />
2% Recharge 40 050 000 592.7 2.0 12 474 753 1 301<br />
3% Recharge 40 050 000 592.7 3.0 18 712 129 1 951<br />
Vegter Map Recharge,<br />
(20 mm/a)<br />
<strong>DWA</strong>F, Groundwater<br />
Resources of SA Recharge (25 mm/a)<br />
40 050 000 592.7 3.4 20 800 908 2 194<br />
40 050 000 592.7 4.2 25 1 001 728 2 744<br />
Average:<br />
(Vegter Map & <strong>DWA</strong>F, SA GW Resources)<br />
* Note that the recharge volume calculations are a function of the mean annual rainfall of the area, recharge percentage assigned and the surface area of the dyke group<br />
catchment. Also note that the estimated available recharge to the aquifer is only available for abstraction purposes if sufficient dolerite dykes structures and associated<br />
fractures are available in geology of the site aquifer.<br />
2 469
Water Reconciliation Strategy Study for the Bulk Water Supply Systems: Greater Bloemfontein Area 43<br />
Figure 4.5: Locality Map of the Delineated Dolerite Dyke Groups near Dewetsdorp as utilised for the Groundwater Resource Potential Estimation<br />
Appendix 4 – Groundwater Potential Study for Small Towns June 2012
Water Reconciliation Strategy Study for the Bulk Water Supply Systems: Greater Bloemfontein Area 44<br />
Figure 4.6: Locality Map of the Estimated Mini-Catchments of the Dyke Groups near Dewetsdorp<br />
Appendix 4 – Groundwater Potential Study for Small Towns June 2012
Water Reconciliation Strategy Study for the Bulk Water Supply Systems: Greater Bloemfontein Area 45<br />
4.5 ESTIMATION OF THEORETICAL POTENTIAL YIELD OF THE DOLERITE<br />
DYKE STRUCTURES<br />
The theoretical potential yield or groundwater resource potential estimation of the dolerite dyke structure in<br />
this section is based on the geometric mean of sustainable yield calculations of borehole fields in the Karoo<br />
Super Group geology. The aquifer test data for the geometric mean utilised were taken from the borehole<br />
fields of Petrusburg, Philipstown, Edenville, Colesberg, Igomotseng, Winburg, Brandfort and the Drie<br />
Susters Area<br />
The groundwater resource potential is calculated by utilising the above mentioned geometric mean of 60.48<br />
m 3 /d per borehole or 2.1 L/s per borehole based on an 8-hour pump cycle and 16-hour recovery period per<br />
day. The length of the potential structures were taken into account whereby a borehole was spaced on the<br />
structure every 250 metres. Therefore the number of the boreholes that can be spaced on the structure<br />
multiplied by the geometric mean (2.1 L/s over 8-hours a day) is equal to the estimated groundwater<br />
resource potential of the dolerite dyke structure.<br />
The assumptions of the method are as follows:<br />
That potential dolerite dykes are water bearing.<br />
An average geometric mean sustainable yield of 60.48 m 3 /d or 2.1 L/s with an 8-hour pump schedule<br />
and a 16 hour recovery period per borehole (Geometric mean average obtained from borehole fields<br />
of Petrusburg, Philipstown, Edenville, Colesberg, Igomotseng, Winburg, Brandfort and the Drie<br />
Susters Area).<br />
Spacing of the boreholes every 250 m along the strike of the dolerite dyke structure (note that no<br />
boreholes are placed at the end points of the structures).<br />
The results of the potential yields of the dolerite dyke groups based on the geometric mean of sustainable<br />
yield calculations are as follows (refer to Figure 4.5 as well as Table 4.8):<br />
The groundwater resource potential for Dyke Group A is estimated at 5 867 m 3 /d. The number of<br />
dykes of the dolerite group is 8 with a combined length of 27.45 km upon, which 97 potential<br />
boreholes are spaced for calculation purposes.<br />
The groundwater resource potential for Dyke Group B is estimated at 6 169 m 3 /d. The number of<br />
dykes of the dolerite group is 4 with a combined length of 27.80 km upon, which 102 potential<br />
boreholes are spaced for calculation purposes.<br />
The groundwater resource potential for Dyke Group C is estimated at 2 177 m 3 /d. The number of<br />
dykes of the dolerite group is 3 with a combined length of 10.60 km upon, which 36 potential<br />
boreholes are spaced for calculation purposes.<br />
The groundwater resource potential for Dyke Group D is estimated at 786 m 3 /d. The number of<br />
dykes of the dolerite group is 5 with a combined length of 5.30 km upon, which 13 potential<br />
boreholes are spaced for calculation purposes.<br />
The groundwater resource potential for Dyke Group E is estimated at 1 452 m 3 /d. The number of<br />
dykes of the dolerite group is 3 with a combined length of 8.0 km upon, which 24 potential boreholes<br />
are spaced for calculation purposes.<br />
The groundwater resource potential for Dyke Group F is estimated at 4 657 m 3 /d. The number of<br />
dykes of the dolerite group is 7 with a combined length of 22.90 km upon, which 77 potential<br />
boreholes are spaced for calculation purposes.<br />
Appendix 4 – Groundwater Potential Study for Small Towns June 2012
Water Reconciliation Strategy Study for the Bulk Water Supply Systems: Greater Bloemfontein Area 46<br />
Table 4.8: Theoretically Estimated Dyke Group Yields or Groundwater Resource Potential<br />
based on the Geometric Mean of Sustainable Yields of Karoo Borehole Fields, see<br />
assumption section below the table for further information regarding the<br />
calculations<br />
Dyke Group<br />
Name<br />
Theoretically Estimated Dyke Group Yields (Geomean)<br />
Number of<br />
Dykes<br />
Total Length<br />
of Dykes<br />
(km)<br />
Number of Potential<br />
Boreholes<br />
(250 m Spacing)<br />
Estimated Yield<br />
of Dyke Groups<br />
(m 3 /d)<br />
A 8 27.45 97 5 867<br />
B 4 27.80 102 6 169<br />
C 3 10.60 36 2 177<br />
D 5 5.30 13 786<br />
E 3 8.00 24 1 452<br />
F 7 22.90 77 4 657<br />
Total 30 102.05 349 21 108<br />
Assumptions:<br />
* That potential dolerite dykes are water bearing.<br />
* An average geomean sustainable yield of 60.48 m<br />
* Refer to Dyke Group Map for the spatial localities.<br />
3 /d base on a 2.1 L/s with a 8-hour<br />
pump schedule and a 14 recovery period per borehole (Geomean average obtained from<br />
borehole fields of Petrusburg, Philipstown, Edenville, Colesberg, Igomotseng, Winburg,<br />
Brandfort and the Drie Susters Area).<br />
* Spacing of the boreholes every 250 m along the strike of the dolerite dyke structure<br />
(note that no boreholes are placed at the end points of the structures).<br />
4.6 SUMMARY OF THE RESULTS – GROUN<strong>DWA</strong>TER RESOURCE POTENTIAL<br />
OF THE INTRUSIVE DOLERITE STRUCTURES<br />
This section combines the groundwater potential estimation, which includes the recharge based approach<br />
as the lower boundary and the geometric mean approach as the upper boundary of the estimated<br />
groundwater potential range. The summary of the estimated groundwater resource potential for the<br />
delineated dyke groups are as follows (refer to Figure 4.5):<br />
The groundwater resource potential for Dyke Group A is estimated in the order of between 1 845 to<br />
5 867 m 3 /d.<br />
The groundwater resource potential for Dyke Group B is estimated in the order of between 2 570 to<br />
6 169 m 3 /d.<br />
The groundwater resource potential for Dyke Group C is estimated in the order of between 1 057 to<br />
2 177 m 3 /d.<br />
The groundwater resource potential for Dyke Group D is estimated in the order of between 647 to<br />
786 m 3 /d.<br />
The groundwater resource potential for Dyke Group E is estimated in the order of between 1 072 to<br />
1 452 m 3 /d.<br />
The groundwater resource potential for Dyke Group F is estimated in the order of between 2 469 to<br />
4 657 m 3 /d.<br />
Appendix 4 – Groundwater Potential Study for Small Towns June 2012
Water Reconciliation Strategy Study for the Bulk Water Supply Systems: Greater Bloemfontein Area 47<br />
4.6.1 Cost estimate of developing the proposed borehole fields<br />
The estimated costing for developing the proposed borehole fields only includes the cost for the<br />
geophysical siting, percussion drilling, aquifer test pumping, pump equipment and pump house structure<br />
costs of the proposed borehole fields and do not include the cost of the surface infrastructure such as the<br />
electrical supply lines and pipeline networks and associated reservoirs etc.<br />
The estimated costing for developing the borehole fields are as follows (refer to Table 4.9):<br />
The estimated cost for the development of the borehole field for Dyke Group A is R 17 848 000.<br />
The estimated cost for the development of the borehole field for Dyke Group B is R 18 258 000.<br />
The estimated cost for the development of the borehole field for Dyke Group C is R 6 444 000.<br />
The estimated cost for the development of the borehole field for Dyke Group D is R 2 327 000.<br />
The estimated cost for the development of the borehole field for Dyke Group E is R 4 296 000.<br />
The estimated cost for the development of the borehole field for Dyke Group F is R 13 783 000.<br />
Table 4.9: Estimation of the Borehole Field Development Cost for the Dyke Groups. Note that<br />
the costing does not make provision for Surface Infrastructure such as Electrical<br />
Supply Lines and Pipeline Networks etc<br />
Dyke Group<br />
Name<br />
Number of<br />
Boreholes to be<br />
Developed<br />
Estimated<br />
Potential<br />
Yield<br />
(m 3 /d)<br />
Estimation of the Borehole Field Development Cost for the Dyke Groups<br />
Geophysical &<br />
Geohydrological<br />
Activity Costs<br />
Cost of Percussion<br />
Drilling of the<br />
Boreholes<br />
Aquifer Test<br />
Pumping Cost of<br />
Boreholes<br />
Pumping<br />
Equ i pm e n t C ost<br />
Pump House<br />
Structure Cost<br />
4.7 DETERMINATION OF HIGH GROUN<strong>DWA</strong>TER ABSTRACTION AREAS<br />
Total C os t of<br />
Borehole Field<br />
(Excl. Vat)<br />
Dyke Group A 97 1 845 - 5 867 R 2 134 000.00 R 4 850 000.00 R 2 134 000.00 R 2 425 000.00 R 6 305 000.00 R 17 848 000.00<br />
Dyke Group B 102 2 570 - 6 169 R 2 244 000.00 R 5 100 000.00 R 2 244 000.00 R 2 040 000.00 R 6 630 000.00 R 18 258 000.00<br />
Dyke Group C 36 1 057 - 2 177 R 792 000.00 R 1 800 000.00 R 792 000.00 R 720 000.00 R 2 340 000.00 R 6 444 000.00<br />
Dyke Group D 13 647 - 786 R 286 000.00 R 650 000.00 R 286 000.00 R 260 000.00 R 845 000.00 R 2 327 000.00<br />
Dyke Group E 24 1 072 - 1 452 R 528 000.00 R 1 200 000.00 R 528 000.00 R 480 000.00 R 1 560 000.00 R 4 296 000.00<br />
Dyke Group F 77 2 469 - 4 657 R 1 694 000.00 R 3 850 000.00 R 1 694 000.00 R 1 540 000.00 R 5 005 000.00 R 13 783 000.00<br />
Total Cost R 62 956 000.00<br />
* Note that the above costing only includes the geophysical siting, percussion drilling, aquifer test pumping, pump equipment and pump house structure costs of the proposed<br />
borehole fields and do not include the cost of the surface infrastructure such as the electrical supply lines and pipeline networks etc.<br />
A high groundwater abstraction area hydrocensus was conducted to determine if groundwater is utilised<br />
extensively in a 10 -15 km radius around the community of Dewetsdorp. The hydrocensus was undertaken<br />
by means of aerial photographs. Ten irrigation pivots were identified to the west of Dewetsdorp (refer to<br />
Figure 4.7). The coordinates of the irrigation pivots can be viewed in Table 4.10.<br />
Appendix 4 – Groundwater Potential Study for Small Towns June 2012
Water Reconciliation Strategy Study for the Bulk Water Supply Systems: Greater Bloemfontein Area 48<br />
Table 4.10: Coordinates of the Identified Irrigation Pivots<br />
Coordinates (WGS84)<br />
Pivot Site Name<br />
Eas t S ou th<br />
Pivot A 26.54402 -29.48199<br />
Pivot B 26.54858 -29.48227<br />
Pivot C 26.55435 -29.48978<br />
Pivot D 26.54140 -29.49546<br />
Pivot E 26.55916 -29.49497<br />
Pivot F 26.56265 -29.50297<br />
Pivot G 26.55991 -29.50591<br />
Pivot H 26.58353 -29.55913<br />
Pivot I 26.58354 -29.56270<br />
Pivot J 26.52174 -29.64466<br />
It is important to note that the irrigation pivots are situated next to non-perennial streams and dams (refer to<br />
Figure 4.7). Therefore it is more likely that these irrigation pivots utilised surface water than groundwater.<br />
It is recommended that these areas be investigated to confirm the observation. Groundwater is also utilised<br />
by many farmers for domestic purposes at their farmsteads. Groundwater uses may include, drinking water<br />
purposes, washing of clothes and food preparation as well as watering of the farmstead gardens.<br />
Appendix 4 – Groundwater Potential Study for Small Towns June 2012
Water Reconciliation Strategy Study for the Bulk Water Supply Systems: Greater Bloemfontein Area 49<br />
Figure 4.7: Locality Map of the Potential High Groundwater Abstraction Areas in the vicinity of Dewetsdorp. Note that the Irrigation Pivots are situated next to Non-Perennial Streams and Small Dams. Therefore it is more<br />
likely that these Pivots utilised Surface Water than Groundwater. It is recommended that these areas be investigated to confirm the observation<br />
Appendix 4 – Groundwater Potential Study for Small Towns June 2012
Water Reconciliation Strategy Study for the Bulk Water Supply Systems: Greater Bloemfontein Area 50<br />
4.8 CONCLUSIONS AND RECOMMENDATIONS<br />
The following conclusions and recommendations are based on the information supplied in this report:<br />
CATCHMENT<br />
The study area is located in north eastern part of the Free State Province in Water Management Area 13.<br />
The study area is also located in Drainage Area C and D, Quaternary sub-catchment C52A and D23H<br />
(Surface Water Resources of South Africa, First Edition, 1994).<br />
CLIMATE<br />
The investigated area has hot summers and cool winters, and a predominantly summer rainfall. The air<br />
temperatures range from an average maximum of 30 to 32 o C in January to an average minimum of 0 to 2<br />
o C in July, meaning conditions with hot summers and cold winters (South African Atlas of Agrohydrology<br />
and –Climatology, 1997).<br />
The mean annual rainfall is 592.7 mm/a, which occurs mainly as thunderstorms but soft rains also do occur<br />
(Rainfall Station Gauge No.: 0232 275, Dewetsdorp Police Station, Surface Water Resources of South<br />
Africa, 1990).<br />
GEOLOGY<br />
The geology of the Dewetsdorp district consists of the Karoo Super Group geology and more specifically of<br />
the Beaufort Group Upper Stage, which comprises of sedimentary rocks such as purple and green shale<br />
and mudstone.<br />
The whole sedimentary sequence has been intruded by dolerite dyke and sill structures. The dolerite dykes<br />
are the primary targets for groundwater resource development.<br />
GENERAL AQUIFER INFORMATION OF THE DEWETSDORP DISTRICT<br />
The following section is based on the Groundwater Resources of South Africa Maps, <strong>DWA</strong>F, 1995.<br />
The groundwater component of river flow (base flow) is negligible in the Dewetsdorp district. The<br />
groundwater depth in the study area is approximately 10 – 20 mbgl (standard deviation range from mean is<br />
between 8 – 15 m). The mean annual recharge of the area are between 15 - 25 mm/a.<br />
In general the recommended drilling depths are 20 to 30 metres or deeper for the study area. The storage<br />
types of the aquifer quantified as fractures restricted principally to a zone below the groundwater level.<br />
Pores in disintegrated / decomposed, partly decomposed rock and fractures which are principally restricted<br />
to a zone directly below the groundwater level. Storage coefficient in order of magnitude for the study area<br />
is 0.001 to 0.01.<br />
GROUN<strong>DWA</strong>TER POTENTIAL INVESTIGATION<br />
This section includes the geophysical information obtained during the survey to detect possible geological<br />
features and structures, which may act as preferential pathways for groundwater flow, which may act as<br />
target areas for groundwater exploration for water supply purposes.<br />
Aerial Photo Interpretation<br />
The aerial photo interpretation of the Dewetsdorp study area revealed 26 potential dolerite dyke structures<br />
that can be verified by means of geophysical methods and percussion drilling. The dolerite dyke structures<br />
are considered the primary targets for groundwater exploration in the Karoo Supergroup geology.<br />
Aerial Magnetic Data Interpretation<br />
The aerial magnetic map revealed numerous dolerite sill intrusions in the study area. The study area is<br />
located on the sedimentary rocks of the Beaufort Group of the Karoo Supergroup. The green and blue<br />
Appendix 4 – Groundwater Potential Study for Small Towns June 2012
Water Reconciliation Strategy Study for the Bulk Water Supply Systems: Greater Bloemfontein Area 51<br />
areas on the aerial magnetic contour map denote sedimentary rocks. Dolerite intrusives such as dykes and<br />
sill structures are denoted as the red and yellow areas of the aerial magnetics map.<br />
The available aerial magnetic data available for the study area are of a low resolution, which brings about<br />
that the smaller dolerite dyke structures occurring within the area cannot be detected due to the spacing of<br />
the flight lines for the aerial magnetic survey. The potential dolerite dykes denoted on the aerial magnetics<br />
map was determined by means of aerial photo interpretations as well as geological maps.<br />
Geological Map Interpretation<br />
The geological map interpretation of the Dewetsdorp study area revealed 26 potential dolerite dyke<br />
structures, which confirms the aerial photo interpretations, which also indicated the potential presence of<br />
these dolerite structures.<br />
RECHARGE WATER BUDGET CALCULATIONS AND ESTIMATED THEORETICAL YIELDS OF<br />
POTENTIAL DOLERITE DYKE STRUCTURES<br />
The following section evaluates the theoretical groundwater resource potential of the identified potential<br />
dolerite dyke structures by means of recharge water budget calculations based on potential minicatchments<br />
of dolerite dyke groups as well as theoretical yields of the structures based on average<br />
sustainable yield calculations by means of aquifer test pumping of borehole fields in the Karoo Super Group<br />
geology.<br />
Note that these resource potential calculations are only rough approximations of the potential sustainable<br />
yield volumes. The only method of determining the sustainable yield volume of a dolerite structure(s) is by<br />
geophysical siting, percussion drilling and aquifer test pumping of the borehole(s). Long-term groundwater<br />
monitoring is also important to observed and understand the aquifer dynamics. After sufficient data is<br />
generated a numerical model flow may be constructed to determine the capture zones of the individual<br />
boreholes as well as the capture zone of the well field as a whole.<br />
Recharge Water Budget Calculations<br />
The estimate recharge volume scenarios are based on a 2% and a 3% recharge percentages of the annual<br />
mean rainfall (592.7 mm/a, Surface Water Resources of South Africa, 1990) as well as recharge<br />
estimations according to the Groundwater Resources of South Africa (<strong>DWA</strong>F, 1995) and the Vegter<br />
Recharge Map (1995).<br />
It must be noted that the recharge volume calculations are only estimates of recharge to the estimated minicatchments<br />
of the dyke groups. The aim of the recharge volume calculations is to estimate the available<br />
recharge volume available to the dyke groups in the study area. The assumption thus made is that the<br />
available recharge volume correlates roughly to the sustainable yield available from the dolerite dyke<br />
groups. This method is only a rough approximation of potential sustainable yields due to that the<br />
sustainability of the intrusive structure is a function of the capture zone, which in turn entails the dynamics<br />
of the aquifer system (The Water budget Myth Revisited; Why Hydrogeologist Model, Bredehoeft, 2002).<br />
The main to tool for investigating the capture zone and aquifer dynamics is the numerical groundwater<br />
model. Unfortunately not enough geohydrological information exists in terms of aquifer parameters to<br />
construct such a model. Therefore only rough estimation can be made regarding the groundwater resource<br />
potential.<br />
The results of the groundwater resource potential estimations based on recharge volume scenarios are as<br />
follows:<br />
Estimated groundwater resource potential is estimated for Dyke Group A as approximately<br />
1 845 m 3 /d.<br />
Estimated groundwater resource potential is estimated for Dyke Group B as approximately<br />
2 570 m 3 /d.<br />
Appendix 4 – Groundwater Potential Study for Small Towns June 2012
Water Reconciliation Strategy Study for the Bulk Water Supply Systems: Greater Bloemfontein Area 52<br />
Estimated groundwater resource potential is estimated for Dyke Groups C as approximately 1 057<br />
m 3 /d.<br />
Estimated groundwater resource potential is estimated for Dyke Group D as approximately 647 m 3 /d.<br />
Estimated groundwater resource potential is estimated for Dyke Group E as approximately 1 072<br />
m 3 /d.<br />
Estimated groundwater resource potential is estimated for Dyke Group F as approximately 2 469<br />
m 3 /d.<br />
The estimated high growth scenario for the average annual daily water demand for Dewetsdorp was<br />
obtained from Aurecon and is 3 203 m 3 /d or kl/d. The estimated recharge area needed to address the<br />
above demand is approximately 52.0 km 2 .<br />
Estimation of Theoretical Potential Yield of the Dolerite Dyke Structures<br />
The theoretical potential yield or groundwater resource potential estimation of the dolerite dyke structure in<br />
this section is based on the geometric mean of sustainable yield calculations of borehole fields in the Karoo<br />
Super Group geology. The aquifer test data for the geometric mean utilised were taken from the borehole<br />
fields of Petrusburg, Philipstown, Edenville, Colesberg, Igomotseng, Winburg, Brandfort and the Drie<br />
Susters Area<br />
The groundwater resource potential is calculated by utilising the above mentioned geometric mean of 60.48<br />
m 3 /d per borehole or 2.1 L/s per borehole based on an 8-hour pump cycle and 16-hour recovery period per<br />
day. The length of the potential structures were taken into account whereby a borehole was spaced on the<br />
structure every 250 metres. Therefore the number of the boreholes that can be spaced on the structure<br />
multiplied by the geometric mean (2.1 L/s over 8-hours a day) is equal to the estimated groundwater<br />
resource potential of the dolerite dyke structure.<br />
The assumptions of the method are as follows:<br />
That potential dolerite dykes are water bearing.<br />
An average geometric mean sustainable yield of 60.48 m 3 /d or 2.1 L/s with an 8-hour pump schedule<br />
and a 14 recovery period per borehole (Geometric mean average obtained from borehole fields of<br />
Petrusburg, Philipstown, Edenville, Colesberg, Igomotseng, Winburg, Brandfort and the Drie Susters<br />
Area).<br />
Spacing of the boreholes every 250 m along the strike of the dolerite dyke structure (note that no<br />
boreholes are placed at the end points of the structures).<br />
The results of the potential yields of the dolerite dyke groups based on the geometric mean of sustainable<br />
yield calculations are as follows:<br />
The groundwater resource potential for Dyke Group A is estimated at 5 867 m 3 /d. The number of<br />
dykes of the dolerite group is 8 with a combined length of 27.45 km upon, which 97 potential<br />
boreholes are spaced for calculation purposes.<br />
The groundwater resource potential for Dyke Group B is estimated at 6 169 m 3 /d. The number of<br />
dykes of the dolerite group is 4 with a combined length of 27.80 km upon, which 102 potential<br />
boreholes are spaced for calculation purposes.<br />
The groundwater resource potential for Dyke Group C is estimated at 2 177 m 3 /d. The number of<br />
dykes of the dolerite group is 3 with a combined length of 10.60 km upon, which 36 potential<br />
boreholes are spaced for calculation purposes.<br />
The groundwater resource potential for Dyke Group D is estimated at 786 m 3 /d. The number of<br />
dykes of the dolerite group is 5 with a combined length of 5.30 km upon, which 13 potential<br />
boreholes are spaced for calculation purposes.<br />
Appendix 4 – Groundwater Potential Study for Small Towns June 2012
Water Reconciliation Strategy Study for the Bulk Water Supply Systems: Greater Bloemfontein Area 53<br />
The groundwater resource potential for Dyke Group E is estimated at 1 452 m 3 /d. The number of<br />
dykes of the dolerite group is 3 with a combined length of 8.0 km upon, which 24 potential boreholes<br />
are spaced for calculation purposes.<br />
The groundwater resource potential for Dyke Group F is estimated at 4 657 m 3 /d. The number of<br />
dykes of the dolerite group is 7 with a combined length of 22.90 km upon, which 77 potential<br />
boreholes are spaced for calculation purposes.<br />
Summary of the Results Groundwater Resource Potential of the Intrusive Dolerite Structures<br />
This section combines the groundwater potential estimation, which includes the recharge based approach<br />
as the lower boundary and the geometric mean approach as the upper boundary of the estimated<br />
groundwater potential range. The summary of the estimated groundwater resource potential for the<br />
delineated dyke groups are as follows:<br />
The groundwater resource potential for Dyke Group A is estimated in the order of between 1 845 to<br />
5 867 m 3 /d.<br />
The groundwater resource potential for Dyke Group B is estimated in the order of between 2 570 to<br />
6 169 m 3 /d.<br />
The groundwater resource potential for Dyke Group C is estimated in the order of between 1 057 to<br />
2 177 m 3 /d.<br />
The groundwater resource potential for Dyke Group D is estimated in the order of between 647 to<br />
786 m 3 /d.<br />
The groundwater resource potential for Dyke Group E is estimated in the order of between 1 072 to<br />
1 452 m 3 /d.<br />
The groundwater resource potential for Dyke Group F is estimated in the order of between 2 469 to<br />
4 657 m 3 /d.<br />
The estimated costing for developing the proposed borehole fields only includes the cost for the<br />
geophysical siting, percussion drilling, aquifer test pumping, pump equipment and pump house structure<br />
costs of the proposed borehole fields and do not include the cost of the surface infrastructure such as the<br />
electrical supply lines and pipeline networks and associated reservoirs etc.<br />
The estimated costing for developing the borehole fields are as follows:<br />
The estimated cost for the development of the borehole field for Dyke Group A is R 17 848 000<br />
The estimated cost for the development of the borehole field for Dyke Group B is R 18 258 000<br />
The estimated cost for the development of the borehole field for Dyke Group C is R 6 444 000<br />
The estimated cost for the development of the borehole field for Dyke Group D is R 2 327 000<br />
The estimated cost for the development of the borehole field for Dyke Group E is R 4 296 000<br />
The estimated cost for the development of the borehole field for Dyke Group F is R 13 783 000<br />
DETERMINATION OF HIGH GROUN<strong>DWA</strong>TER ABSTRACTION AREAS<br />
A high groundwater abstraction area hydrocensus was conducted to determine if groundwater is utilised<br />
extensively in a 10 -15 km radius around the community of Dewetsdorp. The hydrocensus was undertaken<br />
by means of aerial photographs. Ten irrigation pivots were identified to the west of Dewetsdorp.<br />
It is important to note that the irrigation pivots are situated next to non-perennial streams and dams.<br />
Therefore it is more likely that these irrigation pivots utilised surface water than groundwater. It is<br />
recommended that these areas be investigated to confirm the observation. Groundwater is also utilised by<br />
many farmers for domestic purposes at their farmsteads. Groundwater uses may include, drinking water<br />
purposes, washing of clothes and food preparation as well as watering of the farmstead gardens.<br />
Appendix 4 – Groundwater Potential Study for Small Towns June 2012
Water Reconciliation Strategy Study for the Bulk Water Supply Systems: Greater Bloemfontein Area 54<br />
FINAL CONCLUSIONS AND RECOMMENDATIONS<br />
It is concluded that 26 potential dolerite dykes was observed that can be further investigated. Information<br />
absent regarding the observed dolerite structures are that it is currently unknown if these structures are<br />
water bearing. If so what the true sustainable yields are of these structures, not the estimate yields, as well<br />
as the associated groundwater qualities.<br />
The desktop study indicate that it is viable to further investigate the groundwater resources of Dewetsdorp<br />
based on the numerous potential dolerite dykes observed in the vicinity of Dewetsdorp. It is recommended<br />
that any future orientated groundwater exploration study at least include the following components:<br />
Geophysical siting of groundwater exploration boreholes;<br />
Percussion drilling of the boreholes;<br />
Aquifer test pumping of successfully drilled exploration boreholes according to <strong>DWA</strong> specifications to<br />
determine the sustainable yields of the newly drilled boreholes;<br />
Sampling of all successfully drilled boreholes to determine the groundwater quality of the local site<br />
aquifer;<br />
Aquifer test pumping analyses of data to calculate sustainable yields and pump schedules.<br />
Compilation of a Geohydrological <strong>Report</strong>.<br />
Appendix 4 – Groundwater Potential Study for Small Towns June 2012
Water Reconciliation Strategy Study for the Bulk Water Supply Systems: Greater Bloemfontein Area 55<br />
5. REDDERSBURG<br />
The study area is located in north eastern part of the Free State Province in Water Management Area 13.<br />
The study area is also located in Drainage Area C, Quaternary sub-catchment C51A and to a lesser extent<br />
in C51B (Surface Water Resources of South Africa, First Edition, 1994).<br />
5.1 CLIMATE<br />
The investigated area has hot summers and cool winters, and a predominantly summer rainfall. The air<br />
temperatures range from an average maximum of 30 to 32 o C in January to an average minimum of 0 to 2 o C<br />
in July, meaning conditions with hot summers and cold winters (South African Atlas of Agrohydrology and –<br />
Climatology, 1997).<br />
The mean annual rainfall is 490.8 mm/a, which occurs mainly as thunderstorms but soft rains also do occur<br />
(Rainfall Station Gauge No.: 0231 279, Reddersburg Police Station, Surface Water Resources of South<br />
Africa, 1990).<br />
5.2 GEOLOGY<br />
5.2.1 General aquifer information for Reddersburg<br />
The following section is based on the Groundwater Resources of South Africa Maps, <strong>DWA</strong>F, 1995.<br />
The groundwater component of river flow (base flow) is negligible in the Reddersburg district (refer to<br />
Figure 2.3). The groundwater depth in the study area is approximately 10 – 20 mbgl (standard deviation<br />
range from mean is between 8 – 15 m), refer to Figure 2.4. The mean annual recharge of the area are<br />
between 15 - 25 mm/a (refer to Figure 2.5).<br />
In general the recommended drilling depths are 20 to 30 metres or deeper for the study area. The storage<br />
types of the aquifer quantified as fractures restricted principally to a zone below the groundwater level.<br />
Pores in disintegrated / decomposed, partly decomposed rock and fractures which are principally restricted<br />
to a zone directly below the groundwater level. Storage coefficient in order of magnitude for the study area<br />
is 0.001 to 0.01.<br />
Appendix 4 – Groundwater Potential Study for Small Towns June 2012
Water Reconciliation Strategy Study for the Bulk Water Supply Systems: Greater Bloemfontein Area 56<br />
Figure 5.1: Locality Map of the Reddersburg Study Area<br />
Appendix 4 – Groundwater Potential Study for Small Towns June 2012
Water Reconciliation Strategy Study for the Bulk Water Supply Systems: Greater Bloemfontein Area 57<br />
Figure 5.2: Geological Map of the Reddersburg Study Area<br />
Appendix 4 – Groundwater Potential Study for Small Towns June 2012
Water Reconciliation Strategy Study for the Bulk Water Supply Systems: Greater Bloemfontein Area 58<br />
5.3 GROUN<strong>DWA</strong>TER POTENTIAL INVESTIGATIONS<br />
This section includes the geophysical information obtained during the survey to detect possible geological<br />
features and structures, which may act as preferential pathways for groundwater flow, which may act as<br />
target areas for groundwater exploration for water supply purposes.<br />
5.3.1 Aerial photo interpretation<br />
The aerial photo interpretation of the Reddersburg study area revealed 52 potential dolerite dyke structures<br />
that can be verified by means of geophysical methods and percussion drilling. The dolerite dyke structures<br />
are considered the primary targets for groundwater exploration in the Karoo Supergroup geology. The<br />
aerial photo map of the study area can be viewed in Figure 5.3.<br />
5.3.2 Results of the aerial data interpretation<br />
The aerial magnetic map revealed numerous dolerite sill intrusions in the study area (refer to Figure 5.4).<br />
The study area is located on the sedimentary rocks of the Beaufort Group of the Karoo Supergroup. The<br />
green and blue area on the aerial magnetic contour map denotes sedimentary rocks. Dolerite intrusives<br />
such as dykes and sill structures are denoted as the red and pinkish / purple areas of the aerial magnetics<br />
map.<br />
The available aerial magnetic data available for the study area are of a low resolution, which brings about<br />
that the smaller dolerite dyke structures occurring within the area cannot be detected due to the spacing of<br />
the flight lines for the aerial magnetic survey. The potential dolerite dykes denoted on the aerial magnetics<br />
map was determined by means of aerial photo interpretations as well as geological maps.<br />
5.3.3 Geological map interpretations<br />
The geological map interpretation of the Reddersburg study area revealed 52 potential dolerite dyke<br />
structures, which confirms the aerial photo interpretations, which also indicated the potential presence of<br />
these dolerite structures. The aerial photo map of the study area can be viewed in Figure 5.5.<br />
Appendix 4 – Groundwater Potential Study for Small Towns June 2012
Water Reconciliation Strategy Study for the Bulk Water Supply Systems: Greater Bloemfontein Area 59<br />
Figure 5.3: Locality Map of the Aerial Photo Interpretations of the Reddersburg Study Area<br />
Appendix 4 – Groundwater Potential Study for Small Towns June 2012
Water Reconciliation Strategy Study for the Bulk Water Supply Systems: Greater Bloemfontein Area 60<br />
Figure 5.4: Aerial Magnetic Data Contour Map for the Reddersburg Area. Note that the red and pinkish / purple areas denote areas of Higher Magnetic Intensity that are associated with Dolerite Sill Intrusions. The green<br />
and blue areas refer to Sedimentary Rocks of the Beaufort Group (Karoo Supergroup)<br />
Appendix 4 – Groundwater Potential Study for Small Towns June 2012
Water Reconciliation Strategy Study for the Bulk Water Supply Systems: Greater Bloemfontein Area 61<br />
Figure 5.5: Geological Map of the Reddersburg Study Area. The Geological Map confirms the presence of at least 52 Potential Dolerite Dykes as determined by the Aerial Photo Interpretations<br />
Appendix 4 – Groundwater Potential Study for Small Towns June 2012
Water Reconciliation Strategy Study for the Bulk Water Supply Systems: Greater Bloemfontein Area 62<br />
5.4 RECHARGE WATER BUDGET CALCULATIONS AND ESTIMATED<br />
THEORETICAL YIELDS OF POTENTIAL DOLERITE STRUCTURES<br />
The following section evaluates the theoretical groundwater resource potential of the identified potential<br />
dolerite dyke structures by means of recharge water budget calculations based on potential minicatchments<br />
of dolerite dyke groups as well as theoretical yields of the structures based on average<br />
sustainable yield calculations by means of aquifer test pumping of borehole fields in the Karoo Super Group<br />
geology.<br />
Note that these resource potential calculations are only rough approximations of the potential sustainable<br />
yield volumes. The only method of determining the sustainable yield volume of a dolerite structure(s) is by<br />
geophysical siting, percussion drilling and aquifer test pumping of the borehole(s). Long-term groundwater<br />
monitoring is also important to observed and understand the aquifer dynamics. After sufficient data is<br />
generated a numerical model flow may be constructed to determine the capture zones of the individual<br />
boreholes as well as the capture zone of the well field as a whole.<br />
5.4.1 Recharge water budget calculations<br />
The estimate recharge volume scenarios are based on a 2% and a 3% recharge percentages of the annual<br />
mean rainfall (440.7 mm/a, Surface Water Resources of South Africa, 1990) as well as recharge<br />
estimations according to the Groundwater Resources of South Africa (<strong>DWA</strong>F, 1995) and the Vegter<br />
Recharge Map (1995). The recharge maps can be viewed in Figure 2.5 and Figure 2.6.<br />
It must be noted that the recharge volume calculations are only estimates of recharge to the estimated minicatchments<br />
of the dyke groups as delineated in Figure 5.6 and Figure 5.7. The aim of the recharge<br />
volume calculations is to estimate the available recharge volume available to the dyke groups in the study<br />
area. The assumption thus made is that the available recharge volume correlates roughly to the<br />
sustainable yield available from the dolerite dyke groups. This method is only a rough approximation of<br />
potential sustainable yields due to that the sustainability of the intrusive structure is a function of the capture<br />
zone, which in turn entails the dynamics of the aquifer system (The Water budget Myth Revisited; Why<br />
Hydrogeologist Model, Bredehoeft, 2002). The main to tool for investigating the capture zone and aquifer<br />
dynamics is the numerical groundwater model. Unfortunately not enough geohydrological information<br />
exists in terms of aquifer parameters to construct such a model. Therefore only rough estimation can be<br />
made regarding the groundwater resource potential.<br />
The results of the groundwater resource potential estimations based on recharge volume scenarios are as<br />
follows (the summary of the recharge volumes can be studied in Table 5.1):<br />
Estimated groundwater resource potential is estimated for Dyke Group A as approximately 966 m 3 /d<br />
(refer to Table 5.2).<br />
Estimated groundwater resource potential is estimated for Dyke Group B as approximately 1 211<br />
m 3 /d (refer to Table 5.3).<br />
Estimated groundwater resource potential is estimated for Dyke Groups C as approximately 1 936<br />
m 3 /d (refer to Table 5.4).<br />
Estimated groundwater resource potential is estimated for Dyke Group D as approximately 628 m 3 /d<br />
(refer to Table 5.5).<br />
Estimated groundwater resource potential is estimated for Dyke Group E as approximately 2 414<br />
m 3 /d (refer to Table 5.6).<br />
Estimated groundwater resource potential is estimated for Dyke Group F as approximately 597 m 3 /d<br />
(refer to Table 5.7).<br />
Appendix 4 – Groundwater Potential Study for Small Towns June 2012
Water Reconciliation Strategy Study for the Bulk Water Supply Systems: Greater Bloemfontein Area 63<br />
The estimated high growth scenario for the average annual daily water demand for Reddersburg was<br />
obtained from Aurecon and is 3 992 m 3 /d or kl/d. The estimated recharge area needed to address the<br />
above demand is approximately 64.76 km 2 .<br />
Table 5.1: Summary of the Average Available Recharge to the Dyke Groups. The assumption<br />
thus made is that the Available Recharge Volume correlates roughly to the<br />
Sustainable Yield Available from the Dolerite Dyke Groups<br />
Dyke Group Name<br />
Average Recharge Available To Dyke Groups<br />
Estimation of Recharge Volume<br />
(m 3 /a)<br />
Estimation of Recharge Volume<br />
(m 3 /d)<br />
Dyke Group A 352 586 966<br />
Dyke Group B 441 914 1 211<br />
Dyke Group C 706 748 1 936<br />
Dyke Group D 229 057 628<br />
Dyke Group E 881 128 2 414<br />
Dyke Group F 218 032 597<br />
Total 2 829 466 7 752<br />
Assumptions:<br />
* Note that the recharge volume calculations are a function of the mean annual rainfall of the area,<br />
recharge percentage assigned and the surface area of the dyke group catchment. Also note that the<br />
estimated available recharge to the aquifer is only available for abstraction purposes if sufficient<br />
dolerite dykes structures and associated fractures are available in geology of the site aquifer.<br />
* Note the average recharge volumes in this table are based on the recharge percentages as obtained<br />
from the Vegter Maps and <strong>DWA</strong>F Groundwater Resources of South Africa Maps.<br />
Table 5.2: Recharge Volume Calculation Scenarios for Dyke Group A<br />
Dyke Group<br />
Name<br />
Dyke Group A<br />
Assumptions:<br />
Recharge Scenario<br />
Estimation of Dyke<br />
Group Catchment Area<br />
(m 2 )<br />
Average Rainfall<br />
(mm/a)<br />
Recharge<br />
Percentage<br />
(%)<br />
Recharge<br />
(mm/a)<br />
Estimation of<br />
Recharge Volume<br />
(m 3 /a)<br />
Estimation of<br />
Recharge Volume<br />
(m 3 /d)<br />
2% Recharge 15 670 000 490.8 2.0 10 153 817 421<br />
3% Recharge 15 670 000 490.8 3.0 15 230 725 632<br />
Vegter Map Recharge,<br />
(20 mm/a)<br />
<strong>DWA</strong>F, Groundwater<br />
Resources of SA Recharge (25 mm/a)<br />
15 670 000 490.8 4.1 20 313 325 858<br />
15 670 000 490.8 5.1 25 391 848 1 074<br />
Average:<br />
(Vegter Map & <strong>DWA</strong>F, SA GW Resources)<br />
* Note that the recharge volume calculations are a function of the mean annual rainfall of the area, recharge percentage assigned and the surface area of the dyke group<br />
catchment. Also note that the estimated available recharge to the aquifer is only available for abstraction purposes if sufficient dolerite dykes structures and associated<br />
fractures are available in geology of the site aquifer.<br />
Appendix 4 – Groundwater Potential Study for Small Towns June 2012<br />
966
Water Reconciliation Strategy Study for the Bulk Water Supply Systems: Greater Bloemfontein Area 64<br />
Table 5.3: Recharge Volume Calculation Scenarios for Dyke Group B<br />
Dyke Group<br />
Name<br />
Dyke Group B<br />
Recharge Scenario<br />
Estimation of Dyke<br />
Group Catchment Area<br />
(m 2 )<br />
Average Rainfall<br />
(mm/a)<br />
Recharge<br />
Percentage<br />
(%)<br />
Recharge<br />
(mm/a)<br />
Table 5.4: Recharge Volume Calculation Scenarios for Dyke Group C<br />
Table 5.5: Recharge Volume Calculation Scenarios for Dyke Group D<br />
Estimation of<br />
Recharge Volume<br />
(m 3 /a)<br />
Estimation of<br />
Recharge Volume<br />
(m 3 /d)<br />
2% Recharge 19 640 000 490.8 2.0 10 192 786 528<br />
3% Recharge 19 640 000 490.8 3.0 15 289 179 792<br />
Vegter Map Recharge,<br />
(20 mm/a)<br />
<strong>DWA</strong>F, Groundwater<br />
Resources of SA Recharge (25 mm/a)<br />
19 640 000 490.8 4.1 20 392 706 1 076<br />
19 640 000 490.8 5.1 25 491 123 1 346<br />
Average:<br />
(Vegter Map & <strong>DWA</strong>F, SA GW Resources)<br />
Assumptions:<br />
* Note that the recharge volume calculations are a function of the mean annual rainfall of the area, recharge percentage assigned and the surface area of the dyke group<br />
catchment. Also note that the estimated available recharge to the aquifer is only available for abstraction purposes if sufficient dolerite dykes structures and associated<br />
fractures are available in geology of the site aquifer.<br />
Dyke Group<br />
Name<br />
Dyke Group C<br />
Recharge Scenario<br />
Estimation of Dyke<br />
Group Catchment Area<br />
(m 2 )<br />
Average Rainfall<br />
(mm/a)<br />
Recharge<br />
Percentage<br />
(%)<br />
Recharge<br />
(mm/a)<br />
Estimation of<br />
Recharge Volume<br />
(m 3 /a)<br />
Appendix 4 – Groundwater Potential Study for Small Towns June 2012<br />
1 211<br />
Estimation of<br />
Recharge Volume<br />
(m 3 /d)<br />
2% Recharge 31 410 000 490.8 2.0 10 308 321 845<br />
3% Recharge 31 410 000 490.8 3.0 15 462 481 1 267<br />
Vegter Map Recharge,<br />
(20 mm/a)<br />
<strong>DWA</strong>F, Groundwater<br />
Resources of SA Recharge (25 mm/a)<br />
31 410 000 490.8 4.1 20 628 049 1 721<br />
31 410 000 490.8 5.1 25 785 447 2 152<br />
Average:<br />
(Vegter Map & <strong>DWA</strong>F, SA GW Resources)<br />
Assumptions:<br />
* Note that the recharge volume calculations are a function of the mean annual rainfall of the area, recharge percentage assigned and the surface area of the dyke group<br />
catchment. Also note that the estimated available recharge to the aquifer is only available for abstraction purposes if sufficient dolerite dykes structures and associated<br />
fractures are available in geology of the site aquifer.<br />
Dyke Group<br />
Name<br />
Dyke Group D<br />
Recharge Scenario<br />
Estimation of Dyke<br />
Group Catchment Area<br />
(m 2 )<br />
Average Rainfall<br />
(mm/a)<br />
Recharge<br />
Percentage<br />
(%)<br />
Recharge<br />
(mm/a)<br />
Estimation of<br />
Recharge Volume<br />
(m 3 /a)<br />
1 936<br />
Estimation of<br />
Recharge Volume<br />
(m 3 /d)<br />
2% Recharge 10 180 000 490.8 2.0 10 99 927 274<br />
3% Recharge 10 180 000 490.8 3.0 15 149 890 411<br />
Vegter Map Recharge,<br />
(20 mm/a)<br />
<strong>DWA</strong>F, Groundwater<br />
Resources of SA Recharge (25 mm/a)<br />
10 180 000 490.8 4.1 20 203 551 558<br />
10 180 000 490.8 5.1 25 254 564 697<br />
Average:<br />
(Vegter Map & <strong>DWA</strong>F, SA GW Resources)<br />
Assumptions:<br />
* Note that the recharge volume calculations are a function of the mean annual rainfall of the area, recharge percentage assigned and the surface area of the dyke group<br />
catchment. Also note that the estimated available recharge to the aquifer is only available for abstraction purposes if sufficient dolerite dykes structures and associated<br />
fractures are available in geology of the site aquifer.<br />
628
Water Reconciliation Strategy Study for the Bulk Water Supply Systems: Greater Bloemfontein Area 65<br />
Table 5.6: Recharge Volume Calculation Scenarios for Dyke Group E<br />
Dyke Group<br />
Name<br />
Dyke Group E<br />
Assumptions:<br />
Recharge Scenario<br />
Estimation of Dyke<br />
Group Catchment Area<br />
(m 2 )<br />
Average Rainfall<br />
(mm/a)<br />
Recharge<br />
Percentage<br />
(%)<br />
Recharge<br />
(mm/a)<br />
Table 5.7: Recharge Volume Calculation Scenarios for Dyke Group F<br />
Estimation of<br />
Recharge Volume<br />
(m 3 /a)<br />
Estimation of<br />
Recharge Volume<br />
(m 3 /d)<br />
2% Recharge 39 160 000 490.8 2.0 10 384 395 1 053<br />
3% Recharge 39 160 000 490.8 3.0 15 576 592 1 580<br />
Vegter Map Recharge,<br />
(20 mm/a)<br />
<strong>DWA</strong>F, Groundwater<br />
Resources of SA Recharge (25 mm/a)<br />
39 160 000 490.8 4.1 20 783 012 2 145<br />
39 160 000 490.8 5.1 25 979 245 2 683<br />
Average:<br />
(Vegter Map & <strong>DWA</strong>F, SA GW Resources)<br />
* Note that the recharge volume calculations are a function of the mean annual rainfall of the area, recharge percentage assigned and the surface area of the dyke group<br />
catchment. Also note that the estimated available recharge to the aquifer is only available for abstraction purposes if sufficient dolerite dykes structures and associated<br />
fractures are available in geology of the site aquifer.<br />
Dyke Group<br />
Name<br />
Dyke Group F<br />
Assumptions:<br />
Recharge Scenario<br />
Estimation of Dyke<br />
Group Catchment Area<br />
(m 2 )<br />
Average Rainfall<br />
(mm/a)<br />
Recharge<br />
Percentage<br />
(%)<br />
Recharge<br />
(mm/a)<br />
Estimation of<br />
Recharge Volume<br />
(m 3 /a)<br />
Appendix 4 – Groundwater Potential Study for Small Towns June 2012<br />
2 414<br />
Estimation of<br />
Recharge Volume<br />
(m 3 /d)<br />
2% Recharge 9 690 000 490.8 2.0 10 95 117 261<br />
3% Recharge 9 690 000 490.8 3.0 15 142 676 391<br />
Vegter Map Recharge,<br />
(20 mm/a)<br />
<strong>DWA</strong>F, Groundwater<br />
Resources of SA Recharge (25 mm/a)<br />
9 690 000 490.8 4.1 20 193 753 531<br />
9 690 000 490.8 5.1 25 242 311 664<br />
Average:<br />
(Vegter Map & <strong>DWA</strong>F, SA GW Resources)<br />
* Note that the recharge volume calculations are a function of the mean annual rainfall of the area, recharge percentage assigned and the surface area of the dyke group<br />
catchment. Also note that the estimated available recharge to the aquifer is only available for abstraction purposes if sufficient dolerite dykes structures and associated<br />
fractures are available in geology of the site aquifer.<br />
597
Water Reconciliation Strategy Study for the Bulk Water Supply Systems: Greater Bloemfontein Area 66<br />
Figure 5.6: Locality Map of the Delineated Dolerite Dyke Groups near Reddersburg as utilised for the Groundwater Resource Potential Estimation<br />
Appendix 4 – Groundwater Potential Study for Small Towns June 2012
Water Reconciliation Strategy Study for the Bulk Water Supply Systems: Greater Bloemfontein Area 67<br />
Figure 5.7: Locality Map of the estimated Mini-Catchments of the Dyke Groups near Reddersburg<br />
Appendix 4 – Groundwater Potential Study for Small Towns June 2012
Water Reconciliation Strategy Study for the Bulk Water Supply Systems: Greater Bloemfontein Area 68<br />
5.5 ESTIMATION OF THEORETICAL POTENTIAL YIELD OF THE DOLERITE<br />
STRUCTURES<br />
The theoretical potential yield or groundwater resource potential estimation of the dolerite dyke structure in<br />
this section is based on the geometric mean of sustainable yield calculations of borehole fields in the Karoo<br />
Super Group geology. The aquifer test data for the geometric mean utilised were taken from the borehole<br />
fields of Petrusburg, Philipstown, Edenville, Colesberg, Igomotseng, Winburg, Brandfort and the Drie<br />
Susters Area.<br />
The groundwater resource potential is calculated by utilising the above mentioned geometric mean of 60.48<br />
m 3 /d per borehole or 2.1 L/s per borehole based on an 8-hour pump cycle and 16-hour recovery period per<br />
day. The length of the potential structures were taken into account whereby a borehole was spaced on the<br />
structure every 250 metres. Therefore the number of the boreholes that can be spaced on the structure<br />
multiplied by the geometric mean (2.1 L/s over 8-hours a day) is equal to the estimated groundwater<br />
resource potential of the dolerite dyke structure.<br />
The assumptions of the method are as follows:<br />
That potential dolerite dykes are water bearing.<br />
An average geometric mean sustainable yield of 60.48 m 3 /d or 2.1 L/s with an 8-hour pump schedule<br />
and a 14 recovery period per borehole (Geometric mean average obtained from borehole fields of<br />
Petrusburg, Philipstown, Edenville, Colesberg, Igomotseng, Winburg, Brandfort and the Drie Susters<br />
Area).<br />
Spacing of the boreholes every 250 m along the strike of the dolerite dyke structure (note that no<br />
boreholes are placed at the end points of the structures).<br />
The results of the potential yields of the dolerite dyke groups based on the geometric mean of sustainable<br />
yield calculations are as follows (refer to Figure 5.6 as well as Table 5.8):<br />
The groundwater resource potential for Dyke Group A is estimated at 1 633 m 3 /d. The number of<br />
dykes of the dolerite group is 2 with a combined length of 9.17 km upon, which 27 potential<br />
boreholes are spaced for calculation purposes.<br />
The groundwater resource potential for Dyke Group B is estimated at 1 512 m 3 /d. The number of<br />
dykes of the dolerite group is 3 with a combined length of 10.78 km upon, which 25 potential<br />
boreholes are spaced for calculation purposes.<br />
The groundwater resource potential for Dyke Group C is estimated at 4 657 m 3 /d. The number of<br />
dykes of the dolerite group is 3 with a combined length of 23.90 km upon, which 77 potential<br />
boreholes are spaced for calculation purposes.<br />
The groundwater resource potential for Dyke Group D is estimated at 968 m 3 /d. The number of<br />
dykes of the dolerite group is 6 with a combined length of 6.44 km upon, which 16 potential<br />
boreholes are spaced for calculation purposes.<br />
The groundwater resource potential for Dyke Group E is estimated at 3 629 m 3 /d. The number of<br />
dykes of the dolerite group is 4 with a combined length of 20.0 km upon, which 60 potential<br />
boreholes are spaced for calculation purposes.<br />
The groundwater resource potential for Dyke Group F is estimated at 1 210 m 3 /d. The number of<br />
dykes of the dolerite group is 2 with a combined length of 8.91 km upon, which 20 potential<br />
boreholes are spaced for calculation purposes.<br />
Appendix 4 – Groundwater Potential Study for Small Towns June 2012
Water Reconciliation Strategy Study for the Bulk Water Supply Systems: Greater Bloemfontein Area 69<br />
Table 5.8: Theoretically Estimated Dyke Group Yields or Groundwater Resource Potential<br />
based on the Geometric Mean of Sustainable Yields of Karoo Borehole Fields, see<br />
assumption section below the table for further information regarding the<br />
calculations<br />
Dyke Group<br />
Name<br />
Theoretically Estimated Dyke Group Yields (Geomean)<br />
Number of<br />
Dykes<br />
Total Length<br />
of Dykes<br />
(km)<br />
Number of Potential<br />
Boreholes<br />
(250 m Spacing)<br />
Estimated Yield<br />
of Dyke Groups<br />
(m 3 /d)<br />
A 2 9.17 27 1 633<br />
B 3 10.78 25 1 512<br />
C 3 23.90 77 4 657<br />
D 6 6.44 16 968<br />
E 4 20.00 60 3 629<br />
F 2 8.91 20 1 210<br />
Total 20 79.204 225 13 608<br />
Assumptions:<br />
* That potential dolerite dykes are water bearing.<br />
* An average geomean sustainable yield of 60.48 m<br />
* Refer to Dyke Group Map for the spatial localities.<br />
3 /d base on a 2.1 L/s with a 8-hour<br />
pump schedule and a 14 recovery period per borehole (Geomean average obtained from<br />
borehole fields of Petrusburg, Philipstown, Edenville, Colesberg, Igomotseng, Winburg,<br />
Brandfort and the Drie Susters Area).<br />
* Spacing of the boreholes every 250 m along the strike of the dolerite dyke structure<br />
(note that no boreholes are placed at the end points of the structures).<br />
5.6 SUMMARY OF THE RESULTS – GROUN<strong>DWA</strong>TER RESOURCE POTENTIAL<br />
OF THE INTRUSIVE DOLERITE STRUCTURES<br />
This section combines the groundwater potential estimation, which includes the recharge based approach<br />
as the lower boundary and the geometric mean approach as the upper boundary of the estimated<br />
groundwater potential range. The summary of the estimated groundwater resource potential for the<br />
delineated dyke groups are as follows (refer to Figure 5.6):<br />
The groundwater resource potential for Dyke Group A is estimated in the order of between 966 to<br />
1 633 m 3 /d.<br />
The groundwater resource potential for Dyke Group B is estimated in the order of between 1 211 to<br />
1 512 m 3 /d.<br />
The groundwater resource potential for Dyke Group C is estimated in the order of between 1 936 to<br />
4 657 m 3 /d.<br />
The groundwater resource potential for Dyke Group D is estimated in the order of between 628 to<br />
968 m 3 /d.<br />
The groundwater resource potential for Dyke Group E is estimated in the order of between 2 414 to<br />
3 629 m 3 /d.<br />
The groundwater resource potential for Dyke Group F is estimated in the order of between 597 to<br />
1 210 m 3 /d.<br />
Appendix 4 – Groundwater Potential Study for Small Towns June 2012
Water Reconciliation Strategy Study for the Bulk Water Supply Systems: Greater Bloemfontein Area 70<br />
5.6.1 Cost estimate of developing the proposed borehole fields<br />
The estimated costing for developing the proposed borehole fields only includes the cost for the<br />
geophysical siting, percussion drilling, aquifer test pumping, pump equipment and pump house structure<br />
costs of the proposed borehole fields and do not include the cost of the surface infrastructure such as the<br />
electrical supply lines and pipeline networks and associated reservoirs etc.<br />
The estimated costing for developing the borehole fields are as follows (refer to Table 5.9):<br />
The estimated cost for the development of the borehole field for Dyke Group A is R 4 968 000<br />
The estimated cost for the development of the borehole field for Dyke Group B is R 4 475 000<br />
The estimated cost for the development of the borehole field for Dyke Group C is R 13 783 000<br />
The estimated cost for the development of the borehole field for Dyke Group D is R 2 864 000<br />
The estimated cost for the development of the borehole field for Dyke Group E is R 10 740 000<br />
The estimated cost for the development of the borehole field for Dyke Group F is R 3 580 000<br />
Table 5.9: Estimation of the Borehole Field Development Cost for the Dyke Groups. Note that<br />
the Costing does not make provision for Surface Infrastructure such as Electrical<br />
Supply Lines and Pipeline Networks etc<br />
Dyke Group<br />
Name<br />
Number of<br />
Boreholes to be<br />
Developed<br />
Es ti m ate d<br />
Potential<br />
Yield<br />
(m 3 /d)<br />
Estimation of the Borehole Field Development Cost for the Dyke Groups<br />
Geophysical &<br />
Geohydrological<br />
Activity Costs<br />
Cost of Percussion<br />
Drilling of the<br />
Boreholes<br />
Aquifer Test<br />
Pumping Cost of<br />
Boreholes<br />
Pumping<br />
Equ i pm e n t C os t<br />
Pump House<br />
Structure Cost<br />
5.7 DETERMINATION OF HIGH GROUN<strong>DWA</strong>TER ABSTRACTION AREAS<br />
Total C os t of<br />
Borehole Field<br />
(Excl. Vat)<br />
Dyke Group A 27 966 - 1 633 R 594 000.00 R 1 350 000.00 R 594 000.00 R 675 000.00 R 1 755 000.00 R 4 968 000.00<br />
Dyke Group B 25 1 211 - 1 512 R 550 000.00 R 1 250 000.00 R 550 000.00 R 500 000.00 R 1 625 000.00 R 4 475 000.00<br />
Dyke Group C 77 1 936 - 4 657 R 1 694 000.00 R 3 850 000.00 R 1 694 000.00 R 1 540 000.00 R 5 005 000.00 R 13 783 000.00<br />
Dyke Group D 16 628 - 968 R 352 000.00 R 800 000.00 R 352 000.00 R 320 000.00 R 1 040 000.00 R 2 864 000.00<br />
Dyke Group E 60 2 414 - 3 629 R 1 320 000.00 R 3 000 000.00 R 1 320 000.00 R 1 200 000.00 R 3 900 000.00 R 10 740 000.00<br />
Dyke Group F 20 597 - 1 210 R 440 000.00 R 1 000 000.00 R 440 000.00 R 400 000.00 R 1 300 000.00 R 3 580 000.00<br />
Total Cost R 40 410 000.00<br />
* Note that the above costing only includes the geophysical siting, percussion drilling, aquifer test pumping, pump equipment and pump house structure costs of the proposed<br />
borehole fields and do not include the cost of the surface infrastructure such as the electrical supply lines and pipeline networks etc.<br />
A high groundwater abstraction area hydrocensus was conducted to determine if groundwater is utilised<br />
extensively in a 10 -15 km radius around the community of Reddersburg. The hydrocensus was<br />
undertaken by means of aerial photographs. Nine irrigation pivots were identified to the east of<br />
Reddersburg (refer to Figure 5.8). The coordinates of the irrigation pivots can be viewed in Table 5.10.<br />
Appendix 4 – Groundwater Potential Study for Small Towns June 2012
Water Reconciliation Strategy Study for the Bulk Water Supply Systems: Greater Bloemfontein Area 71<br />
Table 5.10: Coordinates of the Identified Irrigation Pivots<br />
Coordinates (WGS84)<br />
Pivot Site Name<br />
Eas t S ou th<br />
Pivot A 26.23138 -29.65522<br />
Pivot B 26.23431 -29.65539<br />
Pivot C 26.23269 -29.65776<br />
Pivot D 26.23411 -29.66012<br />
Pivot E 26.23664 -29.66160<br />
Pivot F 26.23755 -29.66327<br />
Pivot G 26.30232 -29.67022<br />
Pivot H 26.31555 -29.63979<br />
Pivot I 26.29655 -29.58655<br />
It is important to note that the irrigation pivots are situated next to the Riet River and other non-perennial<br />
streams (refer to Figure 5.8). Therefore it is more likely that these irrigation pivots utilised surface water<br />
than groundwater. It is recommended that these areas be investigated to confirm the observation.<br />
Groundwater is also utilised by many farmers for domestic purposes at their farmsteads. Groundwater<br />
uses may include, drinking water purposes, washing of clothes and food preparation as well as watering of<br />
the farmstead gardens.<br />
Appendix 4 – Groundwater Potential Study for Small Towns June 2012
Water Reconciliation Strategy Study for the Bulk Water Supply Systems: Greater Bloemfontein Area 72<br />
Figure 5.8: Locality Map of the Potential High Groundwater Abstraction Areas in the vicinity of Reddersburg. Note that the Irrigation Pivots are situated next to the Riet River and other Non-Perennial Streams. Therefore it<br />
is more likely that these Pivots utilised Surface Water than Groundwater. It is recommended that these areas be investigated to confirm the observation<br />
Appendix 4 – Groundwater Potential Study for Small Towns June 2012
Water Reconciliation Strategy Study for the Bulk Water Supply Systems: Greater Bloemfontein Area 73<br />
5.8 CONCLUSIONS AND RECOMMENDATIONS<br />
The following conclusions and recommendations are based on the information supplied in this report:<br />
CATCHMENT<br />
The study area is located in north eastern part of the Free State Province in Water Management Area 13.<br />
The study area is also located in Drainage Area C, Quaternary sub-catchment C51A and to a lesser extent<br />
in C51B.<br />
CLIMATE<br />
The investigated area has hot summers and cool winters, and a predominantly summer rainfall. The air<br />
temperatures range from an average maximum of 30 to 32 o C in January to an average minimum of 0 to 2 o C<br />
in July, meaning conditions with hot summers and cold winters (South African Atlas of Agrohydrology and –<br />
Climatology, 1997).<br />
The mean annual rainfall is 490.8 mm/a, which occurs mainly as thunderstorms but soft rains also do occur<br />
(Rainfall Station Gauge No.: 0231 279, Reddersburg Police Station, Surface Water Resources of South<br />
Africa, 1990).<br />
GEOLOGY<br />
The geology of the Reddersburg district consists of the Karoo Super Group geology and more specifically<br />
of the Beaufort Group.<br />
The whole sedimentary sequence has been intruded by dolerite dyke and sill structures. The dolerite dykes<br />
are the primary targets for groundwater resource development.<br />
GENERAL AQUIFER INFORMATION OF THE REDDERSBURG DISTRICT<br />
The following section is based on the Groundwater Resources of South Africa Maps, <strong>DWA</strong>F, 1995.<br />
The groundwater component of river flow (base flow) is negligible in the Reddersburg district. The<br />
groundwater depth in the study area is approximately 10 – 20 mbgl (standard deviation range from mean is<br />
between 8 – 15 m). The mean annual recharge of the area are between 15 - 25 mm/a.<br />
In general the recommended drilling depths are 20 to 30 metres or deeper for the study area. The storage<br />
types of the aquifer quantified as fractures restricted principally to a zone below the groundwater level.<br />
Pores in disintegrated / decomposed, partly decomposed rock and fractures which are principally restricted<br />
to a zone directly below the groundwater level. Storage coefficient in order of magnitude for the study area<br />
is 0.001 to 0.01.<br />
GROUN<strong>DWA</strong>TER POTENTIAL INVESTIGATION<br />
This section includes the geophysical information obtained during the survey to detect possible geological<br />
features and structures, which may act as preferential pathways for groundwater flow, which may act as<br />
target areas for groundwater exploration for water supply purposes.<br />
Aerial Photo Interpretation<br />
The aerial photo interpretation of the Reddersburg study area revealed 52 potential dolerite dyke structures<br />
that can be verified by means of geophysical methods and percussion drilling. The dolerite dyke structures<br />
are considered the primary targets for groundwater exploration in the Karoo Supergroup geology.<br />
Aerial Magnetic Data Interpretation<br />
The aerial magnetic map revealed numerous dolerite sill intrusions in the study area. The study area is<br />
located on the sedimentary rocks of the Beaufort Group of the Karoo Supergroup. The green and blue area<br />
Appendix 4 – Groundwater Potential Study for Small Towns June 2012
Water Reconciliation Strategy Study for the Bulk Water Supply Systems: Greater Bloemfontein Area 74<br />
on the aerial magnetic contour map denotes sedimentary rocks. Dolerite intrusives such as dykes and sill<br />
structures are denoted as the red and pinkish / purple areas of the aerial magnetics map.<br />
The available aerial magnetic data available for the study area are of a low resolution, which brings about<br />
that the smaller dolerite dyke structures occurring within the area cannot be detected due to the spacing of<br />
the flight lines for the aerial magnetic survey. The potential dolerite dykes denoted on the aerial magnetics<br />
map was determined by means of aerial photo interpretations as well as geological maps.<br />
Geological Map Interpretation<br />
The geological map interpretation of the Reddersburg study area revealed 52 potential dolerite dyke<br />
structures, which confirms the aerial photo interpretations, which also indicated the potential presence of<br />
these dolerite structures.<br />
RECHARGE WATER BUDGET CALCULATIONS AND ESTIMATED THEORETICAL YIELDS OF<br />
POTENTIAL DOLERITE DYKE STRUCTURES<br />
The following section evaluates the theoretical groundwater resource potential of the identified potential<br />
dolerite dyke structures by means of recharge water budget calculations based on potential minicatchments<br />
of dolerite dyke groups as well as theoretical yields of the structures based on average<br />
sustainable yield calculations by means of aquifer test pumping of borehole fields in the Karoo Super Group<br />
geology.<br />
Note that these resource potential calculations are only rough approximations of the potential sustainable<br />
yield volumes. The only method of determining the sustainable yield volume of a dolerite structure(s) is by<br />
geophysical siting, percussion drilling and aquifer test pumping of the borehole(s). Long-term groundwater<br />
monitoring is also important to observed and understand the aquifer dynamics. After sufficient data is<br />
generated a numerical model flow may be constructed to determine the capture zones of the individual<br />
boreholes as well as the capture zone of the well field as a whole.<br />
Recharge Water Budget Calculations<br />
The estimate recharge volume scenarios are based on a 2% and a 3% recharge percentages of the annual<br />
mean rainfall (440.7 mm/a, Surface Water Resources of South Africa, 1990) as well as recharge<br />
estimations according to the Groundwater Resources of South Africa (<strong>DWA</strong>F, 1995) and the Vegter<br />
Recharge Map (1995).<br />
It must be noted that the recharge volume calculations are only estimates of recharge to the estimated minicatchments<br />
of the dyke groups. The aim of the recharge volume calculations is to estimate the available<br />
recharge volume available to the dyke groups in the study area. The assumption thus made is that the<br />
available recharge volume correlates roughly to the sustainable yield available from the dolerite dyke<br />
groups. This method is only a rough approximation of potential sustainable yields due to that the<br />
sustainability of the intrusive structure is a function of the capture zone, which in turn entails the dynamics<br />
of the aquifer system (The Water budget Myth Revisited; Why Hydrogeologist Model, Bredehoeft, 2002).<br />
The main to tool for investigating the capture zone and aquifer dynamics is the numerical groundwater<br />
model. Unfortunately not enough geohydrological information exists in terms of aquifer parameters to<br />
construct such a model. Therefore only rough estimation can be made regarding the groundwater resource<br />
potential.<br />
The results of the groundwater resource potential estimations based on recharge volume scenarios are as<br />
follows:<br />
Estimated groundwater resource potential is estimated for Dyke Group A as approximately 966 m 3 /d<br />
Estimated groundwater resource potential is estimated for Dyke Group B as approximately 1 211<br />
m 3 /d.<br />
Estimated groundwater resource potential is estimated for Dyke Groups C as approximately 1 936<br />
m 3 /d.<br />
Appendix 4 – Groundwater Potential Study for Small Towns June 2012
Water Reconciliation Strategy Study for the Bulk Water Supply Systems: Greater Bloemfontein Area 75<br />
Estimated groundwater resource potential is estimated for Dyke Group D as approximately 628 m 3 /d.<br />
Estimated groundwater resource potential is estimated for Dyke Group E as approximately 2 414<br />
m 3 /d.<br />
Estimated groundwater resource potential is estimated for Dyke Group F as approximately 597 m 3 /d.<br />
The estimated high growth scenario for the average annual daily water demand for Reddersburg was<br />
obtained from Aurecon and is 3 992 m 3 /d or kl/d. The estimated recharge area needed to address the<br />
above demand is approximately 64.76 km 2 .<br />
Estimation of Theoretical Potential Yield of the Dolerite Dyke Structures<br />
The theoretical potential yield or groundwater resource potential estimation of the dolerite dyke structure in<br />
this section is based on the geometric mean of sustainable yield calculations of borehole fields in the Karoo<br />
Super Group geology. The aquifer test data for the geometric mean utilised were taken from the borehole<br />
fields of Petrusburg, Philipstown, Edenville, Colesberg, Igomotseng, Winburg, Brandfort and the Drie<br />
Susters Area<br />
The groundwater resource potential is calculated by utilising the above mentioned geometric mean of 60.48<br />
m 3 /d per borehole or 2.1 L/s per borehole based on an 8-hour pump cycle and 16-hour recovery period per<br />
day. The length of the potential structures were taken into account whereby a borehole was spaced on the<br />
structure every 250 metres. Therefore the number of the boreholes that can be spaced on the structure<br />
multiplied by the geometric mean (2.1 L/s over 8-hours a day) is equal to the estimated groundwater<br />
resource potential of the dolerite dyke structure.<br />
The assumptions of the method are as follows:<br />
That potential dolerite dykes are water bearing.<br />
An average geometric mean sustainable yield of 60.48 m 3 /d or 2.1 L/s with an 8-hour pump schedule<br />
and a 14 recovery period per borehole (Geometric mean average obtained from borehole fields of<br />
Petrusburg, Philipstown, Edenville, Colesberg, Igomotseng, Winburg, Brandfort and the Drie Susters<br />
Area).<br />
Spacing of the boreholes every 250 m along the strike of the dolerite dyke structure (note that no<br />
boreholes are placed at the end points of the structures).<br />
The results of the potential yields of the dolerite dyke groups based on the geometric mean of sustainable<br />
yield calculations are as follows:<br />
The groundwater resource potential for Dyke Group A is estimated at 1 633 m 3 /d. The number of<br />
dykes of the dolerite group is 2 with a combined length of 9.17 km upon, which 27 potential<br />
boreholes are spaced for calculation purposes.<br />
The groundwater resource potential for Dyke Group B is estimated at 1 512 m 3 /d. The number of<br />
dykes of the dolerite group is 3 with a combined length of 10.78 km upon, which 25 potential<br />
boreholes are spaced for calculation purposes.<br />
The groundwater resource potential for Dyke Group C is estimated at 4 657 m 3 /d. The number of<br />
dykes of the dolerite group is 3 with a combined length of 23.90 km upon, which 77 potential<br />
boreholes are spaced for calculation purposes.<br />
The groundwater resource potential for Dyke Group D is estimated at 968 m 3 /d. The number of<br />
dykes of the dolerite group is 6 with a combined length of 6.44 km upon, which 16 potential<br />
boreholes are spaced for calculation purposes.<br />
The groundwater resource potential for Dyke Group E is estimated at 3 629 m 3 /d. The number of<br />
dykes of the dolerite group is 4 with a combined length of 20.0 km upon, which 60 potential<br />
boreholes are spaced for calculation purposes.<br />
Appendix 4 – Groundwater Potential Study for Small Towns June 2012
Water Reconciliation Strategy Study for the Bulk Water Supply Systems: Greater Bloemfontein Area 76<br />
The groundwater resource potential for Dyke Group F is estimated at 1 210 m 3 /d. The number of<br />
dykes of the dolerite group is 2 with a combined length of 8.91 km upon, which 20 potential<br />
boreholes are spaced for calculation purposes.<br />
Summary of the Results Groundwater Resource Potential of the Intrusive Dolerite Structures<br />
This section combines the groundwater potential estimation, which includes the recharge based approach<br />
as the lower boundary and the geometric mean approach as the upper boundary of the estimated<br />
groundwater potential range. The summary of the estimated groundwater resource potential for the<br />
delineated dyke groups are as follows:<br />
The groundwater resource potential for Dyke Group A is estimated in the order of between 966 to<br />
1 633 m 3 /d.<br />
The groundwater resource potential for Dyke Group B is estimated in the order of between 1 211 to<br />
1 512 m 3 /d.<br />
The groundwater resource potential for Dyke Group C is estimated in the order of between 1 936 to<br />
4 657 m 3 /d.<br />
The groundwater resource potential for Dyke Group D is estimated in the order of between 628 to<br />
968 m 3 /d.<br />
The groundwater resource potential for Dyke Group E is estimated in the order of between 2 414 to<br />
3 629 m 3 /d.<br />
The groundwater resource potential for Dyke Group F is estimated in the order of between 597 to<br />
1 210 m 3 /d.<br />
The estimated costing for developing the proposed borehole fields only includes the cost for the<br />
geophysical siting, percussion drilling, aquifer test pumping, pump equipment and pump house structure<br />
costs of the proposed borehole fields and do not include the cost of the surface infrastructure such as the<br />
electrical supply lines and pipeline networks and associated reservoirs etc.<br />
The estimated costing for developing the borehole fields are as follows:<br />
The estimated cost for the development of the borehole field for Dyke Group A is R 4 968 000<br />
The estimated cost for the development of the borehole field for Dyke Group B is R 4 475 000<br />
The estimated cost for the development of the borehole field for Dyke Group C is R 13 783 000<br />
The estimated cost for the development of the borehole field for Dyke Group D is R 2 864 000<br />
The estimated cost for the development of the borehole field for Dyke Group E is R 10 740 000<br />
The estimated cost for the development of the borehole field for Dyke Group F is R 3 580 000<br />
DETERMINATION OF HIGH GROUN<strong>DWA</strong>TER ABSTRACTION AREAS<br />
A high groundwater abstraction area hydrocensus was conducted by GHT Consulting to determine if<br />
groundwater is utilised extensively in a 10 -15 km radius around the community of Reddersburg. The<br />
hydrocensus was undertaken by means of aerial photographs. Nine irrigation pivots were identified to the<br />
east of Reddersburg.<br />
It is important to note that the irrigation pivots are situated next to the Riet River and other non-perennial<br />
streams. Therefore it is more likely that these irrigation pivots utilised surface water than groundwater. It is<br />
recommended that these areas be investigated to confirm the observation. Groundwater is also utilised by<br />
many farmers for domestic purposes at their farmsteads. Groundwater uses may include, drinking water<br />
purposes, washing of clothes and food preparation as well as watering of the farmstead gardens.<br />
Appendix 4 – Groundwater Potential Study for Small Towns June 2012
Water Reconciliation Strategy Study for the Bulk Water Supply Systems: Greater Bloemfontein Area 77<br />
FINAL CONCLUSIONS AND RECOMMENDATIONS<br />
It is concluded that 52 potential dolerite dykes was observed that can be further investigated. Information<br />
absent regarding the observed dolerite structures are that it is currently unknown if these structures are<br />
water bearing. If so what the true sustainable yields are of these structures, not the estimate yields, as well<br />
as the associated groundwater qualities.<br />
The desktop study indicate that it is viable to further investigate the groundwater resources of Reddersburg<br />
based on the numerous potential dolerite dykes observed in the vicinity of Reddersburg. It is<br />
recommended that any future orientated groundwater exploration study at least include the following<br />
components:<br />
Geophysical siting of groundwater exploration boreholes;<br />
Percussion drilling of the boreholes;<br />
Aquifer test pumping of successfully drilled exploration boreholes according to <strong>DWA</strong> specifications to<br />
determine the sustainable yields of the newly drilled boreholes;<br />
Sampling of all successfully drilled boreholes to determine the groundwater quality of the local site<br />
aquifer;<br />
Aquifer test pumping analyses of data to calculate sustainable yields and pump schedules.<br />
Compilation of a Geohydrological <strong>Report</strong>.<br />
Appendix 4 – Groundwater Potential Study for Small Towns June 2012
Water Reconciliation Strategy Study for the Bulk Water Supply Systems: Greater Bloemfontein Area 78<br />
6. EDENBURG<br />
6.1 CLIMATE<br />
The investigated area has hot summers and cool winters, and a predominantly summer rainfall. The air<br />
temperatures range from an average maximum of 30 to 32 o C in January to an average minimum of 0 to 2 o C<br />
in July, meaning conditions with hot summers and cold winters (South African Atlas of Agrohydrology and –<br />
Climatology, 1997).<br />
The mean annual rainfall is 440.7 mm/a, which occurs mainly as thunderstorms but soft rains also do occur<br />
(Rainfall Station Gauge No.: 0230 764, Edenburg Police Station, Surface Water Resources of South Africa,<br />
1990).<br />
6.2 GEOLOGY<br />
6.2.1 General aquifer information of the Edenburg District<br />
The following section is based on the Groundwater Resources of South Africa Maps, <strong>DWA</strong>F, 1995.<br />
The groundwater component of river flow (base flow) is negligible in the Edenburg district (refer to Figure<br />
2.3). The groundwater depth in the study area is approximately 10 – 20 mbgl (standard deviation range<br />
from mean is between 8 – 15 m), refer to Figure 2.4. The mean annual recharge of the area are between<br />
15 - 25 mm/a (refer to Figure 2.3).<br />
In general the recommended drilling depths are 20 to 30 metres or deeper for the study area. The storage<br />
types of the aquifer quantified as fractures restricted principally to a zone below the groundwater level.<br />
Pores in disintegrated / decomposed, partly decomposed rock and fractures which are principally restricted<br />
to a zone directly below the groundwater level. Storage coefficient in order of magnitude for the study area<br />
is 0.001 to 0.01.<br />
Appendix 4 – Groundwater Potential Study for Small Towns June 2012
Water Reconciliation Strategy Study for the Bulk Water Supply Systems: Greater Bloemfontein Area 79<br />
Figure 6.1: Locality Map of the Edenburg Study Area<br />
Appendix 4 – Groundwater Potential Study for Small Towns June 2012
Water Reconciliation Strategy Study for the Bulk Water Supply Systems: Greater Bloemfontein Area 80<br />
Figure 6.2: Geological Map of the Edenburg Study Area<br />
Appendix 4 – Groundwater Potential Study for Small Towns June 2012
Water Reconciliation Strategy Study for the Bulk Water Supply Systems: Greater Bloemfontein Area 81<br />
6.3 GROUN<strong>DWA</strong>TER POTENTIAL INVESTIGATIONS<br />
6.3.1 Aerial photo interpretation<br />
The aerial photo interpretation of the Edenburg study area revealed 36 potential dolerite dyke structures<br />
that can be verified by means of geophysical methods and percussion drilling. The dolerite dyke structures<br />
are considered the primary targets for groundwater exploration in the Karoo Supergroup geology. The<br />
aerial photo map of the study area can be viewed in Figure 6.3.<br />
6.3.2 Results of the aerial data interpretation<br />
The aerial magnetic map revealed numerous dolerite sill intrusions in the study area (refer to Figure 6.4).<br />
The study area is located on the sedimentary rocks of the Adelaide Subgroup (Beaufort Group) of the<br />
Karoo Supergroup. The green and blue area on the aerial magnetic contour map denotes sedimentary<br />
rocks. Dolerite intrusives such as dykes and sill structures are denoted as the yellow, red and pinkish /<br />
purple areas of the aerial magnetics map.<br />
The available aerial magnetic data available for the study area are of a low resolution, which brings about<br />
that the smaller dolerite dyke structures occurring within the area cannot be detected due to the spacing of<br />
the flight lines for the aerial magnetic survey. The potential dolerite dykes denoted on the aerial magnetics<br />
map was determined by means of aerial photo interpretations as well as geological maps.<br />
6.3.3 Geological map interpretations<br />
The geological map interpretation of the Edenburg study area revealed 36 potential dolerite dyke<br />
structures, which confirms the aerial photo interpretations, which also indicated the potential presence of<br />
these dolerite structures. The aerial photo map of the study area can be viewed in Figure 6.5.<br />
Appendix 4 – Groundwater Potential Study for Small Towns June 2012
Water Reconciliation Strategy Study for the Bulk Water Supply Systems: Greater Bloemfontein Area 82<br />
Figure 6.3: Locality Map of the Aerial Photo Interpretations of the Edenburg Study Area<br />
Appendix 4 – Groundwater Potential Study for Small Towns June 2012
Water Reconciliation Strategy Study for the Bulk Water Supply Systems: Greater Bloemfontein Area 83<br />
Figure 6.4: Aerial Magnetic Data Contour Map for the Edenburg Area. Note that the yellow, red and pinkish / purple areas denote areas of higher magnetic intensity that are associated with Dolerite Sill Intrusions. The light<br />
green and blue areas refer to sedimentary rocks of the Adelaide Subgroup of the Beaufort Group (Karoo Supergroup)<br />
Appendix 4 – Groundwater Potential Study for Small Towns June 2012
Water Reconciliation Strategy Study for the Bulk Water Supply Systems: Greater Bloemfontein Area 84<br />
Figure 6.5: Geological Map of the Edenburg Study Area. The Geological Map confirms the Presence of at least 36 Potential Dolerite Dykes as determined by the Aerial Photo Interpretations<br />
Appendix 4 – Groundwater Potential Study for Small Towns June 2012
Water Reconciliation Strategy Study for the Bulk Water Supply Systems: Greater Bloemfontein Area 85<br />
6.4 RECHARGE WATER BUDGET CALCULATIONS AND ESTIMATED<br />
THEORETICAL YIELD OF POTENTIAL DOLERITE DYKE STRUCTURES<br />
The following section evaluates the theoretical groundwater resource potential of the identified potential<br />
dolerite dyke structures by means of recharge water budget calculations based on potential minicatchments<br />
of dolerite dyke groups as well as theoretical yields of the structures based on average<br />
sustainable yield calculations by means of aquifer test pumping of borehole fields in the Karoo Super Group<br />
geology.<br />
Note that these resource potential calculations are only rough approximations of the potential sustainable<br />
yield volumes. The only method of determining the sustainable yield volume of a dolerite structure(s) is by<br />
geophysical siting, percussion drilling and aquifer test pumping of the borehole(s). Long-term groundwater<br />
monitoring is also important to observed and understand the aquifer dynamics. After sufficient data is<br />
generated a numerical model flow may be constructed to determine the capture zones of the individual<br />
boreholes as well as the capture zone of the well field as a whole.<br />
6.4.1 Recharge water budget calculations<br />
The estimate recharge volume scenarios are based on a 2% and a 3% recharge percentages of the annual<br />
mean rainfall (440.7 mm/a, Surface Water Resources of South Africa, 1990) as well as recharge<br />
estimations according to the Groundwater Resources of South Africa (<strong>DWA</strong>F, 1995) and the Vegter<br />
Recharge Map (1995). The recharge maps can be viewed in Figure 2.5 and Figure 2.6.<br />
It must be noted that the recharge volume calculations are only estimates of recharge to the estimated minicatchments<br />
of the dyke groups as delineated in Figure 6.6 and Figure 6.7. The aim of the recharge<br />
volume calculations is to estimate the available recharge volume available to the dyke groups in the study<br />
area. The assumption thus made is that the available recharge volume correlates roughly to the<br />
sustainable yield available from the dolerite dyke groups. This method is only a rough approximation of<br />
potential sustainable yields due to that the sustainability of the intrusive structure is a function of the capture<br />
zone, which in turn entails the dynamics of the aquifer system (The Water budget Myth Revisited; Why<br />
Hydrogeologist Model, Bredehoeft, 2002). The main to tool for investigating the capture zone and aquifer<br />
dynamics is the numerical groundwater model. Unfortunately not enough geohydrological information<br />
exists in terms of aquifer parameters to construct such a model. Therefore only rough estimation can be<br />
made regarding the groundwater resource potential.<br />
The results of the groundwater resource potential estimations based on recharge volume scenarios are as<br />
follows (the summary of the recharge volumes can be studied in Table 6.1):<br />
Estimated groundwater resource potential is estimated for Dyke Group A as approximately 567 m 3 /d<br />
(refer to Table 6.2).<br />
Estimated groundwater resource potential is estimated for Dyke Group B as approximately 1 110<br />
m 3 /d (refer to Table 6.3).<br />
Estimated groundwater resource potential is estimated for Dyke Groups C1 & C2 as approximately<br />
1 708 m 3 /d (refer to Table 6.4).<br />
Estimated groundwater resource potential is estimated for Dyke Group D as approximately 765 m 3 /d<br />
(refer to Table 6.5).<br />
Estimated groundwater resource potential is estimated for Dyke Group E as approximately 1 135<br />
m 3 /d (refer to Table 6.6).<br />
Estimated groundwater resource potential is estimated for Dyke Group F as approximately 395 m 3 /d<br />
(refer to Table 6.7).<br />
Appendix 4 – Groundwater Potential Study for Small Towns June 2012
Water Reconciliation Strategy Study for the Bulk Water Supply Systems: Greater Bloemfontein Area 86<br />
The estimated high growth scenario for the average annual daily water demand for Edenburg was obtained<br />
from Aurecon and is 3 213 m 3 /d or kl/d. The estimated recharge area needed to address the above<br />
demand is approximately 52.12 km 2 .<br />
Table 6.1: Summary of the Average Available Recharge to the Dyke Groups. The assumption<br />
thus made is that the Available Recharge Volume correlates roughly to the<br />
Sustainable Yield available from the Dolerite Dyke Groups<br />
Dyke Group Name<br />
Estimation of Recharge Volume<br />
(m 3 /a)<br />
Estimation of Recharge Volume<br />
(m 3 /d)<br />
Dyke Group A 207 081 567<br />
Dyke Group B 405 158 1 110<br />
Dyke Group C1 & C2 623 492 1 708<br />
Dyke Group D 279 109 765<br />
Dyke Group E 414 161 1 135<br />
Dyke Group F 144 056 395<br />
Total 2 073 056 5 680<br />
Assumptions:<br />
Average Recharge Available To Dyke Groups<br />
* Note that the recharge volume calculations are a function of the mean annual rainfall of the area,<br />
recharge percentage assigned and the surface area of the dyke group catchment. Also note that the<br />
estimated available recharge to the aquifer is only available for abstraction purposes if sufficient<br />
dolerite dykes structures and associated fractures are available in geology of the site aquifer.<br />
* Note the average recharge volumes in this table are based on the recharge percentages as obtained<br />
from the Vegter Maps and <strong>DWA</strong>F Groundwater Resources of South Africa Maps.<br />
Table 6.2: Recharge Volume Calculation Scenarios for Dyke Group A<br />
Dyke Group<br />
Name<br />
Dyke Group A<br />
Assumptions:<br />
Recharge Scenario<br />
Es ti m ati on of Dyk e<br />
Group Catchment Area<br />
(m 2 )<br />
Average Rainfall<br />
(mm/a)<br />
Recharge<br />
Percentage<br />
(%)<br />
Recharge<br />
(mm/a)<br />
Esti m ati on of<br />
Recharge Volume<br />
(m 3 /a)<br />
Es ti m ati on of<br />
Recharge Volume<br />
(m 3 /d)<br />
2% Recharge 9 200 000 440.7 2.0 9 81 089 222<br />
3% Recharge 9 200 000 440.7 3.0 13 121 633 333<br />
Vegter Map Recharge,<br />
(20 mm/a)<br />
<strong>DWA</strong>F, Groundwater<br />
Resources of SA Recharge (25 mm/a)<br />
9 200 000 440.7 4.5 20 184 112 504<br />
9 200 000 440.7 5.7 25 230 049 630<br />
Average:<br />
(Vegter Map & <strong>DWA</strong>F, SA GW Resources)<br />
* Note that the recharge volume calculations are a function of the mean annual rainfall of the area, recharge percentage assigned and the surface area of the dyke group<br />
catchment. Also note that the estimated available recharge to the aquifer is only available for abstraction purposes if sufficient dolerite dykes structures and associated<br />
fractures are available in geology of the site aquifer.<br />
Appendix 4 – Groundwater Potential Study for Small Towns June 2012<br />
567
Water Reconciliation Strategy Study for the Bulk Water Supply Systems: Greater Bloemfontein Area 87<br />
Table 6.3: Recharge Volume Calculation Scenarios for Dyke Group B<br />
Dyke Group<br />
Name<br />
Dyke Group B<br />
Recharge Scenario<br />
Es ti m ati on of Dyk e<br />
Group Catchment Area<br />
(m 2 )<br />
Average Rainfall<br />
(mm/a)<br />
Recharge<br />
Percentage<br />
(%)<br />
Recharge<br />
(mm/a)<br />
Table 6.4: Recharge Volume Calculation Scenarios for Dyke Group C1 & C2<br />
Table 6.5: Recharge Volume Calculation Scenarios for Dyke Group D<br />
Esti m ati on of<br />
Recharge Volume<br />
(m 3 /a)<br />
Es ti m ati on of<br />
Recharge Volume<br />
(m 3 /d)<br />
2% Recharge 18 000 000 440.7 2.0 9 158 652 435<br />
3% Recharge 18 000 000 440.7 3.0 13 237 978 652<br />
Vegter Map Recharge,<br />
(20 mm/a)<br />
<strong>DWA</strong>F, Groundwater<br />
Resources of SA Recharge (25 mm/a)<br />
18 000 000 440.7 4.5 20 360 219 987<br />
18 000 000 440.7 5.7 25 450 096 1 233<br />
Average:<br />
(Vegter Map & <strong>DWA</strong>F, SA GW Resources)<br />
Assumptions:<br />
* Note that the recharge volume calculations are a function of the mean annual rainfall of the area, recharge percentage assigned and the surface area of the dyke group<br />
catchment. Also note that the estimated available recharge to the aquifer is only available for abstraction purposes if sufficient dolerite dykes structures and associated<br />
fractures are available in geology of the site aquifer.<br />
Dyke Group<br />
Name<br />
Dyke Group C1 & C2<br />
Recharge Scenario<br />
Es ti m ati on of Dyk e<br />
Group Catchment Area<br />
(m 2 )<br />
Average Rainfall<br />
(mm/a)<br />
Recharge<br />
Percentage<br />
(%)<br />
Recharge<br />
(mm/a)<br />
Esti m ati on of<br />
Recharge Volume<br />
(m 3 /a)<br />
Appendix 4 – Groundwater Potential Study for Small Towns June 2012<br />
1 110<br />
Es ti m ati on of<br />
Recharge Volume<br />
(m 3 /d)<br />
2% Recharge 27 700 000 440.7 2.0 9 244 148 669<br />
3% Recharge 27 700 000 440.7 3.0 13 366 222 1 003<br />
Vegter Map Recharge,<br />
(20 mm/a)<br />
<strong>DWA</strong>F, Groundwater<br />
Resources of SA Recharge (25 mm/a)<br />
27 700 000 440.7 4.5 20 554 338 1 519<br />
27 700 000 440.7 5.7 25 692 647 1 898<br />
Average:<br />
(Vegter Map & <strong>DWA</strong>F, SA GW Resources)<br />
Assumptions:<br />
* Note that the recharge volume calculations are a function of the mean annual rainfall of the area, recharge percentage assigned and the surface area of the dyke group<br />
catchment. Also note that the estimated available recharge to the aquifer is only available for abstraction purposes if sufficient dolerite dykes structures and associated<br />
fractures are available in geology of the site aquifer.<br />
Dyke Group<br />
Name<br />
Dyke Group D<br />
Recharge Scenario<br />
Es ti m ati on of Dyk e<br />
Group Catchment Area<br />
(m 2 )<br />
Average Rainfall<br />
(mm/a)<br />
Recharge<br />
Percentage<br />
(%)<br />
Recharge<br />
(mm/a)<br />
Esti m ati on of<br />
Recharge Volume<br />
(m 3 /a)<br />
1 708<br />
Es ti m ati on of<br />
Recharge Volume<br />
(m 3 /d)<br />
2% Recharge 12 400 000 440.7 2.0 9 109 294 299<br />
3% Recharge 12 400 000 440.7 3.0 13 163 940 449<br />
Vegter Map Recharge,<br />
(20 mm/a)<br />
<strong>DWA</strong>F, Groundwater<br />
Resources of SA Recharge (25 mm/a)<br />
12 400 000 440.7 4.5 20 248 151 680<br />
12 400 000 440.7 5.7 25 310 066 849<br />
Average:<br />
(Vegter Map & <strong>DWA</strong>F, SA GW Resources)<br />
Assumptions:<br />
* Note that the recharge volume calculations are a function of the mean annual rainfall of the area, recharge percentage assigned and the surface area of the dyke group<br />
catchment. Also note that the estimated available recharge to the aquifer is only available for abstraction purposes if sufficient dolerite dykes structures and associated<br />
fractures are available in geology of the site aquifer.<br />
765
Water Reconciliation Strategy Study for the Bulk Water Supply Systems: Greater Bloemfontein Area 88<br />
Table 6.6: Recharge Volume Calculation Scenarios for Dyke Group E<br />
Dyke Group<br />
Name<br />
Dyke Group E<br />
Assumptions:<br />
Recharge Scenario<br />
Es ti m ati on of Dyk e<br />
Group Catchment Area<br />
(m 2 )<br />
Average Rainfall<br />
(mm/a)<br />
Recharge<br />
Percentage<br />
(%)<br />
Recharge<br />
(mm/a)<br />
Table 6.7: Recharge Volume Calculation Scenarios for Dyke Group F<br />
Esti m ati on of<br />
Recharge Volume<br />
(m 3 /a)<br />
Es ti m ati on of<br />
Recharge Volume<br />
(m 3 /d)<br />
2% Recharge 18 400 000 440.7 2.0 9 162 178 444<br />
3% Recharge 18 400 000 440.7 3.0 13 243 266 666<br />
Vegter Map Recharge,<br />
(20 mm/a)<br />
<strong>DWA</strong>F, Groundwater<br />
Resources of SA Recharge (25 mm/a)<br />
18 400 000 440.7 4.5 20 368 224 1 009<br />
18 400 000 440.7 5.7 25 460 098 1 261<br />
Average:<br />
(Vegter Map & <strong>DWA</strong>F, SA GW Resources)<br />
* Note that the recharge volume calculations are a function of the mean annual rainfall of the area, recharge percentage assigned and the surface area of the dyke group<br />
catchment. Also note that the estimated available recharge to the aquifer is only available for abstraction purposes if sufficient dolerite dykes structures and associated<br />
fractures are available in geology of the site aquifer.<br />
Dyke Group<br />
Name<br />
Dyke Group F<br />
Assumptions:<br />
Recharge Scenario<br />
Es ti m ati on of Dyk e<br />
Group Catchment Area<br />
(m 2 )<br />
Average Rainfall<br />
(mm/a)<br />
Recharge<br />
Percentage<br />
(%)<br />
Recharge<br />
(mm/a)<br />
Esti m ati on of<br />
Recharge Volume<br />
(m 3 /a)<br />
Appendix 4 – Groundwater Potential Study for Small Towns June 2012<br />
1 135<br />
Es ti m ati on of<br />
Recharge Volume<br />
(m 3 /d)<br />
2% Recharge 6 400 000 440.7 2.0 9 56 410 155<br />
3% Recharge 6 400 000 440.7 3.0 13 84 614 232<br />
Vegter Map Recharge,<br />
(20 mm/a)<br />
<strong>DWA</strong>F, Groundwater<br />
Resources of SA Recharge (25 mm/a)<br />
6 400 000 440.7 4.5 20 128 078 351<br />
6 400 000 440.7 5.7 25 160 034 438<br />
Average:<br />
(Vegter Map & <strong>DWA</strong>F, SA GW Resources)<br />
* Note that the recharge volume calculations are a function of the mean annual rainfall of the area, recharge percentage assigned and the surface area of the dyke group<br />
catchment. Also note that the estimated available recharge to the aquifer is only available for abstraction purposes if sufficient dolerite dykes structures and associated<br />
fractures are available in geology of the site aquifer.<br />
395
Water Reconciliation Strategy Study for the Bulk Water Supply Systems: Greater Bloemfontein Area 89<br />
Figure 6.6: Locality Map of the Delineated Dolerite Dyke Groups near Edenburg as utilised for the Groundwater Resource Potential Estimation<br />
Appendix 4 – Groundwater Potential Study for Small Towns June 2012
Water Reconciliation Strategy Study for the Bulk Water Supply Systems: Greater Bloemfontein Area 90<br />
Figure 6.7: Locality Map of the Estimated Mini-Catchments of the Dyke Groups near Edenburg<br />
Appendix 4 – Groundwater Potential Study for Small Towns June 2012
Water Reconciliation Strategy Study for the Bulk Water Supply Systems: Greater Bloemfontein Area 91<br />
6.5 ESTIMATION OF THEORETICAL POTENTIAL YIELD OF THE DOLERITE<br />
DYKE STRUCTURES<br />
The theoretical potential yield or groundwater resource potential estimation of the dolerite dyke structure in<br />
this section is based on the geometric mean of sustainable yield calculations of borehole fields in the Karoo<br />
Super Group geology. The aquifer test data for the geometric mean utilised were taken from the borehole<br />
fields of Petrusburg, Philipstown, Edenville, Colesberg, Igomotseng, Winburg, Brandfort and the Drie<br />
Susters Area.<br />
The groundwater resource potential is calculated by utilising the above mentioned geometric mean of<br />
60.48 m 3 /d per borehole or 2.1 L/s per borehole based on an 8-hour pump cycle and 16-hour recovery<br />
period per day. The length of the potential structures were taken into account whereby a borehole was<br />
spaced on the structure every 250 metres. Therefore the number of the boreholes that can be spaced on<br />
the structure multiplied by the geometric mean (2.1 L/s over 8-hours a day) is equal to the estimated<br />
groundwater resource potential of the dolerite dyke structure.<br />
The assumptions of the method are as follows:<br />
That potential dolerite dykes are water bearing.<br />
An average geometric mean sustainable yield of 60.48 m 3 /d or 2.1 L/s with an 8-hour pump schedule<br />
and a 14 recovery period per borehole (Geometric mean average obtained from borehole fields of<br />
Petrusburg, Philipstown, Edenville, Colesberg, Igomotseng, Winburg, Brandfort and the Drie Susters<br />
Area).<br />
Spacing of the boreholes every 250 m along the strike of the dolerite dyke structure (note that no<br />
boreholes are placed at the end points of the structures).<br />
The results of the potential yields of the dolerite dyke groups based on the geometric mean of sustainable<br />
yield calculations are as follows (refer to Figure 6.6 as well as Table 6.8):<br />
The groundwater resource potential for Dyke Group A is estimated at 1 270 m 3 /d. The number of<br />
dykes of the dolerite group is 2 with a combined length of 6.28 km upon, which 21 potential<br />
boreholes are spaced for calculation purposes.<br />
The groundwater resource potential for Dyke Group B is estimated at 1 391 m 3 /d. The number of<br />
dykes of the dolerite group is 3 with a combined length of 7.40 km upon, which 23 potential<br />
boreholes are spaced for calculation purposes.<br />
The groundwater resource potential for Dyke Group C1 & C2 is estimated at 2 964 m 3 /d. The<br />
number of dykes of the dolerite group is 10 with a combined length of 15.96 km upon, which 49<br />
potential boreholes are spaced for calculation purposes.<br />
The groundwater resource potential for Dyke Group D is estimated at 968 m 3 /d. The number of<br />
dykes of the dolerite group is 6 with a combined length of 6.29 km upon, which 16 potential<br />
boreholes are spaced for calculation purposes.<br />
The groundwater resource potential for Dyke Group E is estimated at 2 117 m 3 /d. The number of<br />
dykes of the dolerite group is 4 with a combined length of 10.67 km upon, which 35 potential<br />
boreholes are spaced for calculation purposes.<br />
The groundwater resource potential for Dyke Group F is estimated at 544 m 3 /d. The number of<br />
dykes of the dolerite group is 2 with a combined length of 3.34 km upon, which 9 potential boreholes<br />
are spaced for calculation purposes.<br />
Appendix 4 – Groundwater Potential Study for Small Towns June 2012
Water Reconciliation Strategy Study for the Bulk Water Supply Systems: Greater Bloemfontein Area 92<br />
Table 6.8: Theoretically Estimated Dyke Group Yields or Groundwater Resource Potential<br />
based on the Geometric Mean of Sustainable Yields of Karoo Borehole Fields, see<br />
assumption section below the table for further information regarding the<br />
calculations<br />
Dyke Group<br />
Name<br />
Theoretically Estimated Dyke Group Yields (Geomean)<br />
Number of<br />
Dykes<br />
Total Length<br />
of Dykes<br />
(km)<br />
Number of Potential<br />
Boreholes<br />
(250 m Spacing)<br />
Estimated Yield<br />
of Dyke Groups<br />
(m 3 /d)<br />
A 2 6.28 21 1 270<br />
B 3 7.40 23 1 391<br />
C1 7 9.56 29 1 754<br />
C2 3 6.40 20 1 210<br />
D 6 6.29 16 968<br />
E 4 10.67 35 2 117<br />
F 2 3.34 9 544<br />
Total 27 49.94 153 9 253<br />
Assumptions:<br />
* That potential dolerite dykes are water bearing.<br />
* An average geomean sustainable yield of 60.48 m<br />
* Refer to Dyke Group Map for the spatial localities.<br />
3 /d base on a 2.1 L/s with a 8-hour<br />
pump schedule and a 14 recovery period per borehole (Geomean average obtained from<br />
borehole fields of Petrusburg, Philipstown, Edenville, Colesberg, Igomotseng, Winburg,<br />
Brandfort and the Drie Susters Area).<br />
* Spacing of the boreholes every 250 m along the strike of the dolerite dyke structure<br />
(note that no boreholes are placed at the end points of the structures).<br />
6.6 SUMMARY OF THE RESULTS – GROUN<strong>DWA</strong>TER RESOURCE POTENTIAL<br />
OF THE INTRUSIVE DOLERITE STRUCTURES<br />
This section combines the groundwater potential estimation, which includes the recharge based approach<br />
as the lower boundary and the geometric mean approach as the upper boundary of the estimated<br />
groundwater potential range. The summary of the estimated groundwater resource potential for the<br />
delineated dyke groups are as follows (refer to Figure 6.6):<br />
The groundwater resource potential for Dyke Group A is estimated in the order of between 567 to<br />
1 270 m 3 /d.<br />
The groundwater resource potential for Dyke Group B is estimated in the order of between 1 110 to<br />
1 391 m 3 /d.<br />
The groundwater resource potential for Dyke Group C1 & C2 is estimated in the order of between<br />
1 708 to 2 964 m 3 /d.<br />
The groundwater resource potential for Dyke Group D is estimated in the order of between 765 to<br />
986 m 3 /d.<br />
The groundwater resource potential for Dyke Group E is estimated in the order of between 1 135 to<br />
2 217 m 3 /d.<br />
The groundwater resource potential for Dyke Group F is estimated in the order of between 395 to<br />
544 m 3 /d.<br />
Appendix 4 – Groundwater Potential Study for Small Towns June 2012
Water Reconciliation Strategy Study for the Bulk Water Supply Systems: Greater Bloemfontein Area 93<br />
6.6.1 Cost estimate of developing the proposed borehole fields<br />
The estimated costing for developing the proposed borehole fields only includes the cost for the<br />
geophysical siting, percussion drilling, aquifer test pumping, pump equipment and pump house structure<br />
costs of the proposed borehole fields and do not include the cost of the surface infrastructure such as the<br />
electrical supply lines and pipeline networks and associated reservoirs etc.<br />
The estimated costing for developing the borehole fields are as follows (refer to Table 6.9):<br />
The estimated cost for the development of the borehole field for Dyke Group A is R 3 864 000<br />
The estimated cost for the development of the borehole field for Dyke Group B is R 4 117 000<br />
The estimated cost for the development of the borehole field for Dyke Group C is R 8 771 000<br />
The estimated cost for the development of the borehole field for Dyke Group D is R 2 864 000<br />
The estimated cost for the development of the borehole field for Dyke Group E is R 6 265 000<br />
The estimated cost for the development of the borehole field for Dyke Group F is R 1 611 000<br />
Table 6.9: Estimation of the Borehole Field Development Cost for the Dyke Groups. Note that<br />
the Costing does not make provision for Surface Infrastructure such as Electrical<br />
Supply Lines and Pipeline Networks etc<br />
Dyke Group<br />
Name<br />
Number of<br />
Boreholes to be<br />
Developed<br />
Esti m ate d<br />
Potential<br />
Yield<br />
(m 3 /d)<br />
Estimation of the Borehole Field Development Cost for the Dyke Groups<br />
Geophysical &<br />
Geohydrological<br />
Activity Costs<br />
Cost of Percussion<br />
Drilling of the<br />
Boreholes<br />
Aquifer Test<br />
Pumping Cost of<br />
Boreholes<br />
Pumping<br />
Equ i pm e n t C ost<br />
Pump House<br />
Structure Cost<br />
6.7 DETERMINATION OF HIGH GROUN<strong>DWA</strong>TER ABSTRACTION AREAS<br />
A high groundwater abstraction area hydrocensus was conducted to determine if groundwater is utilised<br />
extensively in a 10 -15 km radius around the community of Edenburg. The hydrocensus was undertaken<br />
by means of aerial photographs. Nine irrigation pivots were identified to the north and north east of<br />
Edenburg (refer to Figure 6.8). The coordinates of the irrigation pivots can be viewed in Table 6.10.<br />
Appendix 4 – Groundwater Potential Study for Small Towns June 2012<br />
Total C ost of<br />
Borehole Field<br />
(Excl. Vat)<br />
Dyke Group A 21 567 - 1 270 R 462 000.00 R 1 050 000.00 R 462 000.00 R 525 000.00 R 1 365 000.00 R 3 864 000.00<br />
Dyke Group B 23 1 110 - 1 391 R 506 000.00 R 1 150 000.00 R 506 000.00 R 460 000.00 R 1 495 000.00 R 4 117 000.00<br />
Dyke Group C 49 1 708 - 2 964 R 1 078 000.00 R 2 450 000.00 R 1 078 000.00 R 980 000.00 R 3 185 000.00 R 8 771 000.00<br />
Dyke Group D 16 765 - 968 R 352 000.00 R 800 000.00 R 352 000.00 R 320 000.00 R 1 040 000.00 R 2 864 000.00<br />
Dyke Group E 35 1 135 - 2 117 R 770 000.00 R 1 750 000.00 R 770 000.00 R 700 000.00 R 2 275 000.00 R 6 265 000.00<br />
Dyke Group F 9 395 - 544 R 198 000.00 R 450 000.00 R 198 000.00 R 180 000.00 R 585 000.00 R 1 611 000.00<br />
Total Cost R 27 492 000.00<br />
* Note that the above costing only includes the geophysical siting, percussion drilling, aquifer test pumping, pump equipment and pump house structure costs of the proposed<br />
borehole fields and do not include the cost of the surface infrastructure such as the electrical supply lines and pipeline networks etc.
Water Reconciliation Strategy Study for the Bulk Water Supply Systems: Greater Bloemfontein Area 94<br />
Table 6.10: Coordinates of the Identified Irrigation Pivots<br />
Coordinates (WGS84)<br />
Pivot Site Name<br />
Eas t S ou th<br />
Pivot A 25.84994 -29.59282<br />
Pivot B 25.85691 -29.59724<br />
Pivot C 25.87338 -29.59809<br />
Pivot D 25.87781 -29.60397<br />
Pivot E 25.86964 -29.60240<br />
Pivot F 25.88190 -29.60658<br />
Pivot G 25.97311 -29.66183<br />
Pivot H 25.97112 -29.67044<br />
Pivot I 25.96603 -29.67324<br />
It is important to note that the irrigation pivots are situated next to the Riet River and other non-perennial<br />
streams (refer to Figure 6.8). Therefore it is more likely that these irrigation pivots utilised surface water<br />
than groundwater. It is recommended that these areas be investigated to confirm the observation.<br />
Groundwater is also utilised by many farmers for domestic purposes at their farmsteads. Groundwater<br />
uses may include, drinking water purposes, washing of clothes and food preparation as well as watering of<br />
the farmstead gardens.<br />
Appendix 4 – Groundwater Potential Study for Small Towns June 2012
Water Reconciliation Strategy Study for the Bulk Water Supply Systems: Greater Bloemfontein Area 95<br />
Figure 6.8: Locality Map of the Potential High Groundwater Abstraction Areas in the Vicinity of Edenburg. Note that the Irrigation Pivots are situated next to the Riet River and other Non-Perennial Streams. Therefore it is<br />
more likely that these Pivots utilised Surface Water than Groundwater. It is recommended that these areas be investigated to confirm the observation<br />
Appendix 4 – Groundwater Potential Study for Small Towns June 2012
Water Reconciliation Strategy Study for the Bulk Water Supply Systems: Greater Bloemfontein Area 96<br />
6.8 CONCLUSIONS AND RECOMMENDATIONS<br />
The following conclusions and recommendations are based on the information supplied in this report:<br />
CATCHMENT<br />
The study area is located in north eastern part of the Free State Province in Water Management Area 13.<br />
The study area is also located in Drainage Area C, Quaternary sub-catchment C51C.<br />
CLIMATE<br />
The investigated area has hot summers and cool winters, and a predominantly summer rainfall. The air<br />
temperatures range from an average maximum of 30 to 32 o C in January to an average minimum of 0 to 2 o C<br />
in July, meaning conditions with hot summers and cold winters (South African Atlas of Agrohydrology and –<br />
Climatology, 1997).<br />
The mean annual rainfall is 440.7 mm/a, which occurs mainly as thunderstorms but soft rains also do occur<br />
(Rainfall Station Gauge No.: 0230 764, Edenburg Police Station, Surface Water Resources of South Africa,<br />
1990).<br />
GEOLOGY<br />
The geology of the Edenburg district consists of the Karoo Super Group geology and more specifically of<br />
the Beaufort Group and Adelaide Subgroup. In general the sedimentary rocks are classified as blue-grey<br />
and purple mudstone interbedded with yellow sandstone and siltstone.<br />
The whole sedimentary sequence has been intruded by dolerite dyke and sill structures. The dolerite dykes<br />
are the primary targets for groundwater resource development.<br />
GENERAL AQUIFER INFORMATION OF THE EDENBURG DISTRICT<br />
The following section is based on the Groundwater Resources of South Africa Maps, <strong>DWA</strong>F, 1995.<br />
The groundwater component of river flow (base flow) is negligible in the Edenburg district. The<br />
groundwater depth in the study area is approximately 10 – 20 mbgl (standard deviation range from mean is<br />
between 8 – 15 m. The mean annual recharge of the area are between 15 - 20 mm/a.<br />
In general the recommended drilling depths are 20 to 30 metres or deeper (50 m) for the study area. The<br />
storage types of the aquifer quantified as fractures restricted principally to a zone below the groundwater<br />
level. Pores in disintegrated / decomposed, partly decomposed rock and fractures which are principally<br />
restricted to a zone directly below the groundwater level. Storage coefficient in order of magnitude for the<br />
study area is 0.001 to 0.01.<br />
GROUN<strong>DWA</strong>TER POTENTIAL INVESTIGATION<br />
This section includes the geophysical information obtained during the survey to detect possible geological<br />
features and structures, which may act as preferential pathways for groundwater flow, which may act as<br />
target areas for groundwater exploration for water supply purposes.<br />
Aerial Photo Interpretation<br />
The aerial photo interpretation of the Edenburg study area revealed 36 potential dolerite dyke structures<br />
that can be verified by means of geophysical methods and percussion drilling. The dolerite dyke structures<br />
are considered the primary targets for groundwater exploration in the Karoo Supergroup geology.<br />
Aerial Magnetic Data Interpretation<br />
The aerial magnetic map revealed numerous dolerite sill intrusions in the study area. The study area is<br />
located on the sedimentary rocks of the Adelaide Subgroup (Beaufort Group) of the Karoo Supergroup.<br />
Appendix 4 – Groundwater Potential Study for Small Towns June 2012
Water Reconciliation Strategy Study for the Bulk Water Supply Systems: Greater Bloemfontein Area 97<br />
The green and blue area on the aerial magnetic contour map denotes sedimentary rocks. Dolerite<br />
intrusives such as dykes and sill structures are denoted as the yellow, red and pinkish / purple areas of the<br />
aerial magnetics map.<br />
The available aerial magnetic data available for the study area are of a low resolution, which brings about<br />
that the smaller dolerite dyke structures occurring within the area cannot be detected due to the spacing of<br />
the flight lines for the aerial magnetic survey. The potential dolerite dykes denoted on the aerial magnetics<br />
map was determined by means of aerial photo interpretations as well as geological maps.<br />
Geological Map Interpretation<br />
The geological map interpretation of the Edenburg study area revealed 36 potential dolerite dyke<br />
structures, which confirms the aerial photo interpretations, which also indicated the potential presence of<br />
these dolerite structures.<br />
RECHARGE WATER BUDGET CALCULATIONS AND ESTIMATED THEORETICAL YIELDS OF<br />
POTENTIAL DOLERITE DYKE STRUCTURES<br />
The following section evaluates the theoretical groundwater resource potential of the identified potential<br />
dolerite dyke structures by means of recharge water budget calculations based on potential minicatchments<br />
of dolerite dyke groups as well as theoretical yields of the structures based on average<br />
sustainable yield calculations by means of aquifer test pumping of borehole fields in the Karoo Super Group<br />
geology.<br />
Note that these resource potential calculations are only rough approximations of the potential sustainable<br />
yield volumes. The only method of determining the sustainable yield volume of a dolerite structure(s) is by<br />
geophysical siting, percussion drilling and aquifer test pumping of the borehole(s). Long-term groundwater<br />
monitoring is also important to observed and understand the aquifer dynamics. After sufficient data is<br />
generated a numerical model flow may be constructed to determine the capture zones of the individual<br />
boreholes as well as the capture zone of the well field as a whole.<br />
Recharge Water Budget Calculations<br />
The estimate recharge volume scenarios are based on a 2% and a 3% recharge percentages of the annual<br />
mean rainfall (440.7 mm/a, Surface Water Resources of South Africa, 1990) as well as recharge<br />
estimations according to the Groundwater Resources of South Africa (<strong>DWA</strong>F, 1995) and the Vegter<br />
Recharge Map (1995).<br />
It must be noted that the recharge volume calculations are only estimates of recharge to the estimated minicatchments<br />
of the dyke groups. The aim of the recharge volume calculations is to estimate the available<br />
recharge volume available to the dyke groups in the study area. The assumption thus made is that the<br />
available recharge volume correlates roughly to the sustainable yield available from the dolerite dyke<br />
groups. This method is only a rough estimation of potential sustainable yields due to that the sustainability<br />
of the intrusive structure is a function of the capture zone, which in turn entails the dynamics of the aquifer<br />
system (The Water budget Myth Revisited; Why Hydrogeologist Model, Bredehoeft, 2002). The main to<br />
tool for investigating the capture zone and aquifer dynamics is the numerical groundwater model.<br />
Unfortunately not enough geohydrological information exists in terms of aquifer parameters to construct<br />
such a model. Therefore only rough estimation can be made regarding the groundwater resource potential.<br />
The results of the groundwater resource potential estimations based on recharge volume scenarios are as<br />
follows:<br />
Estimated groundwater resource potential is estimated for Dyke Group A as approximately 567 m 3 /d.<br />
Estimated groundwater resource potential is estimated for Dyke Group B as approximately 1 110<br />
m 3 /d.<br />
Appendix 4 – Groundwater Potential Study for Small Towns June 2012
Water Reconciliation Strategy Study for the Bulk Water Supply Systems: Greater Bloemfontein Area 98<br />
Estimated groundwater resource potential is estimated for Dyke Groups C1 & C2 as approximately<br />
1 708 m 3 /d.<br />
Estimated groundwater resource potential is estimated for Dyke Group D as approximately 765 m 3 /d.<br />
Estimated groundwater resource potential is estimated for Dyke Group E as approximately 1 135<br />
m 3 /d.<br />
Estimated groundwater resource potential is estimated for Dyke Group F as approximately 395 m 3 /d.<br />
The estimated high growth scenario for the average annual daily water demand for Edenburg was obtained<br />
from Aurecon and is 3 213 m 3 /d or kl/d. The estimated recharge area needed to address the above<br />
demand is approximately 52.12 km 2 .<br />
Estimation of Theoretical Potential Yield of the Dolerite Dyke Structures<br />
The theoretical potential yield or groundwater resource potential estimation of the dolerite dyke structure in<br />
this section is based on the geometric mean of sustainable yield calculations of borehole fields in the Karoo<br />
Super Group geology. The aquifer test data for the geometric mean utilised were taken from the borehole<br />
fields of Petrusburg, Philipstown, Edenville, Colesberg, Igomotseng, Winburg, Brandfort and the Drie<br />
Susters Area.<br />
The groundwater resource potential is calculated by utilising the above mentioned geometric mean of 2.1<br />
L/s per borehole based on 8-hour pump cycle and 16-hour recovery period per day. The length of the<br />
potential structures were taken into account whereby a borehole was spaced on the structure every 250<br />
metres. Therefore the number of the boreholes that can be spaced on the structure multiplied by the<br />
geometric mean (2.1 L/s over 8-hours a day) is equal to the estimated groundwater resource potential of<br />
the dolerite dyke structure.<br />
The assumptions of the method are as follows:<br />
That potential dolerite dykes are water bearing.<br />
An average geometric mean sustainable yield of 2.1 L/s with an 8-hour pump schedule and a 14<br />
recovery period per borehole (Geometric mean average obtained from borehole fields of Petrusburg,<br />
Philipstown, Edenville, Colesberg, Igomotseng, Winburg, Brandfort and the Drie Susters Area).<br />
Spacing of the boreholes every 250 m along the strike of the dolerite dyke structure (note that no<br />
boreholes are placed at the end points of the structures).<br />
The results of the potential yields of the dolerite dyke groups based on the geometric mean of sustainable<br />
yield calculations are as follows:<br />
The groundwater resource potential for Dyke Group A is estimated at 1 270 m 3 /d. The number of<br />
dykes of the dolerite group is 2 with a combined length of 6.28 km upon, which 21 potential<br />
boreholes are spaced for calculation purposes.<br />
The groundwater resource potential for Dyke Group B is estimated at 1 391 m 3 /d. The number of<br />
dykes of the dolerite group is 3 with a combined length of 7.40 km upon, which 23 potential<br />
boreholes are spaced for calculation purposes.<br />
The groundwater resource potential for Dyke Group C1 & C2 is estimated at 2 964 m 3 /d. The<br />
number of dykes of the dolerite group is 10 with a combined length of 15.96 km upon, which 49<br />
potential boreholes are spaced for calculation purposes.<br />
The groundwater resource potential for Dyke Group D is estimated at 968 m 3 /d. The number of<br />
dykes of the dolerite group is 6 with a combined length of 6.29 km upon, which 16 potential<br />
boreholes are spaced for calculation purposes.<br />
The groundwater resource potential for Dyke Group E is estimated at 2 117 m 3 /d. The number of<br />
dykes of the dolerite group is 4 with a combined length of 10.67 km upon, which 35 potential<br />
boreholes are spaced for calculation purposes.<br />
Appendix 4 – Groundwater Potential Study for Small Towns June 2012
Water Reconciliation Strategy Study for the Bulk Water Supply Systems: Greater Bloemfontein Area 99<br />
The groundwater resource potential for Dyke Group F is estimated at 544 m 3 /d. The number of<br />
dykes of the dolerite group is 2 with a combined length of 3.34 km upon, which 9 potential boreholes<br />
are spaced for calculation purposes.<br />
Summary of the Results Groundwater Resource Potential of the Intrusive Dolerite Structures<br />
This section combines the groundwater potential estimation, which includes the recharge based approach<br />
as the lower boundary and the geometric mean approach as the upper boundary of the estimated<br />
groundwater potential range. The summary of the estimated groundwater resource potential for the<br />
delineated dyke groups are as follows:<br />
The groundwater resource potential for Dyke Group A is estimated in the order of between 567 to<br />
1 270 m 3 /d.<br />
The groundwater resource potential for Dyke Group B is estimated in the order of between 1 110 to<br />
1 391 m 3 /d.<br />
The groundwater resource potential for Dyke Group C1 & C2 is estimated in the order of between<br />
1 708 to 2 964 m 3 /d.<br />
The groundwater resource potential for Dyke Group D is estimated in the order of between 765 to<br />
986 m 3 /d.<br />
The groundwater resource potential for Dyke Group E is estimated in the order of between 1 135 to<br />
2 217 m 3 /d.<br />
The groundwater resource potential for Dyke Group F is estimated in the order of between 395 to 544<br />
m 3 /d.<br />
The estimated costing for developing the proposed borehole fields only includes the cost for the<br />
geophysical siting, percussion drilling, aquifer test pumping, pump equipment and pump house structure<br />
costs of the proposed borehole fields and do not include the cost of the surface infrastructure such as the<br />
electrical supply lines and pipeline networks and associated reservoirs etc.<br />
The estimated costing for developing the borehole fields are as follows:<br />
The estimated cost for the development of the borehole field for Dyke Group A is R 3 864 000<br />
The estimated cost for the development of the borehole field for Dyke Group B is R 4 117 000<br />
The estimated cost for the development of the borehole field for Dyke Group C is R 8 771 000<br />
The estimated cost for the development of the borehole field for Dyke Group D is R 2 864 000<br />
The estimated cost for the development of the borehole field for Dyke Group E is R 6 265 000<br />
The estimated cost for the development of the borehole field for Dyke Group F is R 1 611 000<br />
DETERMINATION OF HIGH GROUN<strong>DWA</strong>TER ABSTRACTION AREAS<br />
A high groundwater abstraction area hydrocensus was conducted by GHT Consulting to determine if<br />
groundwater is utilised extensively in a 10 -15 km radius around the community of Edenburg. The<br />
hydrocensus was undertaken by means of aerial photographs. Nine irrigation pivots were identified to the<br />
north and north east of Edenburg.<br />
It is important to note that the irrigation pivots are situated next to the Riet River and other non-perennial<br />
streams. Therefore it is more likely that these irrigation pivots utilised surface water than groundwater. It is<br />
recommended that these areas be investigated to confirm the observation. Groundwater is also utilised by<br />
many farmers for domestic purposes at their farmsteads. Groundwater uses may include, drinking water<br />
purposes, washing of clothes and food preparation as well as watering of the farmstead gardens.<br />
Appendix 4 – Groundwater Potential Study for Small Towns June 2012
Water Reconciliation Strategy Study for the Bulk Water Supply Systems: Greater Bloemfontein Area 100<br />
FINAL CONCLUSIONS AND RECOMMENDATIONS<br />
It is concluded that 36 potential dolerite dykes was observed that can be further investigated. Information<br />
absent regarding the observed dolerite structures are that it is currently unknown if these structures are<br />
water bearing. If so what the true sustainable yields are of these structures, not the estimate yields, as well<br />
as the associated groundwater qualities.<br />
The desktop study indicate that it is viable to further investigate the groundwater resources of Edenburg<br />
based on the numerous potential dolerite dykes observed in the vicinity of Edenburg. It is recommended<br />
that any future orientated groundwater exploration study at least include the following components:<br />
Geophysical siting of groundwater exploration boreholes;<br />
Percussion drilling of the boreholes;<br />
Aquifer test pumping of successfully drilled exploration boreholes according to <strong>DWA</strong> specifications to<br />
determine the sustainable yields of the newly drilled boreholes;<br />
Sampling of all successfully drilled boreholes to determine the groundwater quality of the local site<br />
aquifer;<br />
Aquifer test pumping analyses of data to calculate sustainable yields and pump schedules.<br />
Compilation of a Geohydrological <strong>Report</strong>.<br />
Appendix 4 – Groundwater Potential Study for Small Towns June 2012
Water Reconciliation Strategy Study for the Bulk Water Supply Systems: Greater Bloemfontein Area 101<br />
7. REFERENCES<br />
BREDEHOEFT, JD (2002) The Water Budget Myth Revisited: Why Hydrogeologist Model, Vol. 40, No. 4 –<br />
Groundwater – July – August 2002 on pages 340 – 345.<br />
MIDGLEY DC, PITMAN WV & MIDDLETON BJ (1994) Surface Water Resources of South Africa, Volume II<br />
Appendices, WRC <strong>Report</strong> No. 298/2.1/94 and the Department of Water Affairs and Forestry (<strong>DWA</strong>F).<br />
MIDGLEY DC, PITMAN WV & MIDDLETON BJ (1994) Surface Water Resources of South Africa, Volume II<br />
Book of Maps, WRC <strong>Report</strong> No. 298/2.2/94 and the Department of Water Affairs and Forestry (<strong>DWA</strong>F).<br />
ROUX AT, Geophysical Field Manual for Technicians, No. 1, The Magnetic Method, South African<br />
Geophysical Association.<br />
SCHULZE RE, MAHARAJ M, LYNCH SD, HOWE BJ & MELVIN-THOMSON B (1997) South African Atlas<br />
of Agrohydrology and –Climatology. WRC <strong>Report</strong> No. TT82/96.<br />
WOODFORD AC & CHEVALLIER (Editors) (2002) Hydrology of the Main Karoo Basin: Current Knowledge<br />
and Future Research Needs. WRC <strong>Report</strong> No. TT179/02.<br />
Appendix 4 – Groundwater Potential Study for Small Towns June 2012