Visualization for Improved Situational Awareness - Mitre
Visualization for Improved Situational Awareness - Mitre
Visualization for Improved Situational Awareness - Mitre

You also want an ePaper? Increase the reach of your titles
YUMPU automatically turns print PDFs into web optimized ePapers that Google loves.
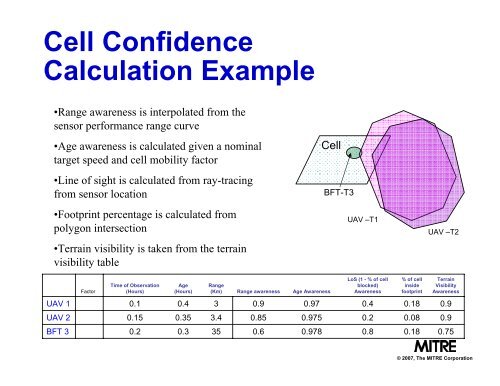
Cell Confidence<br />
Calculation Example<br />
•Range awareness is interpolated from the<br />
sensor per<strong>for</strong>mance range curve<br />
•Age awareness is calculated given a nominal<br />
target speed and cell mobility factor<br />
•Line of sight is calculated from ray-tracing<br />
from sensor location<br />
•Footprint percentage is calculated from<br />
polygon intersection<br />
•Terrain visibility is taken from the terrain<br />
visibility table<br />
UAV 1<br />
UAV 2<br />
BFT 3<br />
Factor<br />
Time of Observation<br />
(Hours)<br />
0.1<br />
0.15<br />
0.2<br />
Age<br />
(Hours)<br />
0.4<br />
0.35<br />
0.3<br />
Range<br />
(Km)<br />
3<br />
3.4<br />
35<br />
Range awareness<br />
0.9<br />
0.85<br />
0.6<br />
Age <strong>Awareness</strong><br />
0.97<br />
0.975<br />
0.978<br />
Cell<br />
BFT-T3<br />
UAV –T1<br />
LoS (1 - % of cell<br />
blocked)<br />
<strong>Awareness</strong><br />
0.4<br />
0.2<br />
0.8<br />
% of cell<br />
inside<br />
footprint<br />
0.18<br />
0.08<br />
0.18<br />
UAV –T2<br />
Terrain<br />
Visibility<br />
<strong>Awareness</strong><br />
0.9<br />
0.9<br />
0.75<br />
© 2007, The MITRE Corporation