PDF of presentation - Acino
PDF of presentation - Acino
PDF of presentation - Acino

Create successful ePaper yourself
Turn your PDF publications into a flip-book with our unique Google optimized e-Paper software.
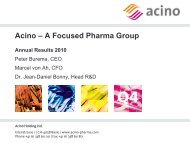
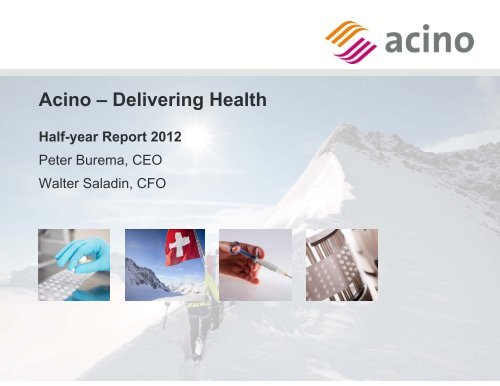
<strong>Acino</strong> – Delivering Health<br />
Half-year Report 2012<br />
Peter Burema, CEO<br />
Walter Saladin, CFO<br />
<strong>Acino</strong> Holding Ltd.<br />
Erlenstrasse 1 | CH-4058 Basle | www.acino-pharma.com<br />
Phone +41 61 338 60 00 | Fax +41 61 338 60 80
Performance H1-2012<br />
Basle, August 2, 2012<br />
Walter Saladin, CFO <strong>Acino</strong> Group<br />
<strong>Acino</strong> Holding Ltd.<br />
Erlenstrasse 1 | CH-4058 Basle | www.acino-pharma.com<br />
Phone +41 61 338 60 00 | Fax +41 61 338 60 80
H1-2012 key financials<br />
(in EUR million) H1-2012 H1-2011 Change<br />
Revenue 128.9 65.2 98%<br />
EBITDA<br />
% <strong>of</strong> revenue<br />
EBITDA comparable (1)<br />
% <strong>of</strong> revenue<br />
EBIT<br />
% <strong>of</strong> revenue<br />
EBIT comparable (1)<br />
% <strong>of</strong> revenue<br />
Net pr<strong>of</strong>it<br />
EPS (diluted)<br />
Net pr<strong>of</strong>it comparable (1)<br />
EPS (diluted)<br />
Cash flow from operations<br />
% <strong>of</strong> revenue<br />
16.8<br />
13.0%<br />
23.4<br />
18.2%<br />
3.4<br />
2.6%<br />
10.0<br />
7.8%<br />
3.1<br />
0.90<br />
9.4<br />
2.79<br />
(1.6)<br />
(1.3%)<br />
11.7<br />
18.0%<br />
11.7<br />
18.0%<br />
2.8<br />
4.3%<br />
2.8<br />
4.3%<br />
2.4<br />
0.76<br />
2.4<br />
0.76<br />
5.3<br />
8.2%<br />
Equity ratio in % as <strong>of</strong> June 30 54% 78%<br />
(1) Without acquisition related one time items<br />
43%<br />
99%<br />
20%<br />
257%<br />
27%<br />
293%<br />
-70%<br />
3
H1-2012 operating performance<br />
Net sales<br />
Cost <strong>of</strong> goods / Change in inventory<br />
Employee benefits<br />
Other Opex<br />
EBITDA<br />
Depreciation and Amortization<br />
EBIT<br />
Net financial result / Income Taxes<br />
Net pr<strong>of</strong>it<br />
(in EUR million)<br />
3.4<br />
2.8<br />
0.5<br />
0.9<br />
3.1<br />
2.4<br />
13 . 3<br />
16 . 8<br />
11. 7<br />
13 . 4<br />
7.8<br />
23.2<br />
20.3<br />
30.1<br />
35.5<br />
51.9<br />
65,2<br />
13.0% <strong>of</strong> sales<br />
18.0% <strong>of</strong> sales<br />
2.6% <strong>of</strong> sales<br />
4.3% <strong>of</strong> sales<br />
128.9<br />
0 20 40 60 80 100 120 140<br />
H1-2011 H1-2012<br />
+ 98%<br />
+ 123%<br />
+ 44%<br />
+ 20%<br />
+27%<br />
4
H1-2012 comparable operating<br />
performance (1)<br />
Net sales<br />
Cost <strong>of</strong> goods / Change in inventory<br />
Employee benefits<br />
Other Opex<br />
EBITDA<br />
Depreciation and Amortization<br />
EBIT<br />
Net financial result / Income Taxes<br />
Net pr<strong>of</strong>it<br />
(1) Without acquisition related one-time items<br />
(in EUR million)<br />
10 . 0<br />
2.8<br />
0.6<br />
0.9<br />
11. 7<br />
13 . 4<br />
7.8<br />
9.4<br />
2.4<br />
13 . 3<br />
23.2<br />
20.3<br />
23.4<br />
29.2<br />
35.5<br />
44.0<br />
18.2% <strong>of</strong> sales<br />
18.0% <strong>of</strong> sales<br />
3.7% <strong>of</strong> sales<br />
65.2<br />
12 8 . 9<br />
0 20 40 60 80 100 120 140<br />
H1-2011 H1-2012<br />
+ 98%<br />
+ 90%<br />
+ 99%<br />
7.8% <strong>of</strong> sales + 257%<br />
7.3% <strong>of</strong> sales<br />
+ 293%<br />
5
H1-2012 EBITDA<br />
acquisition related one-time items<br />
EUR<br />
million<br />
25<br />
23<br />
21<br />
19<br />
17<br />
15<br />
13<br />
11<br />
9<br />
7<br />
5<br />
3<br />
1<br />
‐1<br />
‐3<br />
‐5<br />
Actual<br />
EBITDA<br />
16.8<br />
13.0% <strong>of</strong> sales<br />
Set-<strong>of</strong>f <strong>of</strong> step-up<br />
inventory<br />
8.0<br />
Purchase bargain /<br />
negative good will<br />
(2.2)<br />
One-<strong>of</strong>f cost<br />
acquisition<br />
0.9<br />
Comparable<br />
EBITDA<br />
23.4<br />
18.2% <strong>of</strong> sales<br />
6
H1-2012 Net pr<strong>of</strong>it<br />
acquisition related one-time items<br />
EUR<br />
million<br />
11<br />
9<br />
7<br />
5<br />
3<br />
1<br />
‐1<br />
Actual<br />
net pr<strong>of</strong>it<br />
3.0<br />
EPS diluted<br />
0.90<br />
One time items<br />
above EBIT<br />
6.7<br />
One-<strong>of</strong>f cost financing<br />
(syndicate loan and<br />
capital increase)<br />
1.4<br />
Comparable tax<br />
effect on one<br />
time items<br />
(1.7)<br />
Comparable<br />
net pr<strong>of</strong>it<br />
9.4<br />
EPS diluted<br />
2.76<br />
7
H1-2012 cash flow<br />
(EUR million) H1-2012 H1-2011<br />
Cash flow 17.7 (2.4)<br />
Changes in working capital (19.3) 7.8<br />
Cash flow from operations (1.6) 5.3<br />
Cash flow from investing<br />
� PPE<br />
� Intangible assets<br />
� Acquisition<br />
� Associated companies<br />
Cash flow from financing<br />
� Proceeds from syndicate loan<br />
� Capital increase<br />
� Repayment short term borrowing<br />
� Other<br />
(5.8)<br />
(5.4)<br />
(80.0)<br />
(1.0)<br />
100.0<br />
20.3<br />
(13.0)<br />
(2.9)<br />
(92.4)<br />
104.5<br />
(8.9)<br />
(4.9)<br />
(13.7)<br />
(6.4)<br />
Net change in cash 10.5 (14.8)<br />
Free cash flow (13.0) (8.4)<br />
(6.4)<br />
8
Balance sheet<br />
EUR<br />
million<br />
30.6.2012<br />
EUR 515.3 million +56%<br />
14,9<br />
144,6<br />
24,5<br />
103,6<br />
71,0<br />
20,0<br />
26,9<br />
74,3<br />
114,6<br />
279,5<br />
H1-2012<br />
ASSETS<br />
• Ongoing high investments Miesbach<br />
• PPA acquisition (PPE, intangible<br />
assets, working capital)<br />
• Goodwill unchanged due to favorable<br />
acquisition terms<br />
LIABILITIES AND SHAREHOLDERS’<br />
EQUITY<br />
• New Syndication loan<br />
• Higher other liabilities and deferred<br />
taxes<br />
EQUITY RATIO<br />
• Reduced due to acquisition but still<br />
high 54 %<br />
156,7<br />
Assets Liabilities &<br />
Shareholders‘<br />
equity<br />
Deferred revenues<br />
Deferred tax liabilities<br />
Other liabilities<br />
Financial liabilities<br />
Shareholders’ equity<br />
Cash and cash equivalents<br />
Working capital<br />
Other non-current assets<br />
Other intangible assets<br />
Goodwill<br />
Property, plant & equipment<br />
102,5<br />
Assets<br />
31.12.2011<br />
EUR 330.4 million<br />
4,4<br />
53,8<br />
18,8<br />
79,9<br />
71,0<br />
20,5<br />
13,3<br />
26,2<br />
13,0<br />
257,4<br />
Liabilities &<br />
Shareholders‘<br />
equity<br />
9
New segment reporting according to<br />
3 Pillar Strategy<br />
BtC<br />
BtB<br />
Brand marketing <strong>Acino</strong> Switzerland<br />
Currently 80 countries in Middle East,<br />
Africa, LATAM, Asia<br />
Currently 46 products available<br />
Brand approach: High Swiss/EU quality<br />
Brand transfer from Mepha to <strong>Acino</strong><br />
Switzerland within 2 years from acquisition<br />
Main countries: Saudi Arabia, Iraq, UAE,<br />
French West Africa, Ecuador<br />
<strong>Acino</strong> own developments, <strong>Acino</strong> owns IP<br />
Outlicensing to leading pharmaceutical<br />
companies<br />
Niche products / technologically complex<br />
formulations<br />
Main products: oxycodone, metoprolol,<br />
doxazosin, alfuzosin, clopidogrel,<br />
buprenorphine<br />
Main customers: Teva, Stada, Novartis,<br />
Mylan, Dr. Reddy’s<br />
Technology Marketing<br />
Based on <strong>Acino</strong>’s strong and leading<br />
technology platforms<br />
Partnerships /co-developments with leading<br />
pharmaceutical companies<br />
- Drug delivery solutions for new NCE’s<br />
- Life cycle management<br />
Contract manufacturing / customer usually<br />
owns Product related IP<br />
Low margin Teva supply for CH / EU following<br />
acquisition <strong>of</strong> Mepha site in Aesch<br />
Main customers: Teva, Stada, in future Bayer<br />
Discontinuation <strong>of</strong> betalactame production as<br />
per end 2013<br />
Production<br />
Items not directly attributable to other<br />
segments<br />
Deviations from standard costs in<br />
production<br />
10
Segment BtC<br />
Net Sales<br />
Gross Margin<br />
in EUR million<br />
0.3<br />
-0.6<br />
9.3<br />
19.1% <strong>of</strong> sales<br />
-10 0 10 20 30 40 50<br />
Acquisition related sales (4.5 months): EUR 48.2 million<br />
Middle East region accounts for 61% <strong>of</strong> segment sales<br />
Strong sales in Middle East and LATAM<br />
Gross margin includes all selling expenses; negatively impacted by<br />
integration efforts<br />
Seasonal effect in MENA (lower sales in summer / Ramadan)<br />
n.a.<br />
H1-2011 H1-2012<br />
Margin increase expected from H2-2012 onwards<br />
48.9<br />
11
Segment BtB<br />
Net Sales<br />
Gross Margin<br />
in EUR million<br />
18.0<br />
15.8<br />
Strong sales <strong>of</strong> oxycodone (+ 28%), metropolol (+ 44%), hydromorphone<br />
(+127%), fentanyl (+1130%), buprenorphin (+39%)<br />
Weaker sales <strong>of</strong> alfuzosin (-23%), clopidogrel (-21%), itraconazole (-5%)<br />
Despite price pressure, managed to keep margin at last year’s level<br />
No major acquisition related impacts<br />
37.6% <strong>of</strong> sales<br />
37.7% <strong>of</strong> sales<br />
Top 5 customers account for 79% <strong>of</strong> segment sales<br />
Top 5 products account for 65% <strong>of</strong> segment sales<br />
41.9<br />
0 10 20 30 40 50<br />
H1-2011 H1-2012<br />
48.0<br />
+ 18%<br />
+ 22%<br />
12
Segment Technology Marketing<br />
Net Sales<br />
Gross Margin<br />
in EUR million<br />
6.7<br />
8.5<br />
21.8% <strong>of</strong> sales<br />
38.8% <strong>of</strong> sales<br />
Includes fentanyl contract manufacturing part (not own developments)<br />
Production for Teva/Mepha out <strong>of</strong> Aesch:<br />
� low margin, supports capacity utilization and overhead recovery<br />
� expected to decrease over the next years and to be replaced by<br />
higher margin products<br />
Gross margin further impacted by continued price pressure<br />
Top 5 customers account for 65% <strong>of</strong> net sales<br />
22.0<br />
30.8<br />
0 5 10 15 20 25 30 35<br />
H1-2011 H1-2012<br />
+ 40%<br />
- 21%<br />
13
Syndication financing terms<br />
Facility:<br />
- EUR 110 million<br />
Maturity:<br />
- 5 years<br />
- amortizing min. EUR 10 million p.a. starting 2013, remaining amount in 2017<br />
Interest rate<br />
- EURIBOR + margin dependent to net debt / EBITDA ratio<br />
- All in cost : currently below 3% p.a.<br />
Employed per June 30, 2012: EUR 100 million<br />
Financial Summary: (in EUR millions) 2012 2013 2014<br />
P&L charge (est.) 2.5 (*) 2.9 2.6<br />
EPS impact (EUR) 0.74 0.85 0.77<br />
(*) without one time charges<br />
14
Integration Process<br />
Basle, August 2, 2012<br />
Peter Burema, CEO <strong>Acino</strong> Group<br />
<strong>Acino</strong> Holding Ltd.<br />
Erlenstrasse 1 | CH-4058 Basle | www.acino-pharma.com<br />
Phone +41 61 338 60 00 | Fax +41 61 338 60 80
Launching <strong>Acino</strong> Switzerland<br />
portfolio products<br />
Through the Mepha/Cephalon acquisition access to new markets in MENA, Africa,<br />
Latin America & Asia is facilitated for <strong>Acino</strong> Switzerland’s own portfolio<br />
First product launches in Q3/2012 - Q2/2013<br />
Product launches:<br />
� Launches <strong>of</strong> Clopacin (clopidogrel), Gosacin 3.6 (goserelin implant), Fentavera (fentanyl<br />
patch), Metracin (metoprolol succinate), Fuzocim (alfuzosine) and others are scheduled in<br />
several MENA & African markets<br />
� First Asian launch <strong>of</strong> Clopacin in H2 2012<br />
� Latin America filings are under way<br />
In addition a high number <strong>of</strong> product submissions in B2C markets<br />
� 38 already approved, additional 66 in registration<br />
Marketing and Sales Teams operate under the <strong>Acino</strong> Switzerland label<br />
Successful new & re-market entries<br />
16
Transitional Brand<br />
Communication Strategy<br />
17
Example: Clopacin ®<br />
Clopacin ® (clopidogrel besylate):<br />
“Swiss quality standard; the protection<br />
you trust.”<br />
First <strong>Acino</strong> Switzerland global<br />
brand product to be introduced in<br />
several MENA, African & Asian<br />
markets in 2012/13<br />
18
<strong>Acino</strong>’s growth drivers<br />
BtC BtB Technology Marketing<br />
Growth through acquisitions: targeted M&A activities<br />
Inlicensing products<br />
e.g. Iron sucrose, Zoledronic Acid<br />
I.V., Paracetamol I.V.,<br />
Panoprazole I.V.<br />
Enter into new BtC<br />
countries<br />
Strong development pipeline, tailored to both<br />
BtC and BtB markets<br />
Roll out <strong>of</strong> “established<br />
<strong>Acino</strong> products” in 60<br />
new markets<br />
Organic growth: high investments, exploit synergies & untapped potential<br />
Growth <strong>of</strong> population<br />
and GIP’s in emerging<br />
markets<br />
Broadening customer<br />
base, new markets<br />
New customer<br />
acquisition based on<br />
technological strengths<br />
(pellets, microtablets,<br />
patches, implants)<br />
Bayer project,<br />
several other projects<br />
under way<br />
19
Geographic break-down <strong>of</strong> revenue<br />
Main countries 2010<br />
Main countries H1-2012<br />
(Product sales in end user markets, <strong>Acino</strong> actuals) (Product sales in end user markets, <strong>Acino</strong> actuals)<br />
20
The “new” <strong>Acino</strong>: broad customer base<br />
and activities in >130 countries<br />
21
Integration <strong>of</strong> technical operations<br />
Global Technical Operations organization in place<br />
Warehouse consolidation in Aesch as per January 2013<br />
Postponement <strong>of</strong> investments utilizing CH manufacturing sites/capabilities<br />
Factory work shift harmonization in CH<br />
Engineering: Rollout <strong>of</strong> internal engineering and reduction <strong>of</strong> external<br />
services<br />
Packaging: consolidation <strong>of</strong> departments and standardization <strong>of</strong> pack<br />
design<br />
Optimization <strong>of</strong> structures and processes like quality control and centralized<br />
purchasing<br />
Roll-out <strong>of</strong> MES Systems (increase <strong>of</strong> automation level)<br />
22
Expanded technological capabilities<br />
Orals, modified<br />
release<br />
Liesberg √ √ √ √<br />
Aesch √ √ √ √<br />
MUPS / Pellets<br />
Miesbach √ √ √<br />
Combined √ √ √ √ √ √ √<br />
Oral dipersibles<br />
Microtablets<br />
Stickpacks<br />
Transdermals<br />
Implants<br />
23
R&D highlights 2012<br />
Development for oral and TDS development projects well on track:<br />
– Successful completion <strong>of</strong> rivastigmine TDS development (generic to Exelon ® )<br />
filings in EU, US & CH being the first ANDA submission <strong>of</strong> an <strong>Acino</strong> product in US<br />
– Filing <strong>of</strong> oxycodone matrix planned in EU in Q3; well on track to support switch <strong>of</strong><br />
customers from pellet formulation to matrix tablet<br />
– Development <strong>of</strong> goserelin in Japan progressing very well<br />
Major milestones achieved in the development <strong>of</strong> unique products with own<br />
IP and specific USPs with huge potential in EU & US:<br />
� Low-loaded fentanyl patch with attractive small patch size<br />
� Weekly pain patch with constant release over 7 days<br />
� Innovative 7-day patch as Life Cycle Management for a major CNS indication<br />
Pipeline further streamlined to also fulfill B2C needs and new projects from<br />
former Mepha added or in evaluation<br />
24
R&D highlights 2012<br />
Technology base and expertise for special formulations and drug delivery<br />
systems further broadened (microtablets)<br />
Further strengthening implant platform and start <strong>of</strong> additional clinical studies<br />
as requested by authorities.<br />
Confident to bring the first generic Goserelin implant to the market.<br />
Conclusions:<br />
– <strong>Acino</strong>’s large pipeline is well balanced by indication, development stage<br />
and technology platform to serve the B2B as well as B2C business<br />
– More products for US filing to follow in near future and further product<br />
developments for Japan in discussion<br />
– Submissions in B2C continuing to expand portfolio to further markets<br />
25
<strong>Acino</strong>‘s development pipeline<br />
Estimated approval dates<br />
26
Promising potential areas <strong>of</strong><br />
synergies through integration<br />
2013 2014<br />
Basle HQ and R&D activities will be moved to Aesch by end 2012<br />
Mepha main warehouse activities transferred to <strong>Acino</strong> premises by<br />
January 2013<br />
Combined technical operations structures<br />
New R&D structure (including regulatory) established<br />
Engineering (rollout internal engineering, reduction<br />
external services)<br />
Finance, HR and IT systems<br />
Cont.<br />
Potential synergies<br />
p.a. in EUR million<br />
Synchronisation <strong>of</strong> market intelligence 0.5<br />
1.0<br />
0.8<br />
2.6<br />
1.0<br />
0.6<br />
3.5<br />
Total 10.0<br />
27
Update Guidance<br />
2012 full year<br />
� Sales: Upper level <strong>of</strong> guidance at EUR 260 million<br />
� Comparable EBITDA: Slight increase over H1-2012<br />
Continued strong sales growth 2013 onwards<br />
Confirming 25% EBITDA margin 2014 onwards<br />
Assuming SNB continues to successfully support the EUR at CHF 1.20<br />
28
Key Facts: <strong>Acino</strong> TODAY<br />
Fourth largest listed Swiss pharmaceutical company<br />
(<strong>Acino</strong> Holding Ltd., domiciled in Basle, listed at the SIX Swiss Exchange: ACIN)<br />
7 sites worldwide: 4x Switzerland (Basle, 2x Aesch, Liesberg), 1x Miesbach<br />
(DE), 1x Paris (FR), 1x Panama (LATAM)<br />
About 850 employees from over 40 nations<br />
46 products for own brand marketing in various international territories<br />
Marketing partnerships in over 130 countries<br />
– Own brand marketing in over 80 countries (~380 marketing & sales staff)<br />
– B2B/Outlicensing in more than 50 additional countries<br />
29
<strong>Acino</strong> – Delivering Health<br />
Thank you for<br />
your attention<br />
30