Table C-15: Distribution of General Households by ... - Bbs.gov.bd
Table C-15: Distribution of General Households by ... - Bbs.gov.bd
Table C-15: Distribution of General Households by ... - Bbs.gov.bd

Create successful ePaper yourself
Turn your PDF publications into a flip-book with our unique Google optimized e-Paper software.
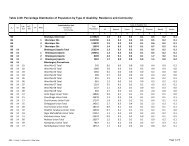
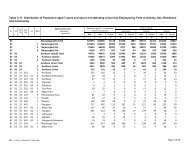
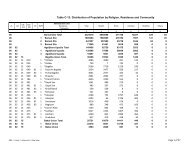
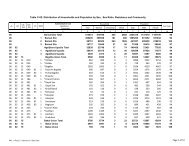
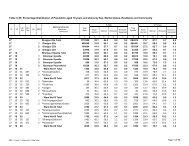
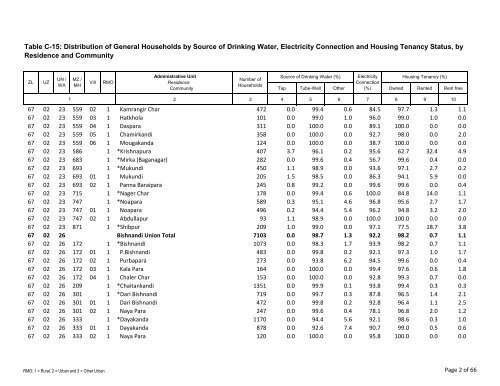
<strong>Table</strong> C-<strong>15</strong>: <strong>Distribution</strong> <strong>of</strong> <strong>General</strong> <strong>Households</strong> <strong>by</strong> Source <strong>of</strong> Drinking Water, Electricity Connection and Housing Tenancy Status, <strong>by</strong><br />
Residence and Community<br />
ZL UZ<br />
UN /<br />
WA<br />
1<br />
MZ /<br />
MH<br />
Vill RMO<br />
Administrative Unit<br />
Residence<br />
Community<br />
Number <strong>of</strong><br />
<strong>Households</strong><br />
Source <strong>of</strong> Drinking Water (%) Electricity<br />
Connection<br />
Housing Tenancy (%)<br />
Tap Tube-Well Other (%) Owned Rented Rent free<br />
2 3 4 5 6 7 8 9 10<br />
67 02 23 559 02 1 Kamrangir Char 472 0.0 99.4 0.6 84.5 97.7 1.3 1.1<br />
67 02 23 559 03 1 Hatkhola 101 0.0 99.0 1.0 96.0 99.0 1.0 0.0<br />
67 02 23 559 04 1 Daspara 311 0.0 100.0 0.0 89.1 100.0 0.0 0.0<br />
67 02 23 559 05 1 Chamirkandi 358 0.0 100.0 0.0 92.7 98.0 0.0 2.0<br />
67 02 23 559 06 1 Mougakanda 124 0.0 100.0 0.0 38.7 100.0 0.0 0.0<br />
67 02 23 586 1 *Krishnapura 407 3.7 96.1 0.2 95.6 62.7 32.4 4.9<br />
67 02 23 683 1 *Mirka (Baganagar) 282 0.0 99.6 0.4 56.7 99.6 0.4 0.0<br />
67 02 23 693 1 *Mukundi 450 1.1 98.9 0.0 93.6 97.1 2.7 0.2<br />
67 02 23 693 01 1 Mukundi 205 1.5 98.5 0.0 86.3 94.1 5.9 0.0<br />
67 02 23 693 02 1 Panna Baraipara 245 0.8 99.2 0.0 99.6 99.6 0.0 0.4<br />
67 02 23 7<strong>15</strong> 1 *Nager Char 178 0.0 99.4 0.6 100.0 84.8 14.0 1.1<br />
67 02 23 747 1 *Noapara 589 0.3 95.1 4.6 96.8 95.6 2.7 1.7<br />
67 02 23 747 01 1 Noapara 496 0.2 94.4 5.4 96.2 94.8 3.2 2.0<br />
67 02 23 747 02 1 A<strong>bd</strong>ullapur 93 1.1 98.9 0.0 100.0 100.0 0.0 0.0<br />
67 02 23 871 1 *Shibpur 209 1.0 99.0 0.0 97.1 77.5 18.7 3.8<br />
67 02 26 Bishnandi Union Total 7103 0.0 98.7 1.3 92.2 98.2 0.7 1.1<br />
67 02 26 172 1 *Bishnandi 1073 0.0 98.3 1.7 93.9 98.2 0.7 1.1<br />
67 02 26 172 01 1 P.Bishnandi 483 0.0 99.8 0.2 92.1 97.3 1.0 1.7<br />
67 02 26 172 02 1 Purbapara 273 0.0 93.8 6.2 94.5 99.6 0.0 0.4<br />
67 02 26 172 03 1 Kala Para 164 0.0 100.0 0.0 99.4 97.6 0.6 1.8<br />
67 02 26 172 04 1 Chaler Char <strong>15</strong>3 0.0 100.0 0.0 92.8 99.3 0.7 0.0<br />
67 02 26 209 1 *Chaitankandi 1351 0.0 99.9 0.1 93.8 99.4 0.3 0.3<br />
67 02 26 301 1 *Dari Bishnandi 719 0.0 99.7 0.3 87.8 96.5 1.4 2.1<br />
67 02 26 301 01 1 Dari Bishnandi 472 0.0 99.8 0.2 92.8 96.4 1.1 2.5<br />
67 02 26 301 02 1 Naya Para 247 0.0 99.6 0.4 78.1 96.8 2.0 1.2<br />
67 02 26 333 1 *Dayakanda 1170 0.0 94.4 5.6 92.1 98.6 0.3 1.0<br />
67 02 26 333 01 1 Dayakanda 878 0.0 92.6 7.4 90.7 99.0 0.5 0.6<br />
67 02 26 333 02 1 Naya Para 120 0.0 100.0 0.0 95.8 100.0 0.0 0.0<br />
RMO: 1 = Rural, 2 = Urban and 3 = Other Urban<br />
Page 2 <strong>of</strong> 66