1999 Annual Report - Altium
1999 Annual Report - Altium
1999 Annual Report - Altium

You also want an ePaper? Increase the reach of your titles
YUMPU automatically turns print PDFs into web optimized ePapers that Google loves.
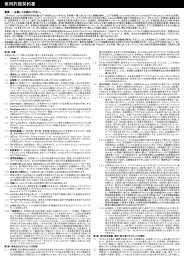
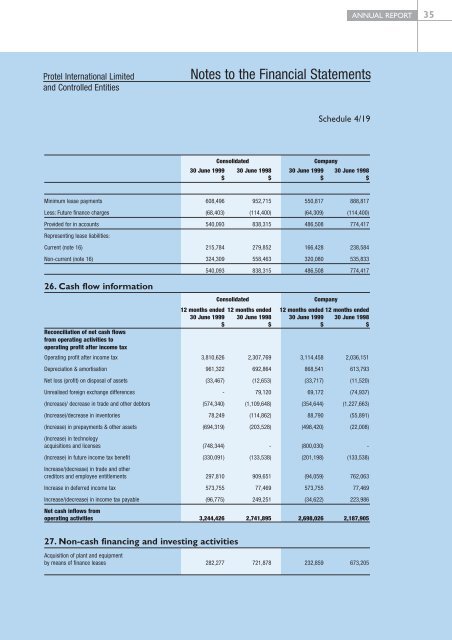
Protel International Limited<br />
and Controlled Entities<br />
Notes to the Financial Statements<br />
Schedule 4/19<br />
Consolidated Company<br />
30 June <strong>1999</strong> 30 June 1998 30 June <strong>1999</strong> 30 June 1998<br />
$ $ $ $<br />
Minimum lease payments 608,496 952,715 550,817 888,817<br />
Less: Future finance charges (68,403) (114,400) (64,309) (114,400)<br />
Provided for in accounts<br />
Representing lease liabilities:<br />
540,093 838,315 486,508 774,417<br />
Current (note 16) 215,784 279,852 166,428 238,584<br />
Non-current (note 16) 324,309 558,463 320,080 535,833<br />
540,093 838,315 486,508 774,417<br />
26. Cash flow information<br />
Consolidated Company<br />
12 months ended 12 months ended 12 months ended 12 months ended<br />
30 June <strong>1999</strong> 30 June 1998 30 June <strong>1999</strong> 30 June 1998<br />
$ $ $ $<br />
Reconciliation of net cash flows<br />
from operating activities to<br />
operating profit after income tax<br />
Operating profit after income tax 3,810,626 2,307,769 3,114,458 2,036,151<br />
Depreciation & amortisation 961,322 692,864 868,541 613,793<br />
Net loss (profit) on disposal of assets (33,467) (12,653) (33,717) (11,520)<br />
Unrealised foreign exchange differences - 79,120 69,172 (74,937)<br />
(Increase)/ decrease in trade and other debtors (574,340) (1,109,648) (354,644) (1,227,663)<br />
(Increase)/decrease in inventories 78,249 (114,862) 88,790 (55,891)<br />
(Increase) in prepayments & other assets<br />
(Increase) in technology<br />
(694,319) (203,528) (498,420) (22,008)<br />
acquisitions and licenses (748,344) - (800,030) -<br />
(Increase) in future income tax benefit<br />
Increase/(decrease) in trade and other<br />
(330,091) (133,538) (201,198) (133,538)<br />
creditors and employee entitlements 297,810 909,651 (94,059) 762,063<br />
Increase in deferred income tax 573,755 77,469 573,755 77,469<br />
Increase/(decrease) in income tax payable<br />
Net cash inflows from<br />
(96,775) 249,251 (34,622) 223,986<br />
operating activities 3,244,426 2,741,895 2,698,026 2,187,905<br />
27. Non-cash financing and investing activities<br />
Acquisition of plant and equipment<br />
by means of finance leases 282,277 721,878 232,859 673,205<br />
ANNUAL REPORT 35