- Page 1 and 2:
Statistics Without Maths for Psycho
- Page 3 and 4:
British Psychological Society stand
- Page 5 and 6:
Pearson Education Limited Edinburgh
- Page 8:
Brief contents Preface xvii Acknowl
- Page 11 and 12:
x Contents 3.3 Sampling error 48 SP
- Page 13 and 14:
xii Contents 8.3 Power 248 8.4 Fact
- Page 15 and 16:
xiv Contents 14 Introduction to fac
- Page 17 and 18:
Supporting resources Visit www.pear
- Page 19 and 20:
xviii Preface Although we have upda
- Page 21 and 22:
xx Preface of each chapter there is
- Page 23 and 24:
xxii Acknowledgements inferences, J
- Page 25 and 26:
Guided tour of the book and website
- Page 27 and 28:
xxvi Guided tour of the book and we
- Page 30 and 31:
CHAPTER OVERVIEW CHAPTER 1 Variable
- Page 32 and 33:
CHAPTER 1 Variables and research de
- Page 34 and 35:
Discussion point Dichotomising cont
- Page 36 and 37:
1.3 Levels of measurement CHAPTER 1
- Page 38 and 39:
CHAPTER 1 Variables and research de
- Page 40 and 41:
Definition CHAPTER 1 Variables and
- Page 42 and 43:
Definition CHAPTER 1 Variables and
- Page 44 and 45:
Definition CHAPTER 1 Variables and
- Page 46 and 47:
Definition CHAPTER 1 Variables and
- Page 48 and 49:
Definition Activity 1.3 1.5.2 Betwe
- Page 50 and 51:
CHAPTER 1 Variables and research de
- Page 52 and 53:
CHAPTER 1 Variables and research de
- Page 54 and 55:
CHAPTER OVERVIEW CHAPTER 2 Introduc
- Page 56 and 57:
CHAPTER 2 Introduction to SPSS 27 Y
- Page 58 and 59:
CHAPTER 2 Introduction to SPSS 29 I
- Page 60 and 61:
CHAPTER 2 Introduction to SPSS 31 O
- Page 62 and 63:
CHAPTER 2 Introduction to SPSS 33 Y
- Page 64 and 65:
CHAPTER 2 Introduction to SPSS 35 2
- Page 66 and 67:
CHAPTER 2 Introduction to SPSS 37 C
- Page 68 and 69:
2.7 Within-participants designs CHA
- Page 70 and 71:
CHAPTER OVERVIEW CHAPTER 3 Descript
- Page 72 and 73:
Definitions CHAPTER 3 Descriptive s
- Page 74 and 75:
Definition CHAPTER 3 Descriptive st
- Page 76 and 77:
CHAPTER 3 Descriptive statistics 47
- Page 78 and 79:
Activity 3.4 CHAPTER 3 Descriptive
- Page 80 and 81:
Definition CHAPTER 3 Descriptive st
- Page 82 and 83:
CHAPTER 3 Descriptive statistics 53
- Page 84 and 85:
3.4 Graphically describing data Def
- Page 86 and 87:
Figure 3.3 Histogram of the depress
- Page 88 and 89:
Figure 3.5 Example of a stem and le
- Page 90 and 91:
CHAPTER 3 Descriptive statistics 61
- Page 92 and 93:
CHAPTER 3 Descriptive statistics 63
- Page 94 and 95:
CHAPTER 3 Descriptive statistics 65
- Page 96 and 97:
3.5 Scattergrams Definition CHAPTER
- Page 98 and 99:
SPSS: generating scattergrams CHAPT
- Page 100 and 101:
CHAPTER 3 Descriptive statistics 71
- Page 102 and 103:
3.7 The normal distribution CHAPTER
- Page 104 and 105:
3.8.1 The range CHAPTER 3 Descripti
- Page 106 and 107:
Definition CHAPTER 3 Descriptive st
- Page 108 and 109:
SPSS: obtaining measures of variati
- Page 110 and 111:
CHAPTER 3 Descriptive statistics 81
- Page 112 and 113:
Figure 3.25 Bimodal distribution CH
- Page 114 and 115:
Activity 3.9 Which of the following
- Page 116 and 117: CHAPTER 3 Descriptive statistics 87
- Page 118 and 119: Summary CHAPTER 3 Descriptive stati
- Page 120 and 121: Multiple choice questions 1. Which
- Page 122 and 123: 12. What is the mean of the followi
- Page 124 and 125: References Armitage, C. and Reidy,
- Page 126 and 127: CHAPTER 4 Probability, sampling and
- Page 128 and 129: CHAPTER 4 Probability, sampling and
- Page 130 and 131: CHAPTER 4 Probability, sampling and
- Page 132 and 133: CHAPTER 4 Probability, sampling and
- Page 134 and 135: CHAPTER 4 Probability, sampling and
- Page 136 and 137: Definition CHAPTER 4 Probability, s
- Page 138 and 139: Activity 4.6 CHAPTER 4 Probability,
- Page 140 and 141: CHAPTER 4 Probability, sampling and
- Page 142 and 143: CHAPTER 4 Probability, sampling and
- Page 144 and 145: CHAPTER 4 Probability, sampling and
- Page 146 and 147: CHAPTER 4 Probability, sampling and
- Page 148 and 149: CHAPTER 4 Probability, sampling and
- Page 150 and 151: Activity 4.8 CHAPTER 4 Probability,
- Page 152 and 153: Figure 4.22 Error bar chart for a d
- Page 154 and 155: CHAPTER 4 Probability, sampling and
- Page 156 and 157: Exercise 2 CHAPTER 4 Probability, s
- Page 158 and 159: CHAPTER 4 Probability, sampling and
- Page 160 and 161: References Åberg, M.A.I., Pedersen
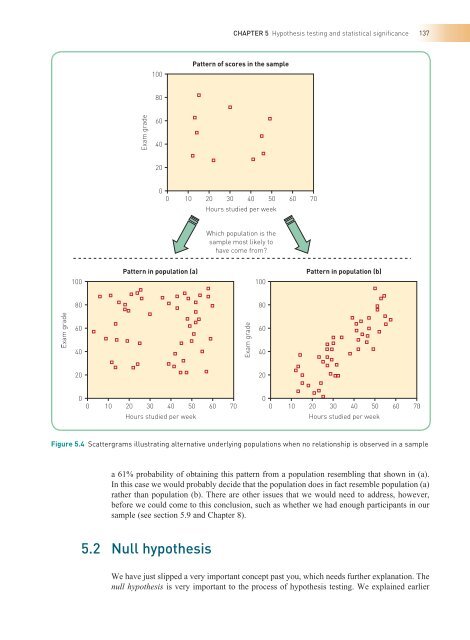
- Page 162 and 163: CHAPTER 5 Hypothesis testing and st
- Page 164 and 165: Definition CHAPTER 5 Hypothesis tes
- Page 168 and 169: Discussion point CHAPTER 5 Hypothes
- Page 170 and 171: Definitions CHAPTER 5 Hypothesis te
- Page 172 and 173: Discussion point Why report the exa
- Page 174 and 175: CHAPTER 5 Hypothesis testing and st
- Page 176 and 177: Example from the literature CHAPTER
- Page 178 and 179: 5.10 Why set E at 0.05? CHAPTER 5 H
- Page 180 and 181: Figure 5.7 Illustration of scores i
- Page 182 and 183: CHAPTER 5 Hypothesis testing and st
- Page 184 and 185: CHAPTER 5 Hypothesis testing and st
- Page 186 and 187: Figure 5.11 Flow diagram as a guide
- Page 188 and 189: CHAPTER 5 Hypothesis testing and st
- Page 190 and 191: CHAPTER 5 Hypothesis testing and st
- Page 192 and 193: 6. Convert the fi rst score from ea
- Page 194 and 195: CHAPTER 5 Hypothesis testing and st
- Page 196 and 197: CHAPTER 5 Hypothesis testing and st
- Page 198 and 199: 6.1 Bivariate correlations CHAPTER
- Page 200 and 201: Figure 6.1 Sister’s age and your
- Page 202 and 203: CHAPTER 6 Correlational analysis: P
- Page 204 and 205: Activity 6.2 CHAPTER 6 Correlationa
- Page 206 and 207: CHAPTER 6 Correlational analysis: P
- Page 208 and 209: Activity 6.4 CHAPTER 6 Correlationa
- Page 210 and 211: Figure 6.13 Perfect linear relation
- Page 212 and 213: This brings you to the following di
- Page 214 and 215: CHAPTER 6 Correlational analysis: P
- Page 216 and 217:
CHAPTER 6 Correlational analysis: P
- Page 218 and 219:
Activity 6.8 Look at the following
- Page 220 and 221:
SPSS: obtaining a scattergram matri
- Page 222 and 223:
CHAPTER 6 Correlational analysis: P
- Page 224 and 225:
CHAPTER 6 Correlational analysis: P
- Page 226 and 227:
CHAPTER 6 Correlational analysis: P
- Page 228 and 229:
Personal reflection Emeritus Profes
- Page 230 and 231:
Activity 6.10 CHAPTER 6 Correlation
- Page 232 and 233:
Summary CHAPTER 6 Correlational ana
- Page 234 and 235:
Multiple choice questions CHAPTER 6
- Page 236 and 237:
Which is the most sensible answer?
- Page 238 and 239:
CHAPTER 6 Correlational analysis: P
- Page 240 and 241:
CHAPTER OVERVIEW CHAPTER 7 Analyses
- Page 242 and 243:
CHAPTER 7 Analyses of differences b
- Page 244 and 245:
CHAPTER 7 Analyses of differences b
- Page 246 and 247:
Table 7.3 Raw data for NOISE/NO NOI
- Page 248 and 249:
7.1.8 Output for independent t-test
- Page 250 and 251:
CHAPTER 7 Analyses of differences b
- Page 252 and 253:
SPSS: for an independent t-test CHA
- Page 254 and 255:
CHAPTER 7 Analyses of differences b
- Page 256 and 257:
CAUTION! CHAPTER 7 Analyses of diff
- Page 258 and 259:
Mean (SD) performance for each task
- Page 260 and 261:
CHAPTER 7 Analyses of differences b
- Page 262 and 263:
Then we come to the paired sample s
- Page 264 and 265:
1. The value of the test statistic
- Page 266 and 267:
SPSS exercise CHAPTER 7 Analyses of
- Page 268 and 269:
Questions 8 to 10 relate to the fol
- Page 270 and 271:
CHAPTER 7 Analyses of differences b
- Page 272 and 273:
CHAPTER OVERVIEW CHAPTER 8 Issues o
- Page 274 and 275:
Personal reflection From Professor
- Page 276 and 277:
CHAPTER 8 Issues of significance 24
- Page 278 and 279:
CHAPTER 8 Issues of significance 24
- Page 280 and 281:
CHAPTER 8 Issues of significance 25
- Page 282 and 283:
8.5 Calculating power CHAPTER 8 Iss
- Page 284 and 285:
Example from the literature Cogniti
- Page 286 and 287:
CHAPTER 8 Issues of significance 25
- Page 288 and 289:
8. All other things being equal, th
- Page 290 and 291:
17. Confi dence intervals around a
- Page 292 and 293:
CHAPTER OVERVIEW CHAPTER 9 Measures
- Page 294 and 295:
9.2 One-variable 7 2 or goodness-of
- Page 296 and 297:
4. The fi gures are then added to g
- Page 298 and 299:
This opens the Chi-square dialogue
- Page 300 and 301:
Activity 9.3 The goodness-of-fit te
- Page 302 and 303:
CHAPTER 9 Measures of association 2
- Page 304 and 305:
Finally, click on OK: This produces
- Page 306 and 307:
The data can be written as shown in
- Page 308 and 309:
This brings up the following dialog
- Page 310 and 311:
9.3.2 Output for 2 ¥ 2 G 2 CHAPTER
- Page 312 and 313:
We then have the test statistics: C
- Page 314 and 315:
Also, for the test statistic to be
- Page 316 and 317:
CHAPTER 9 Measures of association 2
- Page 318 and 319:
Summary • For the analysis of rel
- Page 320 and 321:
B: The wettest day of the week put
- Page 322 and 323:
7. Look at the following output: c
- Page 324 and 325:
There is something wrong with the a
- Page 326 and 327:
CHAPTER OVERVIEW CHAPTER 10 Analysi
- Page 328 and 329:
There are two types of ANOVA: CHAPT
- Page 330 and 331:
CHAPTER 10 Analysis of differences
- Page 332 and 333:
CHAPTER 10 Analysis of differences
- Page 334 and 335:
CHAPTER 10 Analysis of differences
- Page 336 and 337:
ONEWAY CHAPTER 10 Analysis of diffe
- Page 338 and 339:
CHAPTER 10 Analysis of differences
- Page 340 and 341:
CHAPTER 10 Analysis of differences
- Page 342 and 343:
CHAPTER 10 Analysis of differences
- Page 344 and 345:
CHAPTER 10 Analysis of differences
- Page 346 and 347:
10.7.3 Post-hoc tests/planned CHAPT
- Page 348 and 349:
Figure 10.5 Mean symptom severity r
- Page 350 and 351:
CHAPTER 10 Analysis of differences
- Page 352 and 353:
2. Which is the most appropriate co
- Page 354 and 355:
CHAPTER 10 Analysis of differences
- Page 356 and 357:
Which is the most appropriate state
- Page 358 and 359:
CHAPTER OVERVIEW CHAPTER 11 Analysi
- Page 360 and 361:
CHAPTER 11 Analysis of variance wit
- Page 362 and 363:
11.4 ANOVA terminology CHAPTER 11 A
- Page 364 and 365:
CHAPTER 11 Analysis of variance wit
- Page 366 and 367:
CHAPTER 11 Analysis of variance wit
- Page 368 and 369:
CHAPTER 11 Analysis of variance wit
- Page 370 and 371:
CHAPTER 11 Analysis of variance wit
- Page 372 and 373:
CHAPTER 11 Analysis of variance wit
- Page 374 and 375:
CHAPTER 11 Analysis of variance wit
- Page 376 and 377:
CHAPTER 11 Analysis of variance wit
- Page 378 and 379:
CHAPTER 11 Analysis of variance wit
- Page 380 and 381:
CHAPTER 11 Analysis of variance wit
- Page 382 and 383:
CHAPTER 11 Analysis of variance wit
- Page 384 and 385:
CHAPTER 11 Analysis of variance wit
- Page 386 and 387:
11.6.1 Sources of variance CHAPTER
- Page 388 and 389:
CHAPTER 11 Analysis of variance wit
- Page 390 and 391:
T-TEST CHAPTER 11 Analysis of varia
- Page 392 and 393:
11.6.3 Effect size CHAPTER 11 Analy
- Page 394 and 395:
CHAPTER 11 Analysis of variance wit
- Page 396 and 397:
CHAPTER 11 Analysis of variance wit
- Page 398 and 399:
CHAPTER 11 Analysis of variance wit
- Page 400 and 401:
CHAPTER 11 Analysis of variance wit
- Page 402 and 403:
Example from the literature Attenti
- Page 404 and 405:
Click on the Defi ne button and set
- Page 406 and 407:
SPSS exercises Exercise 1 CHAPTER 1
- Page 408 and 409:
2. ANOVA is useful for: (a) Teasing
- Page 410 and 411:
CHAPTER 11 Analysis of variance wit
- Page 412 and 413:
References Baron-Cohen, S., Wheelwr
- Page 414 and 415:
CHAPTER 12 Regression analysis 385
- Page 416 and 417:
Figure 12.2 Scatterplot with line o
- Page 418 and 419:
CHAPTER 12 Regression analysis 389
- Page 420 and 421:
Ensuring that the Linear option is
- Page 422 and 423:
CHAPTER 12 Regression analysis 393
- Page 424 and 425:
Figure 12.5 Plot of x with y CHAPTE
- Page 426 and 427:
Figure 12.7 Plot of x with y CHAPTE
- Page 428 and 429:
Figure 12.8 Plot of sales against p
- Page 430 and 431:
SPSS: linear regression analysis Se
- Page 432 and 433:
Variance explained CHAPTER 12 Regre
- Page 434 and 435:
CHAPTER 12 Regression analysis 405
- Page 436 and 437:
CHAPTER 12 Regression analysis 407
- Page 438 and 439:
CHAPTER 12 Regression analysis 409
- Page 440 and 441:
R 2 CHAPTER 12 Regression analysis
- Page 442 and 443:
Y (predicted examination success) =
- Page 444 and 445:
Personal reflection Article: Barrie
- Page 446 and 447:
Summary • Regression analysis all
- Page 448 and 449:
Multiple choice questions 1. The li
- Page 450 and 451:
10. The correlation between credit
- Page 452 and 453:
20. Which is the most appropriate s
- Page 454 and 455:
Example CHAPTER 13 Analysis partial
- Page 456 and 457:
This gives you the following dialog
- Page 458 and 459:
CHAPTER 13 Analysis partialling out
- Page 460 and 461:
CHAPTER 13 Analysis partialling out
- Page 462 and 463:
Figure 13.4 Regression lines for ea
- Page 464 and 465:
In addition, for most purposes: CHA
- Page 466 and 467:
Figure 13.11 Regression lines for t
- Page 468 and 469:
CHAPTER 13 Analysis partialling out
- Page 470 and 471:
SPSS: obtaining output for an ANCOV
- Page 472 and 473:
CHAPTER 13 Analysis partialling out
- Page 474 and 475:
Figure 13.12 Regression lines for e
- Page 476 and 477:
Activity 13.4 ANCOVA assumes that:
- Page 478 and 479:
SPSS exercise CHAPTER 13 Analysis p
- Page 480 and 481:
5. The covariate is: (a) Beginning
- Page 482 and 483:
Questions 16 to 20 relate to the fo
- Page 484 and 485:
CHAPTER OVERVIEW CHAPTER 14 Introdu
- Page 486 and 487:
Activity 14.1 CHAPTER 14 Introducti
- Page 488 and 489:
Figure 14.1 Ten correlated variable
- Page 490 and 491:
CHAPTER 14 Introduction to factor a
- Page 492 and 493:
CHAPTER 14 Introduction to factor a
- Page 495 and 496:
466 Statistics without maths for ps
- Page 497 and 498:
468 Statistics without maths for ps
- Page 499 and 500:
470 Statistics without maths for ps
- Page 501 and 502:
472 Statistics without maths for ps
- Page 503 and 504:
474 Statistics without maths for ps
- Page 505 and 506:
476 Statistics without maths for ps
- Page 507 and 508:
478 Statistics without maths for ps
- Page 509 and 510:
480 Statistics without maths for ps
- Page 511 and 512:
482 Statistics without maths for ps
- Page 513 and 514:
484 Statistics without maths for ps
- Page 515 and 516:
486 Statistics without maths for ps
- Page 517 and 518:
488 Statistics without maths for ps
- Page 519 and 520:
490 Statistics without maths for ps
- Page 521 and 522:
492 Statistics without maths for ps
- Page 523 and 524:
494 Statistics without maths for ps
- Page 525 and 526:
496 Statistics without maths for ps
- Page 527 and 528:
498 Statistics without maths for ps
- Page 529 and 530:
500 Statistics without maths for ps
- Page 531 and 532:
502 Statistics without maths for ps
- Page 533 and 534:
504 Statistics without maths for ps
- Page 535 and 536:
506 Statistics without maths for ps
- Page 537 and 538:
508 Statistics without maths for ps
- Page 539 and 540:
510 Statistics without maths for ps
- Page 541 and 542:
512 Statistics without maths for ps
- Page 543 and 544:
514 Statistics without maths for ps
- Page 545 and 546:
516 Statistics without maths for ps
- Page 547 and 548:
518 Statistics without maths for ps
- Page 549 and 550:
520 Statistics without maths for ps
- Page 551 and 552:
522 Statistics without maths for ps
- Page 553 and 554:
524 Statistics without maths for ps
- Page 555 and 556:
526 Statistics without maths for ps
- Page 557 and 558:
528 Statistics without maths for ps
- Page 559 and 560:
530 Statistics without maths for ps
- Page 561 and 562:
532 Statistics without maths for ps
- Page 563 and 564:
534 Statistics without maths for ps
- Page 565 and 566:
536 Statistics without maths for ps
- Page 567 and 568:
538 Statistics without maths for ps
- Page 569 and 570:
540 Statistics without maths for ps
- Page 571 and 572:
542 Statistics without maths for ps
- Page 573 and 574:
544 Statistics without maths for ps
- Page 575 and 576:
546 Statistics without maths for ps
- Page 577 and 578:
548 Statistics without maths for ps
- Page 579 and 580:
550 Statistics without maths for ps
- Page 581 and 582:
552 Statistics without maths for ps
- Page 583 and 584:
554 Statistics without maths for ps
- Page 585 and 586:
556 Statistics without maths for ps
- Page 587 and 588:
558 Statistics without maths for ps
- Page 589 and 590:
560 Statistics without maths for ps
- Page 591 and 592:
562 Statistics without maths for ps
- Page 593 and 594:
564 Statistics without maths for ps
- Page 595 and 596:
566 Statistics without maths for ps
- Page 597 and 598:
568 Statistics without maths for ps
- Page 599 and 600:
570 Statistics without maths for ps
- Page 601 and 602:
572 Statistics without maths for ps
- Page 603 and 604:
574 Statistics without maths for ps
- Page 605 and 606:
576 Statistics without maths for ps
- Page 607 and 608:
578 Statistics without maths for ps
- Page 609 and 610:
580 Statistics without maths for ps
- Page 611 and 612:
582 Statistics without maths for ps
- Page 613 and 614:
584 Statistics without maths for ps
- Page 615 and 616:
586 Statistics without maths for ps
- Page 617 and 618:
588 Statistics without maths for ps
- Page 619 and 620:
590 Statistics without maths for ps
- Page 621 and 622:
592 Statistics without maths for ps
- Page 623 and 624:
594 Statistics without maths for ps
- Page 625 and 626:
596 Statistics without maths for ps
- Page 627 and 628:
598 Statistics without maths for ps
- Page 629 and 630:
600 Statistics without maths for ps
- Page 631 and 632:
602 Statistics without maths for ps
- Page 633 and 634:
604 Statistics without maths for ps
- Page 635 and 636:
606 Statistics without maths for ps
- Page 637 and 638:
608 z-score Statistics without math
- Page 639 and 640:
610 Statistics without maths for ps
- Page 641 and 642:
612 Index autism-like traits 348 av
- Page 643 and 644:
614 Index expected frequencies 265,
- Page 645 and 646:
616 Index mental health procrastina
- Page 647 and 648:
618 Index sample size 250 - 2, 253
- Page 649:
620 Index Weight Cases dialogue box