Intensive Survey of the Guadalupe River Segment 1806
Intensive Survey of the Guadalupe River Segment 1806
Intensive Survey of the Guadalupe River Segment 1806
You also want an ePaper? Increase the reach of your titles
YUMPU automatically turns print PDFs into web optimized ePapers that Google loves.
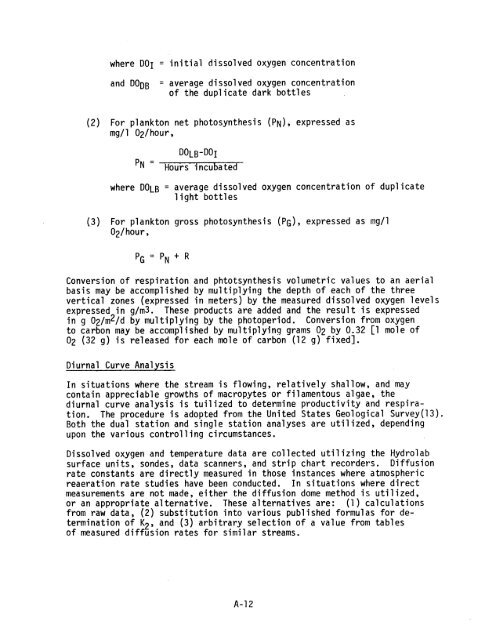
where DOj = initial dissolved oxygen concentration<br />
and DOqb = average dissolved oxygen concentration<br />
<strong>of</strong> <strong>the</strong> duplicate dark bottles<br />
(2) For plankton net photosyn<strong>the</strong>sis (Pn), expressed as<br />
mg/1 02/hour,<br />
DOlb-DOi<br />
N Hours incubated<br />
where DOlb = average dissolved oxygen concentration <strong>of</strong> duplicate<br />
light bottles<br />
(3) For plankton gross photosyn<strong>the</strong>sis (Pq), expressed as mg/1<br />
02/hour,<br />
PG = PN + R<br />
Conversion <strong>of</strong> respiration and phtotsyn<strong>the</strong>sis volumetric values to an aerial<br />
basis may be accomplished by multiplying <strong>the</strong> depth <strong>of</strong> each <strong>of</strong> <strong>the</strong> three<br />
vertical zones (expressed in meters) by <strong>the</strong> measured dissolved oxygen levels<br />
expressed in g/m3. These products are added and <strong>the</strong> result is expressed<br />
in g 02/m2/d by multiplying by <strong>the</strong> photoperiod. Conversion from oxygen<br />
to carbon may be accomplished by multiplying grams O2 by 0.32 [1 mole <strong>of</strong><br />
O2 (32 g) is released for each mole <strong>of</strong> carbon (12 g) fixed].<br />
Diurnal Curve Analysis<br />
In situations where <strong>the</strong> stream is flowing, relatively shallow, and may<br />
contain appreciable growths <strong>of</strong> macropytes or filamentous algae, <strong>the</strong><br />
diurnal curve analysis is tuilized to determine productivity and respira<br />
tion. The procedure is adopted from <strong>the</strong> United States Geological <strong>Survey</strong>(13),<br />
Both <strong>the</strong> dual station and single station analyses are utilized, depending<br />
upon <strong>the</strong> various controlling circumstances.<br />
Dissolved oxygen and temperature data are collected utilizing <strong>the</strong> Hydrolab<br />
surface units, sondes, data scanners, and strip chart recorders. Diffusion<br />
rate constants are directly measured in those instances where atmospheric<br />
reaeration rate studies have been conducted. In situations where direct<br />
measurements are not made, ei<strong>the</strong>r <strong>the</strong> diffusion dome method is utilized,<br />
or an appropriate alternative. These alternatives are: (1) calculations<br />
from raw data, (2) substitution into various published formulas for de<br />
termination <strong>of</strong> K2, and (3) arbitrary selection <strong>of</strong> a value from tables<br />
<strong>of</strong> measured diffusion rates for similar streams.<br />
A-12


