LiveLihoods strategies and househoLd resiLience to Food insecurity ...
LiveLihoods strategies and househoLd resiLience to Food insecurity ...
LiveLihoods strategies and househoLd resiLience to Food insecurity ...

Create successful ePaper yourself
Turn your PDF publications into a flip-book with our unique Google optimized e-Paper software.
LIVELIHOODS STRATEGIES AND HOUSEHOLD RESILIENCE TO FOOD INSECURITY: AN EMPIRICAL ANALYSIS TO<br />
KENYA<br />
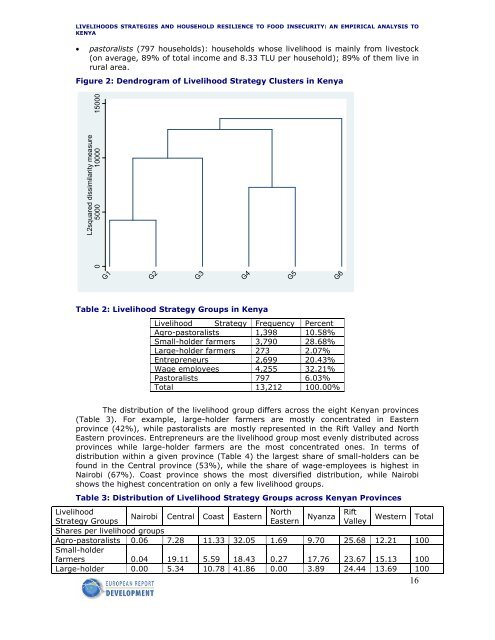
• pas<strong>to</strong>ralists (797 households): households whose livelihood is mainly from lives<strong>to</strong>ck<br />
(on average, 89% of <strong>to</strong>tal income <strong>and</strong> 8.33 TLU per household); 89% of them live in<br />
rural area.<br />
Figure 2: Dendrogram of Livelihood Strategy Clusters in Kenya<br />
L2squared dissimilarity measure<br />
0 5000 10000 15000<br />
G1<br />
G2<br />
Table 2: Livelihood Strategy Groups in Kenya<br />
G3<br />
G4<br />
Livelihood Strategy Frequency Percent<br />
Agro-pas<strong>to</strong>ralists 1,398 10.58%<br />
Small-holder farmers 3,790 28.68%<br />
Large-holder farmers 273 2.07%<br />
Entrepreneurs 2,699 20.43%<br />
Wage employees 4,255 32.21%<br />
Pas<strong>to</strong>ralists 797 6.03%<br />
Total 13,212 100.00%<br />
The distribution of the livelihood group differs across the eight Kenyan provinces<br />
(Table 3). For example, large-holder farmers are mostly concentrated in Eastern<br />
province (42%), while pas<strong>to</strong>ralists are mostly represented in the Rift Valley <strong>and</strong> North<br />
Eastern provinces. Entrepreneurs are the livelihood group most evenly distributed across<br />
provinces while large-holder farmers are the most concentrated ones. In terms of<br />
distribution within a given province (Table 4) the largest share of small-holders can be<br />
found in the Central province (53%), while the share of wage-employees is highest in<br />
Nairobi (67%). Coast province shows the most diversified distribution, while Nairobi<br />
shows the highest concentration on only a few livelihood groups.<br />
Table 3: Distribution of Livelihood Strategy Groups across Kenyan Provinces<br />
Livelihood<br />
Strategy Groups<br />
Nairobi Central Coast<br />
North<br />
Eastern<br />
Eastern<br />
Nyanza<br />
Rift<br />
Western Total<br />
Valley<br />
Shares per livelihood groups<br />
Agro-pas<strong>to</strong>ralists<br />
Small-holder<br />
0.06 7.28 11.33 32.05 1.69 9.70 25.68 12.21 100<br />
farmers 0.04 19.11 5.59 18.43 0.27 17.76 23.67 15.13 100<br />
Large-holder 0.00 5.34 10.78 41.86 0.00 3.89 24.44 13.69 100<br />
16<br />
G5<br />
G6