LiveLihoods strategies and househoLd resiLience to Food insecurity ...
LiveLihoods strategies and househoLd resiLience to Food insecurity ...
LiveLihoods strategies and househoLd resiLience to Food insecurity ...

Create successful ePaper yourself
Turn your PDF publications into a flip-book with our unique Google optimized e-Paper software.
LIVELIHOODS STRATEGIES AND HOUSEHOLD RESILIENCE TO FOOD INSECURITY: AN EMPIRICAL ANALYSIS TO<br />
KENYA<br />
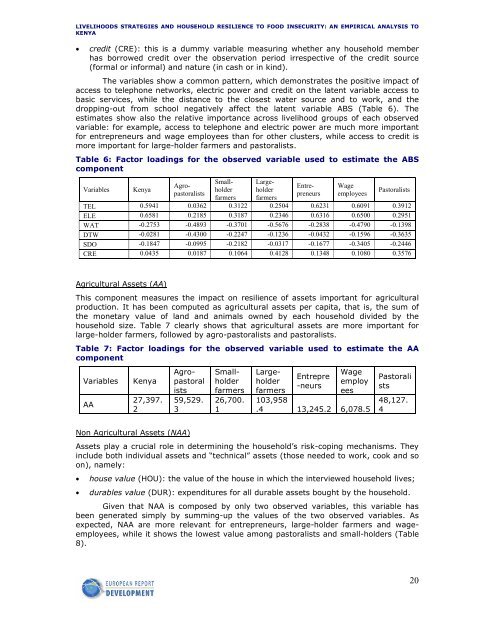
• credit (CRE): this is a dummy variable measuring whether any household member<br />
has borrowed credit over the observation period irrespective of the credit source<br />
(formal or informal) <strong>and</strong> nature (in cash or in kind).<br />
The variables show a common pattern, which demonstrates the positive impact of<br />
access <strong>to</strong> telephone networks, electric power <strong>and</strong> credit on the latent variable access <strong>to</strong><br />
basic services, while the distance <strong>to</strong> the closest water source <strong>and</strong> <strong>to</strong> work, <strong>and</strong> the<br />
dropping-out from school negatively affect the latent variable ABS (Table 6). The<br />
estimates show also the relative importance across livelihood groups of each observed<br />
variable: for example, access <strong>to</strong> telephone <strong>and</strong> electric power are much more important<br />
for entrepreneurs <strong>and</strong> wage employees than for other clusters, while access <strong>to</strong> credit is<br />
more important for large-holder farmers <strong>and</strong> pas<strong>to</strong>ralists.<br />
Table 6: Fac<strong>to</strong>r loadings for the observed variable used <strong>to</strong> estimate the ABS<br />
component<br />
Variables Kenya<br />
Agropas<strong>to</strong>ralists <br />
Smallholder<br />
farmers<br />
Largeholder<br />
farmers<br />
Entre-<br />
preneurs<br />
Wage<br />
employees<br />
Pas<strong>to</strong>ralists<br />
TEL 0.5941 0.0362 0.3122 0.2504 0.6231 0.6091 0.3912<br />
ELE 0.6581 0.2185 0.3187 0.2346 0.6316 0.6500 0.2951<br />
WAT -0.2753 -0.4893 -0.3701 -0.5676 -0.2838 -0.4790 -0.1398<br />
DTW -0.0281 -0.4300 -0.2247 -0.1236 -0.0432 -0.1596 -0.3635<br />
SDO -0.1847 -0.0995 -0.2182 -0.0317 -0.1677 -0.3405 -0.2446<br />
CRE 0.0435 0.0187 0.1064 0.4128 0.1348 0.1080 0.3576<br />
Agricultural Assets (AA)<br />
This component measures the impact on resilience of assets important for agricultural<br />
production. It has been computed as agricultural assets per capita, that is, the sum of<br />
the monetary value of l<strong>and</strong> <strong>and</strong> animals owned by each household divided by the<br />
household size. Table 7 clearly shows that agricultural assets are more important for<br />
large-holder farmers, followed by agro-pas<strong>to</strong>ralists <strong>and</strong> pas<strong>to</strong>ralists.<br />
Table 7: Fac<strong>to</strong>r loadings for the observed variable used <strong>to</strong> estimate the AA<br />
component<br />
Variables Kenya<br />
AA<br />
27,397.<br />
2<br />
Agropas<strong>to</strong>ral<br />
ists<br />
59,529.<br />
3<br />
Non Agricultural Assets (NAA)<br />
Smallholder<br />
farmers<br />
26,700.<br />
1<br />
Largeholder<br />
farmers<br />
Entrepre<br />
-neurs<br />
Wage<br />
employ<br />
ees<br />
103,958<br />
.4 13,245.2 6,078.5<br />
Pas<strong>to</strong>rali<br />
sts<br />
48,127.<br />
4<br />
Assets play a crucial role in determining the household’s risk-coping mechanisms. They<br />
include both individual assets <strong>and</strong> “technical” assets (those needed <strong>to</strong> work, cook <strong>and</strong> so<br />
on), namely:<br />
• house value (HOU): the value of the house in which the interviewed household lives;<br />
• durables value (DUR): expenditures for all durable assets bought by the household.<br />
Given that NAA is composed by only two observed variables, this variable has<br />
been generated simply by summing-up the values of the two observed variables. As<br />
expected, NAA are more relevant for entrepreneurs, large-holder farmers <strong>and</strong> wageemployees,<br />
while it shows the lowest value among pas<strong>to</strong>ralists <strong>and</strong> small-holders (Table<br />
8).<br />
20