LiveLihoods strategies and househoLd resiLience to Food insecurity ...
LiveLihoods strategies and househoLd resiLience to Food insecurity ...
LiveLihoods strategies and househoLd resiLience to Food insecurity ...

You also want an ePaper? Increase the reach of your titles
YUMPU automatically turns print PDFs into web optimized ePapers that Google loves.
LIVELIHOODS STRATEGIES AND HOUSEHOLD RESILIENCE TO FOOD INSECURITY: AN EMPIRICAL ANALYSIS TO<br />
KENYA<br />
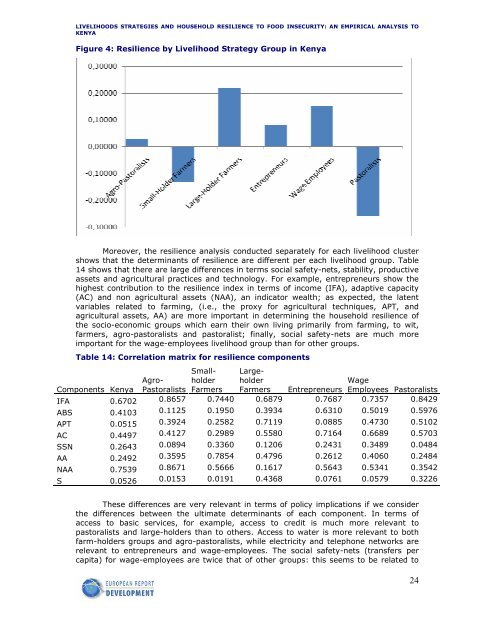
Figure 4: Resilience by Livelihood Strategy Group in Kenya<br />
Moreover, the resilience analysis conducted separately for each livelihood cluster<br />
shows that the determinants of resilience are different per each livelihood group. Table<br />
14 shows that there are large differences in terms social safety-nets, stability, productive<br />
assets <strong>and</strong> agricultural practices <strong>and</strong> technology. For example, entrepreneurs show the<br />
highest contribution <strong>to</strong> the resilience index in terms of income (IFA), adaptive capacity<br />
(AC) <strong>and</strong> non agricultural assets (NAA), an indica<strong>to</strong>r wealth; as expected, the latent<br />
variables related <strong>to</strong> farming, (i.e., the proxy for agricultural techniques, APT, <strong>and</strong><br />
agricultural assets, AA) are more important in determining the household resilience of<br />
the socio-economic groups which earn their own living primarily from farming, <strong>to</strong> wit,<br />
farmers, agro-pas<strong>to</strong>ralists <strong>and</strong> pas<strong>to</strong>ralist; finally, social safety-nets are much more<br />
important for the wage-employees livelihood group than for other groups.<br />
Table 14: Correlation matrix for resilience components<br />
Components Kenya<br />
Agro-<br />
Pas<strong>to</strong>ralists<br />
Smallholder<br />
Farmers<br />
Largeholder<br />
Farmers Entrepreneurs<br />
Wage<br />
Employees Pas<strong>to</strong>ralists<br />
IFA 0.6702 0.8657 0.7440 0.6879 0.7687 0.7357 0.8429<br />
ABS 0.4103 0.1125 0.1950 0.3934 0.6310 0.5019 0.5976<br />
APT 0.0515 0.3924 0.2582 0.7119 0.0885 0.4730 0.5102<br />
AC 0.4497 0.4127 0.2989 0.5580 0.7164 0.6689 0.5703<br />
SSN 0.2643 0.0894 0.3360 0.1206 0.2431 0.3489 0.0484<br />
AA 0.2492 0.3595 0.7854 0.4796 0.2612 0.4060 0.2484<br />
NAA 0.7539 0.8671 0.5666 0.1617 0.5643 0.5341 0.3542<br />
S 0.0526 0.0153 0.0191 0.4368 0.0761 0.0579 0.3226<br />
These differences are very relevant in terms of policy implications if we consider<br />
the differences between the ultimate determinants of each component. In terms of<br />
access <strong>to</strong> basic services, for example, access <strong>to</strong> credit is much more relevant <strong>to</strong><br />
pas<strong>to</strong>ralists <strong>and</strong> large-holders than <strong>to</strong> others. Access <strong>to</strong> water is more relevant <strong>to</strong> both<br />
farm-holders groups <strong>and</strong> agro-pas<strong>to</strong>ralists, while electricity <strong>and</strong> telephone networks are<br />
relevant <strong>to</strong> entrepreneurs <strong>and</strong> wage-employees. The social safety-nets (transfers per<br />
capita) for wage-employees are twice that of other groups: this seems <strong>to</strong> be related <strong>to</strong><br />
24