

Annual report 2008, 1.19 MB - Telenor
Annual report 2008, 1.19 MB - Telenor
Annual report 2008, 1.19 MB - Telenor

Create successful ePaper yourself
Turn your PDF publications into a flip-book with our unique Google optimized e-Paper software.
17<br />
NOTES TO THE FINANCIAL STATEMENTS<br />
<strong>Telenor</strong> Group<br />
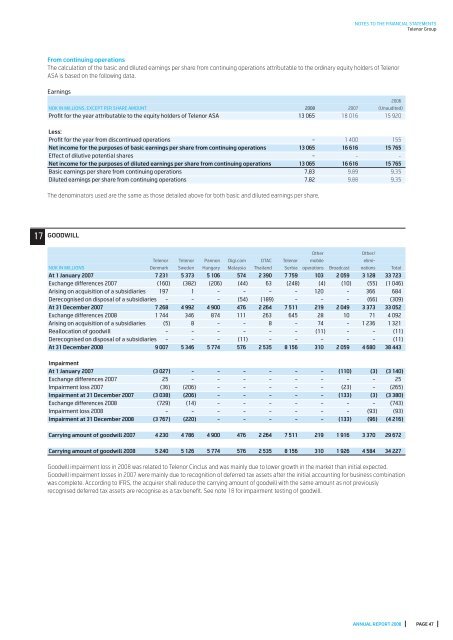
From continuing operations<br />
The calculation of the basic and diluted earnings per share from continuing operations attributable to the ordinary equity holders of <strong>Telenor</strong><br />
ASA is based on the following data.<br />
Earnings<br />
NOK IN MILLIONS, EXCEPT PER SHARE AMOUNT <strong>2008</strong> 2007<br />
2006<br />
(Unaudited)<br />
Profi t for the year attributable to the equity holders of <strong>Telenor</strong> ASA 13 065 18 016 15 920<br />
Less:<br />
Profi t for the year from discontinued operations - 1 400 155<br />
Net income for the purposes of basic earnings per share from continuing operations 13 065 16 616 15 765<br />
Effect of dilutive potential shares - - -<br />
Net income for the purposes of diluted earnings per share from continuing operations 13 065 16 616 15 765<br />
Basic earnings per share from continuing operations 7.83 9.89 9.35<br />
Diluted earnings per share from continuing operations 7.82 9.88 9.35<br />
The denominators used are the same as those detailed above for both basic and diluted earnings per share.<br />
GOODWILL<br />
Other Other/<br />
<strong>Telenor</strong> <strong>Telenor</strong> Pannon Digi.com DTAC <strong>Telenor</strong> mobile elimi-<br />
NOK IN MILLIONS Denmark Sweden Hungary Malaysia Thailand Serbia operations Broadcast nations Total<br />
At 1 January 2007 7 231 5 373 5 106 574 2 390 7 759 103 2 059 3 128 33 723<br />
Exchange differences 2007 (160) (382) (206) (44) 63 (248) (4) (10) (55) (1 046)<br />
Arising on acquisition of a subsidiaries 197 1 - - - - 120 - 366 684<br />
Derecognised on disposal of a subsidiaries - - - (54) (189) - - - (66) (309)<br />
At 31 December 2007 7 268 4 992 4 900 476 2 264 7 511 219 2 049 3 373 33 052<br />
Exchange differences <strong>2008</strong> 1 744 346 874 111 263 645 28 10 71 4 092<br />
Arising on acquisition of a subsidiaries (5) 8 - - 8 - 74 - 1 236 1 321<br />
Reallocation of goodwill - - - - - - (11) - - (11)<br />
Derecognised on disposal of a subsidiaries - - - (11) - - - - - (11)<br />
At 31 December <strong>2008</strong> 9 007 5 346 5 774 576 2 535 8 156 310 2 059 4 680 38 443<br />
Impairment<br />
At 1 January 2007 (3 027) - - - - - - (110) (3) (3 140)<br />
Exchange differences 2007 25 - - - - - - - - 25<br />
Impairment loss 2007 (36) (206) - - - - - (23) - (265)<br />
Impairment at 31 December 2007 (3 038) (206) - - - - - (133) (3) (3 380)<br />
Exchange differences <strong>2008</strong> (729) (14) - - - - - - - (743)<br />
Impairment loss <strong>2008</strong> - - - - - - - - (93) (93)<br />
Impairment at 31 December <strong>2008</strong> (3 767) (220) - - - - - (133) (96) (4 216)<br />
Carrying amount of goodwill 2007 4 230 4 786 4 900 476 2 264 7 511 219 1 916 3 370 29 672<br />
Carrying amount of goodwill <strong>2008</strong> 5 240 5 126 5 774 576 2 535 8 156 310 1 926 4 584 34 227<br />
Goodwill impairment loss in <strong>2008</strong> was related to <strong>Telenor</strong> Cinclus and was mainly due to lower growth in the market than initial expected.<br />
Goodwill impairment losses in 2007 were mainly due to recognition of deferred tax assets after the initial accounting for business combination<br />
was complete. According to IFRS, the acquirer shall reduce the carrying amount of goodwill with the same amount as not previously<br />
recognised deferred tax assets are recognise as a tax benefi t. See note 18 for impairment testing of goodwill.<br />
ANNUAL REPORT <strong>2008</strong> PAGE 47


