Pedestrian Comfort Guidance for London
Pedestrian Comfort Guidance for London
Pedestrian Comfort Guidance for London

You also want an ePaper? Increase the reach of your titles
YUMPU automatically turns print PDFs into web optimized ePapers that Google loves.
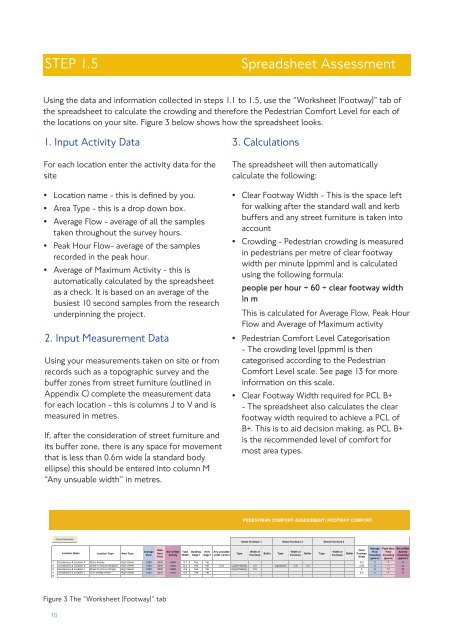
STEP 1.5 Spreadsheet Assessment<br />
Using the data and in<strong>for</strong>mation collected in steps 1.1 to 1.5, use the “Worksheet (Footway)” tab of<br />
the spreadsheet to calculate the crowding and there<strong>for</strong>e the <strong>Pedestrian</strong> <strong>Com<strong>for</strong>t</strong> Level <strong>for</strong> each of<br />
the locations on your site. Figure 3 below shows how the spreadsheet looks.<br />
1. Input Activity Data<br />
For each location enter the activity data <strong>for</strong> the<br />
site<br />
•<br />
•<br />
•<br />
•<br />
•<br />
Location name - this is defined by you.<br />
Area Type - this is a drop down box.<br />
Average Flow - average of all the samples<br />
taken throughout the survey hours.<br />
Peak Hour Flow- average of the samples<br />
recorded in the peak hour.<br />
Average of Maximum Activity - this is<br />
automatically calculated by the spreadsheet<br />
as a check. It is based on an average of the<br />
busiest 10 second samples from the research<br />
underpinning the project.<br />
2. Input Measurement Data<br />
Using your measurements taken on site or from<br />
records such as a topographic survey and the<br />
buffer zones from street furniture (outlined in<br />
Appendix C) complete the measurement data<br />
<strong>for</strong> each location - this is columns J to V and is<br />
measured in metres.<br />
If, after the consideration of street furniture and<br />
its buffer zone, there is any space <strong>for</strong> movement<br />
that is less than 0.6m wide (a standard body<br />
ellipse) this should be entered into column M<br />
“Any unsuable width” in metres.<br />
08:03, 25/01/2010<br />
Location Type Area Type<br />
Average<br />
Flow<br />
Peak<br />
Hour<br />
Flow<br />
Figure 3 The “Worksheet (Footway)” tab<br />
Ave of Max<br />
Activity<br />
Total Building<br />
Width Edge?<br />
Kerb Any unusable<br />
Edge? width (