

ChangingCottonLandscapeNeilForrester
ChangingCottonLandscapeNeilForrester
ChangingCottonLandscapeNeilForrester

Create successful ePaper yourself
Turn your PDF publications into a flip-book with our unique Google optimized e-Paper software.
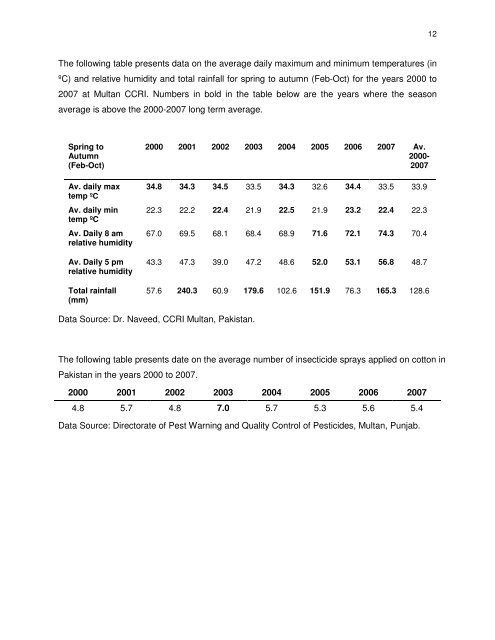
The following table presents data on the average daily maximum and minimum temperatures (in<br />
ºC) and relative humidity and total rainfall for spring to autumn (Feb-Oct) for the years 2000 to<br />
2007 at Multan CCRI. Numbers in bold in the table below are the years where the season<br />
average is above the 2000-2007 long term average.<br />
Spring to<br />
Autumn<br />
(Feb-Oct)<br />
Av. daily max<br />
temp ºC<br />
Av. daily min<br />
temp ºC<br />
Av. Daily 8 am<br />
relative humidity<br />
Av. Daily 5 pm<br />
relative humidity<br />
Total rainfall<br />
(mm)<br />
2000 2001 2002 2003 2004 2005 2006 2007 Av.<br />
2000-<br />
2007<br />
34.8 34.3 34.5 33.5 34.3 32.6 34.4 33.5 33.9<br />
22.3 22.2 22.4 21.9 22.5 21.9 23.2 22.4 22.3<br />
67.0 69.5 68.1 68.4 68.9 71.6 72.1 74.3 70.4<br />
43.3 47.3 39.0 47.2 48.6 52.0 53.1 56.8 48.7<br />
57.6 240.3 60.9 179.6 102.6 151.9 76.3 165.3 128.6<br />
Data Source: Dr. Naveed, CCRI Multan, Pakistan.<br />
The following table presents date on the average number of insecticide sprays applied on cotton in<br />
Pakistan in the years 2000 to 2007.<br />
2000 2001 2002 2003 2004 2005 2006 2007<br />
4.8 5.7 4.8 7.0 5.7 5.3 5.6 5.4<br />
Data Source: Directorate of Pest Warning and Quality Control of Pesticides, Multan, Punjab.<br />
12