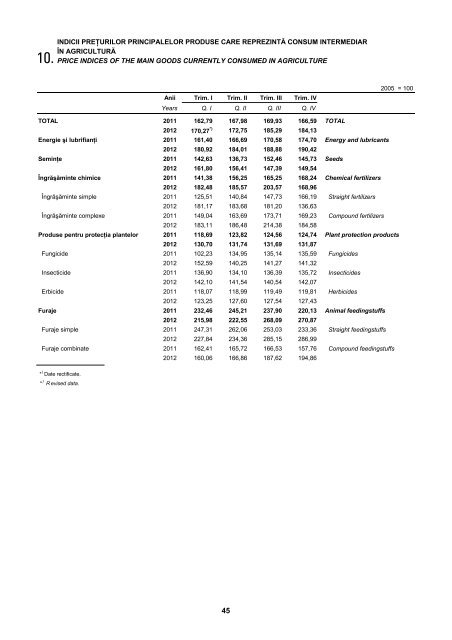
10. INDICII PREŢURILOR PRINCIPALELOR PRODUSE CARE REPREZINTĂ CONSUM INTERMEDIAR ÎN AGRICULTURĂ PRICE INDICES OF THE MAIN GOODS CURRENTLY CONSUMED IN AGRICULTURE Anii Trim. I Trim. II Trim. III Trim. IV Years Q. I Q. II Q. III Q. IV TOTAL 2011 162,79 167,98 169,93 166,59 TOTAL 2012 170,27 *) 172,75 185,29 184,13 Energie şi lubrifianţi 2011 161,40 166,69 170,58 174,70 Energy and lubricants 2012 180,92 184,01 188,88 190,42 Seminţe 2011 142,63 136,73 152,46 145,73 Seeds 2012 161,80 156,41 147,39 149,54 Îngrăşăminte chimice 2011 141,38 156,25 165,25 168,24 Chemical fertilizers 2012 182,48 185,57 203,57 168,96 Îngrăşăminte simple 2011 125,51 140,84 147,73 166,19 Straight fertilizers 2012 181,17 183,68 181,20 136,63 Îngrăşăminte complexe 2011 149,04 163,69 173,71 169,23 Compound fertilizers 2012 183,11 186,48 214,38 184,58 2005 = 100 Produse pentru protecţia plantelor 2011 118,69 123,82 124,56 124,74 Plant protection products 2012 130,70 131,74 131,69 131,87 Fungici<strong>de</strong> 2011 102,23 134,95 135,14 135,59 Fungici<strong>de</strong>s 2012 152,59 140,25 141,27 141,32 Insectici<strong>de</strong> 2011 136,90 134,10 136,39 135,72 Insectici<strong>de</strong>s 2012 142,10 141,54 140,54 142,07 Erbici<strong>de</strong> 2011 118,07 118,99 119,49 119,81 Herbici<strong>de</strong>s 2012 123,25 127,60 127,54 127,43 Furaje 2011 232,46 245,21 237,90 220,13 Animal feedingstuffs 2012 215,98 222,55 268,09 270,87 Furaje simple 2011 247,31 262,06 253,03 233,36 Straight feedingstuffs 2012 227,84 234,36 285,15 286,99 Furaje combinate 2011 162,41 165,72 166,53 157,76 Compound feedingstuffs * ) Date rectificate. * ) R evised data. 2012 160,06 166,86 187,62 194,86 45
11. INDUSTRIAL PRODUCTION PRICE INDEX FOR TOTAL, DOMESTIC MARKET AND NON-DOMESTIC MARKET by activities (divisions) CANE Rev.3 Cod CAEN Rev. 2 Anii Ian. Jan. Febr. Feb. Mar. March Apr. April Mai May Iun. June T INDUSTRIE – TOTAL 2012 Total 109,81 110,49 111,03 111,86 112,06 112,22 108,94 109,52 109,95 110,61 110,53 110,66 111,55 112,44 113,19 114,37 115,11 115,32 2013 Total 116,07 116,46 116,04 116,26 116,68 116,44 115,69 116,02 115,24 B 2012 Total 107,61 107,23 106,43 106,18 106,62 107,64 107,49 107,09 106,26 106,00 106,44 107,46 119,25 120,27 122,14 123,44 123,10 124,77 2013 Total 108,01 110,14 108,78 107,80 109,93 108,54 127,96 130,04 131,12 5 2012 Total 105,31 110,89 111,00 110,57 111,56 111,78 105,31 110,89 111,00 110,57 111,56 111,78 - - - - - - 2013 Total 115,00 118,06 116,05 115,00 118,06 116,05 - - - 6 2012 Total 103,47 103,83 103,12 103,49 103,49 105,17 103,47 103,83 103,12 103,49 103,49 105,17 - - - - - - 2013 Total 106,20 109,22 107,02 106,20 109,22 107,02 - - - 7 2012 Total c c c c c c c c c c c c - - - - - - 2013 Total c c c c c c - - - 8 2012 Total 105,95 105,55 106,28 106,28 106,02 106,41 105,09 104,60 105,26 105,17 104,92 105,22 119,25 120,27 122,14 123,44 123,10 124,77 2013 Total 108,46 108,65 108,05 107,20 107,27 106,56 127,96 130,04 131,12 9 2012 Total 120,22 117,28 115,06 112,78 115,67 117,41 120,22 117,28 115,06 112,78 115,67 117,41 - - - - - - 2013 Total 111,77 112,12 111,82 111,77 112,12 111,82 - - - C 2012 Total 110,65 111,43 112,22 113,06 113,53 113,72 109,99 110,68 111,50 112,09 112,36 112,56 111,55 112,45 113,20 114,39 115,13 115,29 2013 Total 116,04 116,27 115,83 116,25 116,40 116,18 115,75 116,09 115,36 10 2012 Total 112,86 113,92 113,70 114,36 114,83 115,71 113,06 114,15 113,93 114,55 114,95 115,81 109,25 109,77 109,60 110,86 112,65 113,93 2013 Total 126,95 125,77 125,34 127,44 126,17 125,74 118,18 118,55 118,19 Data for 2012 have been recalculated as a result of changing the base year and weighting system. Datele pentru luna februarie 2013 sunt rectificate, iar datele pentru luna martie 2013 sunt provizorii. The data for February 2013 are rectified and the data for March 2013 are provisional. 46 Iul. July. Aug. Aug. Sept. Sept. Oct. Oct. Noi. Noi. Dec. Dec. Market Years Activities (divisions) 2010 = 100 Co<strong>de</strong> CANE Rev. 2 113,12 114,12 114,71 115,48 115,02 114,84 Total 2012 INDUSTRY – TOTAL T 111,64 112,88 113,62 114,32 114,08 114,03 Domestic 116,08 116,59 116,88 117,80 116,89 116,46 Non-domestic Total Domestic Non-domestic 2013 108,83 109,67 109,16 108,90 108,83 107,67 Total 2012 Mining and quarrying B 108,66 109,51 108,98 108,71 108,63 107,43 Domestic 124,99 124,43 126,30 126,46 127,21 130,32 Non-domestic Total Domestic Non-domestic 2013 111,90 114,59 113,08 112,28 112,28 112,94 Total 2012 Mining of coal and lignite 5 111,90 114,59 113,08 112,28 112,28 112,94 Domestic - - - - - - Non-domestic Total Domestic Non-domestic 2013 106,42 107,47 106,34 106,13 106,51 105,50 Total 2012 Extraction of cru<strong>de</strong> petroleum 6 106,42 107,47 106,34 106,13 106,51 105,50 Domestic and natural gas - - - - - - Non-domestic Total Domestic Non-domestic 2013 c c c c c c Total 2012 Mining of metal ores 7 c c c c c c Domestic - - - - - - Non-domestic Total Domestic Non-domestic 2013 106,15 106,16 106,72 108,01 107,90 108,14 Total 2012 Other mining and quarrying 8 104,93 104,98 105,46 106,82 106,65 106,71 Domestic 124,99 124,43 126,30 126,46 127,21 130,32 Non-domestic Total Domestic Non-domestic 2013 120,32 120,36 118,61 117,44 115,57 111,31 Total 2012 Mining support service 9 120,32 120,36 118,61 117,44 115,57 111,31 Domestic activities - - - - - - Non-domestic Total Domestic Non-domestic 2013 114,45 115,59 116,35 117,20 116,60 116,47 Total 2012 Manufacturing C 113,28 114,87 115,94 116,75 116,38 116,46 Domestic 116,05 116,57 116,90 117,81 116,91 116,48 Non-domestic Total Domestic Non-domestic 2013 117,31 121,37 125,01 126,45 126,67 126,84 Total 2012 Manufacture of food 10 117,44 121,66 125,41 126,88 127,14 127,32 Domestic products 114,97 116,13 117,79 118,76 118,13 118,14 Non-domestic Total Domestic Non-domestic 2013 47