buletin statistic de preţuri prices statistical bulletin - Institutul National ...
buletin statistic de preţuri prices statistical bulletin - Institutul National ...
buletin statistic de preţuri prices statistical bulletin - Institutul National ...

You also want an ePaper? Increase the reach of your titles
YUMPU automatically turns print PDFs into web optimized ePapers that Google loves.
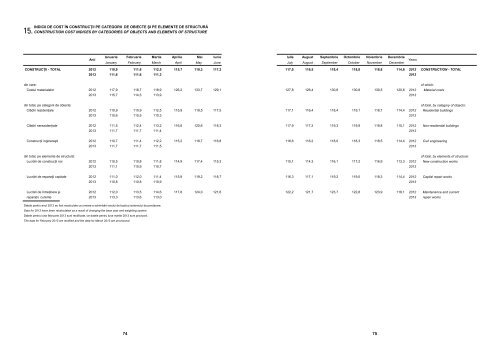
15.<br />
<br />
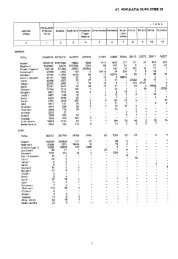
CONSTRUCTION COST INDICES BY CATEGORIES OF OBJECTS AND ELEMENTS OF STRUCTURE<br />
Anii<br />
Ianuarie Februarie Martie Aprilie Mai Iunie<br />
January February March April May June<br />
2012 110,9 111,6 112,5 115,7 119,3 117,2<br />
2013 111,6 111,6 111,3<br />
din care:<br />
Costul materialelor 2012 117,9 118,7 118,9 126,2 133,7 129,1<br />
2013 115,7 114,5 113,9<br />
din total, pe categorii <strong>de</strong> obiecte:<br />
2012 110,9 110,9 112,5 115,9 119,5 117,5<br />
2013 110,6 110,5 110,3<br />
2012 111,5 112,4 113,2 116,8 120,6 118,3<br />
2013 111,7 111,7 111,4<br />
2012 110,7 111,4 112,2 115,2 118,7 116,8<br />
2013 111,7 111,7 111,5<br />
<br />
2012 110,5 110,8 111,8 114,9 117,4 115,3<br />
2013 111,1 110,9 110,7<br />
2012 111,0 112,0 111,4 115,9 119,2 118,7<br />
2013 110,8 110,8 110,9<br />
2012 112,0 113,5 114,6 117,8 124,0 121,6<br />
2013 113,3 113,6 113,0<br />
<br />
Data for 2012 have been recalculated as a result of changing the base year and weighting system.<br />
Datele pentru luna februarie 2013 sunt rectificate, iar datele pentru luna martie 2013 sunt provizorii.<br />
The data for February 2013 are rectified and the data for March 2013 are provisional.<br />
74<br />
Iulie August Septembrie Octombrie Noiembrie Decembrie<br />
Years<br />
July August September October November December<br />
117,0 116,5 118,4 118,8 118,8 114,6 2012<br />
2013<br />
CONSTRUCTION - TOTAL<br />
127,8 126,4 130,8 130,8 130,5 120,6 2012<br />
2013<br />
of which:<br />
Material costs<br />
117,1 116,4 118,4 119,1 118,7 114,4 2012<br />
2013<br />
of total, by category of objects:<br />
Resi<strong>de</strong>ntial buildings<br />
117,9 117,2 119,3 119,9 119,8 115,1 2012<br />
2013<br />
Non-resi<strong>de</strong>ntial buildings<br />
116,6 116,2 118,0 118,3 118,5 114,4 2012<br />
2013<br />
Civil engineering<br />
115,1 114,3 116,1 117,2 116,9 113,3 2012<br />
2013<br />
of total, by elements of structure:<br />
New construction works<br />
116,3 117,1 119,2 119,0 118,3 114,4 2012<br />
2013<br />
Capital repair works<br />
122,2 121,7 123,7 122,8 123,9 118,1 2012 Maintenance and current<br />
2013 repair works<br />
75