

Schneider Electric Brand Standards Manual - Brand Platform ...
Schneider Electric Brand Standards Manual - Brand Platform ...
Schneider Electric Brand Standards Manual - Brand Platform ...

You also want an ePaper? Increase the reach of your titles
YUMPU automatically turns print PDFs into web optimized ePapers that Google loves.
Illustrations<br />
Version 2 | Released July 2009<br />
How to create technical and narrative illustrations<br />
1. Take a picture of the subject matter using a digital camera or choose an appropriate photograph to use as<br />
your guide. View the subject from an angle to give the illustration a sense of depth.<br />
2. Use a 30° angle when drawing the object.<br />
3. Import the image into a vector-based application.<br />
4. Use the Bezier tool to trace the outline of the image. Trace only the<br />
necessary detail.<br />
Note: Although the technical style is more detailed than narrative illustration, do not include every nut<br />
and bolt unless they are key to the product specification. Always retain the overall technical illustration<br />
style, irrespective of the product.<br />
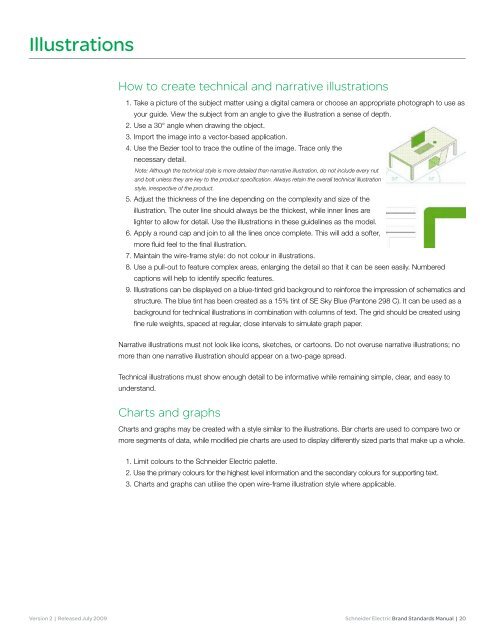
5. Adjust the thickness of the line depending on the complexity and size of the<br />
illustration. The outer line should always be the thickest, while inner lines are<br />
lighter to allow for detail. Use the illustrations in these guidelines as the model.<br />
6. Apply a round cap and join to all the lines once complete. This will add a softer,<br />
more fluid feel to the final illustration.<br />
7. Maintain the wire-frame style: do not colour in illustrations.<br />
8. Use a pull-out to feature complex areas, enlarging the detail so that it can be seen easily. Numbered<br />
captions will help to identify specific features.<br />
9. Illustrations can be displayed on a blue-tinted grid background to reinforce the impression of schematics and<br />
structure. The blue tint has been created as a 15% tint of SE Sky Blue (Pantone 298 C). It can be used as a<br />
background for technical illustrations in combination with columns of text. The grid should be created using<br />
fine rule weights, spaced at regular, close intervals to simulate graph paper.<br />
Narrative illustrations must not look like icons, sketches, or cartoons. Do not overuse narrative illustrations; no<br />
more than one narrative illustration should appear on a two-page spread.<br />
Technical illustrations must show enough detail to be informative while remaining simple, clear, and easy to<br />
understand.<br />
Charts and graphs<br />
Charts and graphs may be created with a style similar to the illustrations. Bar charts are used to compare two or<br />
more segments of data, while modified pie charts are used to display differently sized parts that make up a whole.<br />
1. Limit colours to the <strong>Schneider</strong> <strong>Electric</strong> palette.<br />
2. Use the primary colours for the highest level information and the secondary colours for supporting text.<br />
3. Charts and graphs can utilise the open wire-frame illustration style where applicable.<br />
<strong>Schneider</strong> <strong>Electric</strong> <strong>Brand</strong> <strong>Standards</strong> <strong>Manual</strong> | 20