analysis of criminal and financial details of candidates and mlas ...
analysis of criminal and financial details of candidates and mlas ...
analysis of criminal and financial details of candidates and mlas ...

You also want an ePaper? Increase the reach of your titles
YUMPU automatically turns print PDFs into web optimized ePapers that Google loves.
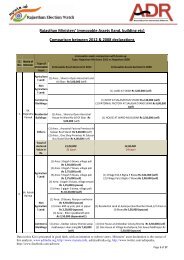
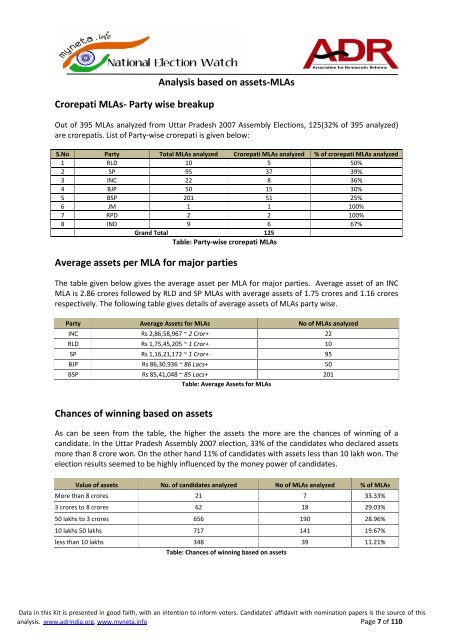
Crorepati MLAs- Party wise breakup<br />
Analysis based on assets-MLAs<br />
Out <strong>of</strong> 395 MLAs analyzed from Uttar Pradesh 2007 Assembly Elections, 125(32% <strong>of</strong> 395 analyzed)<br />
are crorepatis. List <strong>of</strong> Party-wise crorepati is given below:<br />
S.No Party Total MLAs analyzed Crorepati MLAs analyzed % <strong>of</strong> crorepati MLAs analyzed<br />
1 RLD 10 5 50%<br />
2 SP 95 37 39%<br />
3 INC 22 8 36%<br />
4 BJP 50 15 30%<br />
5 BSP 201 51 25%<br />
6 JM 1 1 100%<br />
7 RPD 2 2 100%<br />
8 IND 9 6 67%<br />
Gr<strong>and</strong> Total 125<br />
Table: Party-wise crorepati MLAs<br />
Average assets per MLA for major parties<br />
The table given below gives the average asset per MLA for major parties. Average asset <strong>of</strong> an INC<br />
MLA is 2.86 crores followed by RLD <strong>and</strong> SP MLAs with average assets <strong>of</strong> 1.75 crores <strong>and</strong> 1.16 crores<br />
respectively. The following table gives <strong>details</strong> <strong>of</strong> average assets <strong>of</strong> MLAs party wise.<br />
Party Average Assets for MLAs No <strong>of</strong> MLAs analyzed<br />
INC Rs 2,86,58,967 ~ 2 Cror+ 22<br />
RLD Rs 1,75,45,205 ~ 1 Cror+ 10<br />
SP Rs 1,16,21,172 ~ 1 Cror+ 95<br />
BJP Rs 86,30,936 ~ 86 Lacs+ 50<br />
BSP Rs 85,41,048 ~ 85 Lacs+ 201<br />
Table: Average Assets for MLAs<br />
Chances <strong>of</strong> winning based on assets<br />
As can be seen from the table, the higher the assets the more are the chances <strong>of</strong> winning <strong>of</strong> a<br />
c<strong>and</strong>idate. In the Uttar Pradesh Assembly 2007 election, 33% <strong>of</strong> the c<strong>and</strong>idates who declared assets<br />
more than 8 crore won. On the other h<strong>and</strong> 11% <strong>of</strong> c<strong>and</strong>idates with assets less than 10 lakh won. The<br />
election results seemed to be highly influenced by the money power <strong>of</strong> c<strong>and</strong>idates.<br />
Value <strong>of</strong> assets No. <strong>of</strong> c<strong>and</strong>idates analyzed No <strong>of</strong> MLAs analyzed % <strong>of</strong> MLAs<br />
More than 8 crores 21 7 33.33%<br />
3 crores to 8 crores 62 18 29.03%<br />
50 lakhs to 3 crores 656 190 28.96%<br />
10 lakhs 50 lakhs 717 141 19.67%<br />
less than 10 lakhs 348 39 11.21%<br />
Table: Chances <strong>of</strong> winning based on assets<br />
Data in this Kit is presented in good faith, with an intention to inform voters. C<strong>and</strong>idates' affidavit with nomination papers is the source <strong>of</strong> this<br />
<strong>analysis</strong>. www.adrindia.org, www.myneta.info Page 7 <strong>of</strong> 110