Annual Report 2009 on Form 20-F (PDF) - Deutsche Bank Annual ...
Annual Report 2009 on Form 20-F (PDF) - Deutsche Bank Annual ...
Annual Report 2009 on Form 20-F (PDF) - Deutsche Bank Annual ...

Create successful ePaper yourself
Turn your PDF publications into a flip-book with our unique Google optimized e-Paper software.
<strong>20</strong>-F Item 5: Operating and Financial Review and Prospects<br />
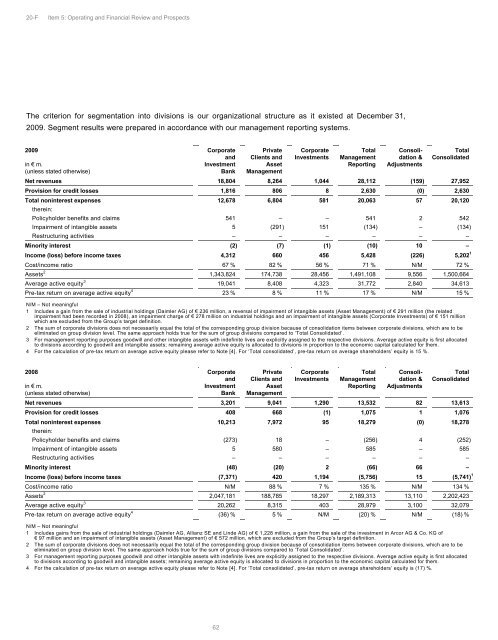
The criteri<strong>on</strong> for segmentati<strong>on</strong> into divisi<strong>on</strong>s is our organizati<strong>on</strong>al structure as it existed at December 31,<br />
<str<strong>on</strong>g><strong>20</strong>09</str<strong>on</strong>g>. Segment results were prepared in accordance with our management reporting systems.<br />
<str<strong>on</strong>g><strong>20</strong>09</str<strong>on</strong>g> Corporate<br />
in € m.<br />
(unless stated otherwise)<br />
and<br />
Investment<br />
<strong>Bank</strong><br />
N/M – Not meaningful<br />
1 Includes a gain from the sale of industrial holdings (Daimler AG) of € 236 milli<strong>on</strong>, a reversal of impairment of intangible assets (Asset Management) of € 291 milli<strong>on</strong> (the related<br />
impairment had been recorded in <strong>20</strong>08), an impairment charge of € 278 milli<strong>on</strong> <strong>on</strong> industrial holdings and an impairment of intangible assets (Corporate Investments) of € 151 milli<strong>on</strong><br />
which are excluded from the Group’s target definiti<strong>on</strong>.<br />
2 The sum of corporate divisi<strong>on</strong>s does not necessarily equal the total of the corresp<strong>on</strong>ding group divisi<strong>on</strong> because of c<strong>on</strong>solidati<strong>on</strong> items between corporate divisi<strong>on</strong>s, which are to be<br />
eliminated <strong>on</strong> group divisi<strong>on</strong> level. The same approach holds true for the sum of group divisi<strong>on</strong>s compared to ‘Total C<strong>on</strong>solidated’.<br />
3 For management reporting purposes goodwill and other intangible assets with indefinite lives are explicitly assigned to the respective divisi<strong>on</strong>s. Average active equity is first allocated<br />
to divisi<strong>on</strong>s according to goodwill and intangible assets; remaining average active equity is allocated to divisi<strong>on</strong>s in proporti<strong>on</strong> to the ec<strong>on</strong>omic capital calculated for them.<br />
4 For the calculati<strong>on</strong> of pre-tax return <strong>on</strong> average active equity please refer to Note [4]. For ‘Total c<strong>on</strong>solidated’, pre-tax return <strong>on</strong> average shareholders’ equity is 15 %.<br />
N/M – Not meaningful<br />
1 Includes gains from the sale of industrial holdings (Daimler AG, Allianz SE and Linde AG) of € 1,228 milli<strong>on</strong>, a gain from the sale of the investment in Arcor AG & Co. KG of<br />
€ 97 milli<strong>on</strong> and an impairment of intangible assets (Asset Management) of € 572 milli<strong>on</strong>, which are excluded from the Group’s target definiti<strong>on</strong>.<br />
2 The sum of corporate divisi<strong>on</strong>s does not necessarily equal the total of the corresp<strong>on</strong>ding group divisi<strong>on</strong> because of c<strong>on</strong>solidati<strong>on</strong> items between corporate divisi<strong>on</strong>s, which are to be<br />
eliminated <strong>on</strong> group divisi<strong>on</strong> level. The same approach holds true for the sum of group divisi<strong>on</strong>s compared to ‘Total C<strong>on</strong>solidated’.<br />
3 For management reporting purposes goodwill and other intangible assets with indefinite lives are explicitly assigned to the respective divisi<strong>on</strong>s. Average active equity is first allocated<br />
to divisi<strong>on</strong>s according to goodwill and intangible assets; remaining average active equity is allocated to divisi<strong>on</strong>s in proporti<strong>on</strong> to the ec<strong>on</strong>omic capital calculated for them.<br />
4 For the calculati<strong>on</strong> of pre-tax return <strong>on</strong> average active equity please refer to Note [4]. For ‘Total c<strong>on</strong>solidated’, pre-tax return <strong>on</strong> average shareholders’ equity is (17) %.<br />
62<br />
Private<br />
Clients and<br />
Asset<br />
Management<br />
Corporate<br />
Investments<br />
Total<br />
Management<br />
<str<strong>on</strong>g>Report</str<strong>on</strong>g>ing<br />
C<strong>on</strong>solidati<strong>on</strong><br />
&<br />
Adjustments<br />
Total<br />
C<strong>on</strong>solidated<br />
Net revenues 18,804 8,264 1,044 28,112 (159) 27,952<br />
Provisi<strong>on</strong> for credit losses 1,816 806 8 2,630 (0) 2,630<br />
Total n<strong>on</strong>interest expenses<br />
therein:<br />
12,678 6,804 581 <strong>20</strong>,063 57 <strong>20</strong>,1<strong>20</strong><br />
Policyholder benefits and claims 541 – – 541 2 542<br />
Impairment of intangible assets 5 (291) 151 (134) – (134)<br />
Restructuring activities – – – – – –<br />
Minority interest (2) (7) (1) (10) 10 –<br />
Income (loss) before income taxes 4,312 660 456 5,428 (226) 5,<strong>20</strong>2 1<br />
Cost/income ratio 67 % 82 % 56 % 71 % N/M 72 %<br />
Assets2 1,343,824 174,738 28,456 1,491,108 9,556 1,500,664<br />
Average active equity3 19,041 8,408 4,323 31,772 2,840 34,613<br />
Pre-tax return <strong>on</strong> average active equity4 23 % 8 % 11 % 17 % N/M 15 %<br />
<strong>20</strong>08 Corporate<br />
in € m.<br />
(unless stated otherwise)<br />
and<br />
Investment<br />
<strong>Bank</strong><br />
Private<br />
Clients and<br />
Asset<br />
Management<br />
Corporate<br />
Investments<br />
Total<br />
Management<br />
<str<strong>on</strong>g>Report</str<strong>on</strong>g>ing<br />
C<strong>on</strong>solidati<strong>on</strong><br />
&<br />
Adjustments<br />
Total<br />
C<strong>on</strong>solidated<br />
Net revenues 3,<strong>20</strong>1 9,041 1,290 13,532 82 13,613<br />
Provisi<strong>on</strong> for credit losses 408 668 (1) 1,075 1 1,076<br />
Total n<strong>on</strong>interest expenses<br />
therein:<br />
10,213 7,972 95 18,279 (0) 18,278<br />
Policyholder benefits and claims (273) 18 – (256) 4 (252)<br />
Impairment of intangible assets 5 580 – 585 – 585<br />
Restructuring activities – – – – – –<br />
Minority interest (48) (<strong>20</strong>) 2 (66) 66 –<br />
Income (loss) before income taxes (7,371) 4<strong>20</strong> 1,194 (5,756) 15 (5,741) 1<br />
Cost/income ratio N/M 88 % 7 % 135 % N/M 134 %<br />
Assets2 2,047,181 188,785 18,297 2,189,313 13,110 2,<strong>20</strong>2,423<br />
Average active equity3 <strong>20</strong>,262 8,315 403 28,979 3,100 32,079<br />
Pre-tax return <strong>on</strong> average active equity4 (36) % 5 % N/M (<strong>20</strong>) % N/M (18) %