HW#1 - Statistics
HW#1 - Statistics
HW#1 - Statistics

You also want an ePaper? Increase the reach of your titles
YUMPU automatically turns print PDFs into web optimized ePapers that Google loves.
her than a quantitative<br />
are needed. The two<br />
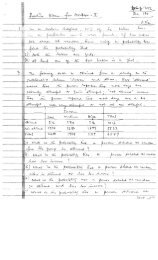
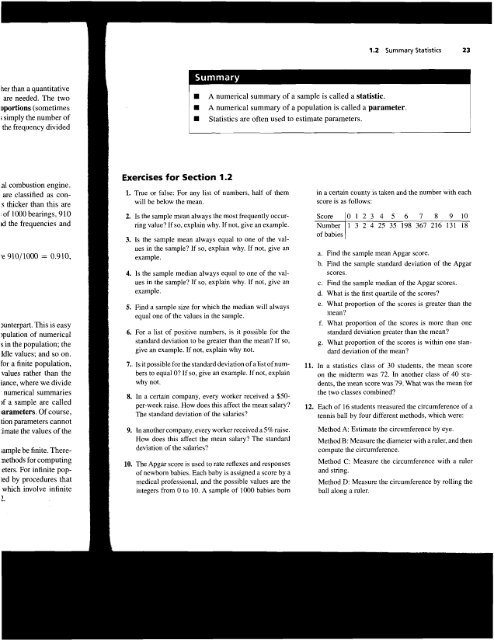
A numerical summary of a sample is called a statistic.<br />
oportions (sometimes A numerical summary of a population is called a parameter.<br />
; simply the number of<br />
the frequency divided<br />
<strong>Statistics</strong> are often used to estimate parameters.<br />
1.2 Summary <strong>Statistics</strong> 23<br />
.a1 combustion engine.<br />
Exercises for Section 1.2<br />
are classified as con- 1. True or false: For any list of numbers, half of them in a certain county is taken and the number with each<br />
.s thicker than this are will be below the mean. score is as follows:<br />
: of 1000 bearings, 9 10 2. Is the sample mean always the most frequently occur- Score 0 1 2 3 4 5 6 7 8 9 10<br />
~d the frequencies and ring value? If so, explain why. If not, give an example. Number 1 3 2 4 25 35 198 367 216 131 18<br />
of babies<br />
3. Is the sample mean always equal to one of the val-<br />
.e 910/1000 = 0.910,<br />
ues in the sample? If so, explain why. If not, give an<br />
a. Find the sample mean Apgar score.<br />
b. Find the sample standard deviation of the Apgar<br />
4. Is the sample median always equal to one of the val- scores.<br />
ues in the sample? If so, explain why. If not, give an c. Find the sample median of the Apgar scores.<br />
~unterpart. This is easy<br />
~pulation of numerical<br />
s in the population; the<br />
Mle values; and so on.<br />
5. Find a sample size for which the median will always<br />
equal one of the values in the sample.<br />
6. For a list of positive numbers, is it possible for the<br />
standard deviation to be greater than the mean? If so,<br />
give an example. If not, explain why not.<br />
d. What is the first quartile of the scores?<br />
e. What proportion of the scores is greater than the<br />
mean?<br />
f. What proportion of the scores is more than one<br />
standard deviation greater than the mean?<br />
g. What proportion of the scores is within one standard<br />
deviation of the mean?<br />
for a finite population,<br />
values rather than the<br />
7.. Is it possible for the standard deviation of a list of numbers<br />
to equal O? If so, give an example. If not, explain<br />
11. a statistics ,-lass of 30 students, the mean score<br />
on the midterm was 72. In another class of 40 stuiance,<br />
where we divide dents, the mean score was 79. What was the mean for<br />
numerical summaries<br />
)f a sample are called<br />
~arameters. Of course,<br />
tion parameters cannot<br />
8. In a certain company, every worker received a $50per-week<br />
raise. How does this affect the mean salary?<br />
The standard deviation of the salaries?<br />
the two classes combined?<br />
12. Each of 16 students measured the circumference of a<br />
tennis ball by four different methods, which were:<br />
:imate the values of the 9. In another company, every worker received a 5% raise. Method A: Estimate the circumference by eye.<br />
How does this affect the mean salary? The standard Method B: Measure the diameter with aruler, and then<br />
;ample be finite. There- deviation of the salaries? compute the circumference.<br />
nethods for computing<br />
eters. For infinite popted<br />
by procedures that<br />
which involve infinite<br />
2.<br />
10. The Apgar score is used to rate reflexes and responses<br />
of newborn babies. Each baby is assigned a score by a<br />
medical professional, and the possible values are the<br />
integers from 0 to 10. A sample of 1000 babies born<br />
Method C: Measure the circumference with a ruler<br />
and string.<br />
Method D: Measure the circumference by rolling the<br />
ball along a ruler.
24 CHAPTER 1 Sampling and Descriptive <strong>Statistics</strong><br />
The results (in cm) are as follows, in increasing order b. If the students remeasured the ball. using a ruler<br />
for each method: marked in inches, would the effects on the mean,<br />
Method A: 18.0, 18.0, 18.0, 20.0, 22.0, 22.0, 22.5,<br />
23.0. 24.0, 24.0, 25.0, 25.0, 25.0, 25.0, 26.0, 26.4.<br />
median, quartiles, and standard<br />
same as in part (a)? Explain.<br />
Method B: 18.8, 18.9, 18.9, 19.6, 20.1, 20.4, 20.4, 14. A list of lonumbers has a mean of 20, a median of 18,<br />
20.4. 20.4, 20.5, 21.2, 22.0, 22.0, 22.0, 22.0, 23.6.<br />
and a standard deviation of 5. The largest number on<br />
MethodC: 20.2, 20.5, 20.5, 20.7, 20.8, 20.9, 21.0,<br />
21.0, 21.0, 21.0, 21.0,21.5, 21.5, 21.5, 21.5,21.6.<br />
the list is 39.27. By accid<br />
to 392.7.<br />
Method D: 20.0, 20.0, 20.0, 20.0, 20.2, 20.5, 20.5,<br />
20.7, 20.7, 20.7, 21.0, 21.1, 21.5, 21.6, 22.1, 22.3.<br />
a. What is the value of the mean after the change?<br />
b. What is the value of the median after the change?<br />
c. What is the value of the standard deviation after<br />
a. Compute the mean measurement for each method. the change?<br />
b. Compute the median measurement for each<br />
method.<br />
c. Compute the 20% trimmed mean measurement for<br />
each method.<br />
15. Quartiles divide a sample into four ne<br />
'<br />
In general, a sample of r '<br />
nearly equal pieces by usil., ...- --,<br />
for i = 1, . . . , k - 1. Consider the fuLLuwlLls ulur;lLu<br />
d. Compute the first and third quartiles for each sample:<br />
method. 2 18 23 41 44 46 49 61 62 74 76 79 82 89 92 95<br />
e. Compute the standard deviation of the measure- a. Tertiles divide a sample into thirds. Find the tertiles<br />
ments for each method. of this sample.<br />
f. For which method is the standard deviation the b. Quintiles divide a sample into fifths. Find the quin-<br />
largest? Why should one expect this method to tiles of this sample.<br />
have the largest standard deviation?<br />
or a larger standarddeviation? Or doesn't it matter? could conceivably be correct.<br />
I<br />
Explain. a. A rockis weighed five times. The readings in grams<br />
are 48.5,47.2,4.91.49.5,46.3.<br />
13. Refer to Exercise 12.<br />
b. A sociologist samples five fam<br />
a. If the measurements for one of the methods were<br />
town and records their annual<br />
converted to inches (1 inch.= 2.54 cm), how would<br />
comes are $34,000, $S7 nM Q1<br />
this affect the mean? The median? The quartiles?<br />
$62,000.<br />
The standard deviation?<br />
I<br />
I<br />
I
1.3 Graphical Summaries 39<br />
itterplots can also be Exercises for Section 1.3<br />
ore than two values.<br />
~ts. The article "Ad-<br />
)perties of Titanium<br />
Journal, 2001 : 126sgth<br />
characteristics of<br />
Figure 1.17a is a plot<br />
rersus carbon content<br />
rength (in ksi) versus<br />
1. As part of a quality-control study aimed at improving<br />
aproduction line, the weights (in ounces) of 50 bars of<br />
soap are measured. The results are as follows, sorted<br />
from smallest to largest.<br />
11.6 12.6 12.7 12.8 13.1 13.3 13.6 13.7 13.8 14.1<br />
14.3 14.3 14.6 14.8 15.1 15.2 15.6 15.6 15.7 15.8<br />
15.8 15.9 15.9 16.1 16.2 16.2 16.3 16.4 16.5 16.5<br />
16.5 16.6 17.0 17.1 17.3 17.3 17.4 17.4 17.4 17.6<br />
17.7 18.1 18.3 18.3 18.3 18.5 18.5 18.8 19.2 20.3<br />
Method 1<br />
0.32<br />
0.35<br />
0.37<br />
0.39<br />
0.42<br />
0.47<br />
0.5 1<br />
0.58<br />
Method 2<br />
0.25<br />
0.40<br />
0.48<br />
0.55<br />
0.56<br />
0.58<br />
0.60<br />
0.65<br />
a. Construct a stem-and-leaf plot for these data.<br />
0.60<br />
0.62<br />
0.70<br />
0.76<br />
b. Construct a histogram for these data. 0.65 0.80<br />
I<br />
c. Construct a dotplot for these data.<br />
d. Construct a boxplot for these data. Does the box-<br />
0.68<br />
0.75<br />
0.91<br />
0.99<br />
plot show any outliers?<br />
2. Following is a list of the number of hazardous waste<br />
sites in each of the 50 states of the United States as<br />
of April 1995. The data are taken from The World<br />
Almanac and Book of Facts 1996 (World Almanac<br />
Books, Mahwah, NJ, 1996). The list has been sorted<br />
into numerical order.<br />
a. Construct a histogram for the results of each<br />
method.<br />
b. Construct comparative boxplots for the two<br />
methods.<br />
c. Using the boxplots, what differences can be seen<br />
between the results of the two methods?<br />
1 2 3 4 4 5 6 8 8 9<br />
10 10 10 11 11 11 12 12 12 12<br />
13 13 14 15 16 17 17 18 18 19<br />
19 20 22 23 24 25 29 30 33 37<br />
38 39 40 55 58 77 81 96 102 107<br />
5. Each of 32 students, comprised of two lab sections<br />
of 16 students each, estimated the circumference of<br />
a tennis ball by eye. The results, in centimeters, are<br />
given here. (The results for the first group of students<br />
also appear in Exercise 12 of Section 1.2.)<br />
tent (%)<br />
a. Construct a stem-and-leaf plot for these data. Group 1 Group 2<br />
arbon content and yield<br />
gher nitrogen content is<br />
b. Construct a histogram for these data.<br />
c. Construct a dotplot for these data.<br />
d. Construct a boxplot for these data. Does the box-<br />
18.0<br />
18.0<br />
18.0<br />
15.0<br />
18.0<br />
18.0<br />
plot show any outliers? 20.0<br />
22.0<br />
19.0<br />
19.0<br />
3. Refer toTable 1.2 (page 20). Construct a stem-and-leaf 22.0 19.0<br />
L7b) shows some clear<br />
.to upper right. In this<br />
d yield strength: Welds<br />
s scatterplot might lead<br />
plot with the ones digit as the stem (for values greater<br />
than or equal to 10 the stem will have two digits) and<br />
the tenths digit as the leaf. How many stems are there<br />
(be sure to include leafless stems)? What are some ad-<br />
22.5<br />
23.0<br />
24.0<br />
24.0<br />
25 .0<br />
19.0<br />
19.5<br />
20.0<br />
20.0<br />
20.0<br />
try to increase nitrogen<br />
p on a scatterplot does<br />
liscuss in Section 7.1 .)<br />
erplot of yield strength<br />
ship between these two<br />
vantages and disadvantages of this plot, compared to<br />
the one in Figure 1.6 (page 26)?<br />
4. Two methods were studied for the recovery of protein.<br />
Thirteen runs were made using each method, and the<br />
fraction of protein recovered was recorded for each<br />
25 .O<br />
25 .O<br />
25 .O<br />
26.0<br />
26.4<br />
20.0<br />
20.0<br />
22.0<br />
24.0<br />
25 .O<br />
ying to predict strength run. The results are as follows: