Homework 2 - Statistics
Homework 2 - Statistics
Homework 2 - Statistics

Create successful ePaper yourself
Turn your PDF publications into a flip-book with our unique Google optimized e-Paper software.
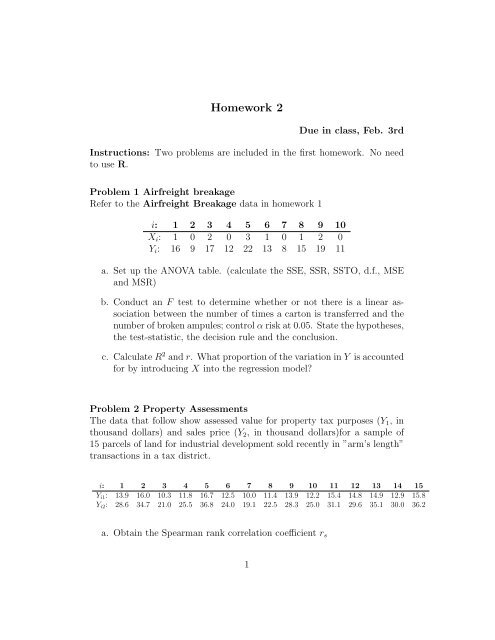
<strong>Homework</strong> 2<br />
Due in class, Feb. 3rd<br />
Instructions: Two problems are included in the first homework. No need<br />
to use R.<br />
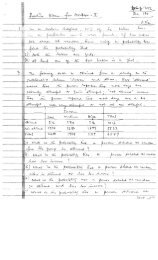
Problem 1 Airfreight breakage<br />
Refer to the Airfreight Breakage data in homework 1<br />
i: 1 2 3 4 5 6 7 8 9 10<br />
Xi: 1 0 2 0 3 1 0 1 2 0<br />
Yi: 16 9 17 12 22 13 8 15 19 11<br />
a. Set up the ANOVA table. (calculate the SSE, SSR, SSTO, d.f., MSE<br />
and MSR)<br />
b. Conduct an F test to determine whether or not there is a linear association<br />
between the number of times a carton is transferred and the<br />
number of broken ampules; control α risk at 0.05. State the hypotheses,<br />
the test-statistic, the decision rule and the conclusion.<br />
c. Calculate R 2 and r. What proportion of the variation in Y is accounted<br />
for by introducing X into the regression model?<br />
Problem 2 Property Assessments<br />
The data that follow show assessed value for property tax purposes (Y1, in<br />
thousand dollars) and sales price (Y2, in thousand dollars)for a sample of<br />
15 parcels of land for industrial development sold recently in ”arm’s length”<br />
transactions in a tax district.<br />
i: 1 2 3 4 5 6 7 8 9 10 11 12 13 14 15<br />
Yi1: 13.9 16.0 10.3 11.8 16.7 12.5 10.0 11.4 13.9 12.2 15.4 14.8 14.9 12.9 15.8<br />
Yi2: 28.6 34.7 21.0 25.5 36.8 24.0 19.1 22.5 28.3 25.0 31.1 29.6 35.1 30.0 36.2<br />
a. Obtain the Spearman rank correlation coefficient rs<br />
1
. Test by means of the Spearman rank correlation coefficient whether an<br />
association exists between property assessments and sales prices using<br />
test statistic t ∗ with α = 0.01. State the hypotheses, the test-statistic,<br />
the decision rule and the conclusion.<br />
2