STA 106: Midterm – Solutions - Statistics
STA 106: Midterm – Solutions - Statistics
STA 106: Midterm – Solutions - Statistics

You also want an ePaper? Increase the reach of your titles
YUMPU automatically turns print PDFs into web optimized ePapers that Google loves.
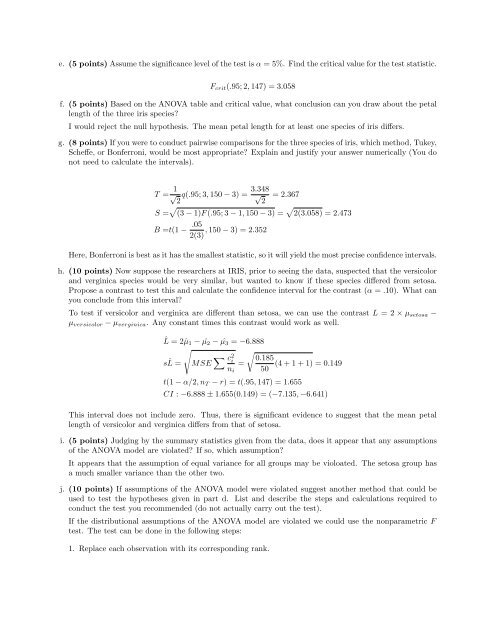
e. (5 points) Assume the significance level of the test is α = 5%. Find the critical value for the test statistic.<br />
Fcrit(.95; 2, 147) = 3.058<br />
f. (5 points) Based on the ANOVA table and critical value, what conclusion can you draw about the petal<br />
length of the three iris species?<br />
I would reject the null hypothesis. The mean petal length for at least one species of iris differs.<br />
g. (8 points) If you were to conduct pairwise comparisons for the three species of iris, which method, Tukey,<br />
Scheffe, or Bonferroni, would be most appropriate? Explain and justify your answer numerically (You do<br />
not need to calculate the intervals).<br />
T = 1<br />
√ 2 q(.95; 3, 150 − 3) = 3.348<br />
√ 2 = 2.367<br />
S = (3 − 1)F (.95; 3 − 1, 150 − 3) = 2(3.058) = 2.473<br />
B =t(1 − .05<br />
, 150 − 3) = 2.352<br />
2(3)<br />
Here, Bonferroni is best as it has the smallest statistic, so it will yield the most precise confidence intervals.<br />
h. (10 points) Now suppose the researchers at IRIS, prior to seeing the data, suspected that the versicolor<br />
and verginica species would be very similar, but wanted to know if these species differed from setosa.<br />
Propose a contrast to test this and calculate the confidence interval for the contrast (α = .10). What can<br />
you conclude from this interval?<br />
To test if versicolor and verginica are different than setosa, we can use the contrast L = 2 × µsetosa −<br />
µversicolor − µverginica. Any constant times this contrast would work as well.<br />
ˆL = 2ˆµ1 − ˆµ2 − ˆµ3 = −6.888<br />
sˆ <br />
L = MSE c2 <br />
i 0.185<br />
= (4 + 1 + 1) = 0.149<br />
ni 50<br />
t(1 − α/2, nT − r) = t(.95, 147) = 1.655<br />
CI : −6.888 ± 1.655(0.149) = (−7.135, −6.641)<br />
This interval does not include zero. Thus, there is significant evidence to suggest that the mean petal<br />
length of versicolor and verginica differs from that of setosa.<br />
i. (5 points) Judging by the summary statistics given from the data, does it appear that any assumptions<br />
of the ANOVA model are violated? If so, which assumption?<br />
It appears that the assumption of equal variance for all groups may be violoated. The setosa group has<br />
a much smaller variance than the other two.<br />
j. (10 points) If assumptions of the ANOVA model were violated suggest another method that could be<br />
used to test the hypotheses given in part d. List and describe the steps and calculations required to<br />
conduct the test you recommended (do not actually carry out the test).<br />
If the distributional assumptions of the ANOVA model are violated we could use the nonparametric F<br />
test. The test can be done in the following steps:<br />
1. Replace each observation with its corresponding rank.