William P. Jarrett Middle School - ARCH
William P. Jarrett Middle School - ARCH
William P. Jarrett Middle School - ARCH

Create successful ePaper yourself
Turn your PDF publications into a flip-book with our unique Google optimized e-Paper software.
<strong>School</strong> Code:<br />
<strong>William</strong> P. <strong>Jarrett</strong> <strong>Middle</strong> <strong>School</strong><br />
<strong>School</strong> Status and Improvement Report <strong>School</strong> Year 2011-12<br />
Focus on<br />
Standards<br />
<strong>School</strong><br />
Description<br />
Contents<br />
<strong>School</strong> Setting<br />
Student Profile<br />
Community Profile<br />
<strong>School</strong><br />
Improvement<br />
Summary of<br />
Progress<br />
<strong>School</strong> Resources<br />
Certified Staff<br />
Facilities<br />
Vital Signs<br />
•<br />
•<br />
•<br />
•<br />
•<br />
•<br />
•<br />
•<br />
•<br />
•<br />
<strong>School</strong> Quality<br />
Survey<br />
Student Conduct<br />
<strong>School</strong><br />
Retention or<br />
Completion<br />
Hawaii State Assessment<br />
Program<br />
<strong>School</strong> Address:<br />
110<br />
p. 1<br />
p. 1<br />
pp. 2-3<br />
p. 4<br />
p. 5<br />
pp. 6-8<br />
Other <strong>School</strong> Information<br />
<strong>William</strong> P. <strong>Jarrett</strong> <strong>Middle</strong> <strong>School</strong><br />
1903 Palolo Avenue<br />
Honolulu, Hawaii 96816<br />
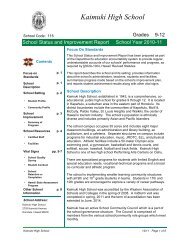
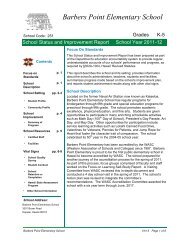
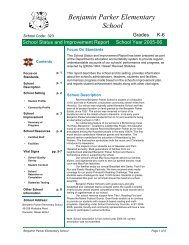
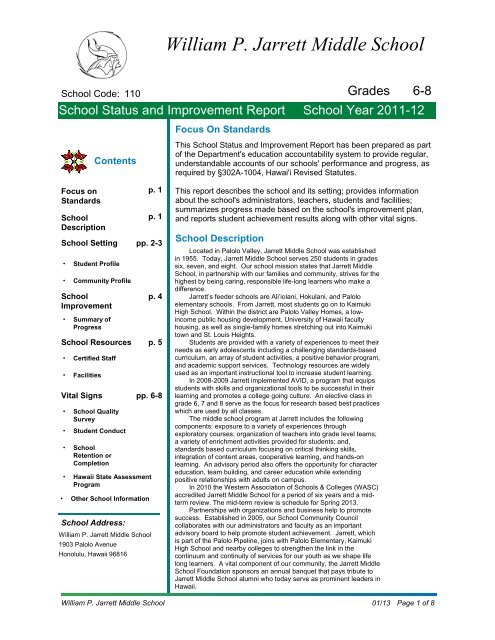
Focus On Standards<br />
This <strong>School</strong> Status and Improvement Report has been prepared as part<br />
of the Department's education accountability system to provide regular,<br />
understandable accounts of our schools' performance and progress, as<br />
required by §302A-1004, Hawai'i Revised Statutes.<br />
This report describes the school and its setting; provides information<br />
about the school's administrators, teachers, students and facilities;<br />
summarizes progress made based on the school's improvement plan,<br />
and reports student achievement results along with other vital signs.<br />
<strong>School</strong> Description<br />
Grades<br />
Located in Palolo Valley, <strong>Jarrett</strong> <strong>Middle</strong> <strong>School</strong> was established<br />
in 1955. Today, <strong>Jarrett</strong> <strong>Middle</strong> <strong>School</strong> serves 250 students in grades<br />
six, seven, and eight. Our school mission states that <strong>Jarrett</strong> <strong>Middle</strong><br />
<strong>School</strong>, in partnership with our families and community, strives for the<br />
highest by being caring, responsible life-long learners who make a<br />
difference.<br />
<strong>Jarrett</strong>’s feeder schools are Ali’iolani, Hokulani, and Palolo<br />
elementary schools. From <strong>Jarrett</strong>, most students go on to Kaimuki<br />
High <strong>School</strong>. Within the district are Palolo Valley Homes, a lowincome<br />
public housing development, University of Hawaii faculty<br />
housing, as well as single-family homes stretching out into Kaimuki<br />
town and St. Louis Heights.<br />
Students are provided with a variety of experiences to meet their<br />
needs as early adolescents including a challenging standards-based<br />
curriculum, an array of student activities, a positive behavior program,<br />
and academic support services. Technology resources are widely<br />
used as an important instructional tool to increase student learning.<br />
In 2008-2009 <strong>Jarrett</strong> implemented AVID, a program that equips<br />
students with skills and organizational tools to be successful in their<br />
learning and promotes a college going culture. An elective class in<br />
grade 6, 7 and 8 serve as the focus for research based best practices<br />
which are used by all classes.<br />
The middle school program at <strong>Jarrett</strong> includes the following<br />
components: exposure to a variety of experiences through<br />
exploratory courses; organization of teachers into grade level teams;<br />
a variety of enrichment activities provided for students; and,<br />
standards based curriculum focusing on critical thinking skills,<br />
integration of content areas, cooperative learning, and hands-on<br />
learning. An advisory period also offers the opportunity for character<br />
education, team building, and career education while extending<br />
positive relationships with adults on campus.<br />
In 2010 the Western Association of <strong>School</strong>s & Colleges (WASC)<br />
accredited <strong>Jarrett</strong> <strong>Middle</strong> <strong>School</strong> for a period of six years and a midterm<br />
review. The mid-term review is schedule for Spring 2013.<br />
Partnerships with organizations and business help to promote<br />
success. Established in 2005, our <strong>School</strong> Community Council<br />
collaborates with our administrators and faculty as an important<br />
advisory board to help promote student achievement. <strong>Jarrett</strong>, which<br />
is part of the Palolo Pipeline, joins with Palolo Elementary, Kaimuki<br />
High <strong>School</strong> and nearby colleges to strengthen the link in the<br />
continuum and continuity of services for our youth as we shape life<br />
long learners. A vital component of our community, the <strong>Jarrett</strong> <strong>Middle</strong><br />
<strong>School</strong> Foundation sponsors an annual banquet that pays tribute to<br />
<strong>Jarrett</strong> <strong>Middle</strong> <strong>School</strong> alumni who today serve as prominent leaders in<br />
Hawaii.<br />
<strong>William</strong> P. <strong>Jarrett</strong> <strong>Middle</strong> <strong>School</strong> 01/13 Page 1 of 8<br />
6-8
<strong>School</strong> Status and Improvement Report<br />
Student Profile<br />
<strong>School</strong> year 2009-10 2010-11 2011-12<br />
Fall enrollment<br />
Number and percent of students<br />
enrolled for the entire school<br />
year<br />
Number and percent of students<br />
receiving free or reduced-cost<br />
lunch<br />
n = 244<br />
237<br />
238<br />
<strong>School</strong> Setting<br />
244<br />
<strong>School</strong> Year 2011-12<br />
227 211 234 Number and percent of students 50 49 59<br />
95.8% 88.7% 95.9% with limited English proficiency 21.1% 20.6% 24.2%<br />
170 175 161<br />
71.7% 73.5% 66.0%<br />
Number and percent of students<br />
in Special Education programs<br />
Student Ethnicity, <strong>School</strong> Year 2011-12<br />
Part-Hawaiian 0<br />
Native American 1<br />
Black 2<br />
Chinese 16<br />
Filipino 8<br />
Native Hawaiian 66<br />
Japanese 36<br />
Korean 1<br />
Portuguese 2<br />
Hispanic 3<br />
Samoan 16<br />
Indo-Chinese 18<br />
Micronesian 54<br />
Tongan 4<br />
Guamanian/Chamorro 0<br />
White 3<br />
White two or more 0<br />
Other Asian 2<br />
Other Pacific Islander 1<br />
Pacific Islander two or more 0<br />
Asian two or more 0<br />
Multiple, two or more 11<br />
0.4%<br />
0.8%<br />
6.6%<br />
3.3%<br />
27.0%<br />
14.8%<br />
0.4%<br />
0.8%<br />
1.2%<br />
6.6%<br />
1.6%<br />
1.2%<br />
0.8%<br />
0.4%<br />
7.4%<br />
4.5%<br />
22.1%<br />
0% 20% 40% 60% 80% 100%<br />
2009-10 2010-11 2011-12<br />
42 47 47<br />
17.7% 19.7% 19.3%<br />
<strong>William</strong> P. <strong>Jarrett</strong> <strong>Middle</strong> <strong>School</strong> 01/13<br />
Page 2 of 8
<strong>School</strong> Status and Improvement Report<br />
Community Profile<br />
<strong>School</strong> Setting<br />
<strong>School</strong> Year 2011-12<br />
The Community Profile information updated in this school report reflects selected 2010 demographics<br />
for the High <strong>School</strong> Complex (HSC) area in which this school resides. Profile data are based on the<br />
2010 U.S. Census, the American Community Survey (ACS) 2006-2010 five-year estimates (centric to<br />
2008), and incorporation of Hawaii’s HSC boundary areas with updated 2010 Census geography.<br />
Figures for educational attainment and median household income are sample estimates obtained from<br />
the ACS, adapted to conform to HSC geography, and should be considered rough approximations of<br />
census counts.<br />
Kaimuki HSC Complex<br />
Total population<br />
Percentage of population aged 5-19<br />
Median age of population<br />
Number of family households<br />
Median household income<br />
Community Educational Attainment Level<br />
College<br />
Graduate<br />
Some College<br />
High <strong>School</strong><br />
Less than High<br />
<strong>School</strong><br />
Graduate<br />
8.5%<br />
10.2%<br />
24.9%<br />
29.4%<br />
30.3%<br />
31.4%<br />
29.0%<br />
36.3%<br />
0% 10% 20% 30% 40% 50% 60%<br />
State of Haw ai`i <strong>School</strong> Community<br />
Based on the 2010 U.S. Census and<br />
American Community Survey (ACS)<br />
<strong>School</strong><br />
Community<br />
84,204<br />
12.7%<br />
40.8<br />
17,984<br />
$55,311<br />
State of<br />
Hawai`i<br />
1,360,301<br />
18.4%<br />
38.6<br />
313,907<br />
$66,420<br />
<strong>William</strong> P. <strong>Jarrett</strong> <strong>Middle</strong> <strong>School</strong> 01/13<br />
Page 3 of 8
<strong>School</strong> Status and Improvement Report<br />
Summary of Progress<br />
<strong>School</strong> Improvement<br />
<strong>School</strong> Year 2011-12<br />
<strong>Jarrett</strong> <strong>Middle</strong> <strong>School</strong>’s Academic and Financial Plan focused on preparing all students to be college,<br />
career, and life ready through effective use of Standards-Based Education, sustaining a rich environment<br />
and culture for life-long learners, and continuous improvement of the educational system. Every year we<br />
create an Academic Plan to meet the social, emotional, and educational needs of our students. As part of<br />
the plan we look closely at our school data to decide which enabling activities will make the biggest<br />
impact in helping our students achieve. Our plans are aligned to the Kaimuki Complex and State<br />
Strategic Plans.<br />
The following is a synopsis of the Enabling Activities for SY 2010-2011.<br />
Goal 1: Assure All Students Graduate College-And Career- Ready Through Effective Use of Standards-<br />
Based Instruction.<br />
• Reviewed curriculum goals to meet/exceed HSA benchmarks in Reading and Mathematics.<br />
• <strong>School</strong> wide implementation of Standards Based Curriculum and Assessment are in place.<br />
• Differentiated Instruction is implemented to meet all students’ needs and increase student<br />
achievement in all content areas.<br />
• Teachers engage in data teams. Data teams analyze data from the Hawaii State Assessment,<br />
Edison Monthly Benchmarks, DSI and other resources to drive school-wide decision making.<br />
• AVID strategies school wide. AVID elective classes for grades 6-8.<br />
Goal 2: Ensure and Sustain a Rich Environment and Culture for Life-Long Learners<br />
• Continue to provide technology in every classroom to serve as another means of differentiation.<br />
• Continue to provide afterschool programs. (All Stars, Uplink, 21 st Century Grant)<br />
• Analyze data of our Comprehensive Student Support process to better meet the specific needs of<br />
our students.<br />
• Procedures to address student behavior are in place and revised as needed.<br />
• Review and update the school Safety Plan and practice safety procedures with students and<br />
staff.<br />
Goal 3: Continuously Improve the Effectiveness, Efficiency, and Responsiveness of the Educational<br />
System.<br />
• The <strong>School</strong> Community Council, <strong>Jarrett</strong> Foundation, and the Parent Community Network<br />
Coordination are groups that work with the school community to encourage parent involvement<br />
and participation.<br />
• Continue to provide articulation opportunities with Kaimuki Complex feeder schools.<br />
• Provide teachers with Professional Development on Thinking Maps, Differentiated Instruction,<br />
AVID and Inclusion.<br />
The school continued to address the areas of improvement identified by the Western Association of<br />
<strong>School</strong>s and Colleges (WASC) from their visit in 2010. The school is preparing for a mid-term review in<br />
March 2013.<br />
<strong>William</strong> P. <strong>Jarrett</strong> <strong>Middle</strong> <strong>School</strong> 01/13<br />
Page 4 of 8
<strong>School</strong> Status and Improvement Report<br />
Certified Staff<br />
Teaching Staff<br />
Total Full-Time Equivalent (FTE)<br />
Regular Instruction, FTE<br />
Special Instruction, FTE<br />
Supplemental Instruction, FTE<br />
Teacher headcount<br />
Teachers with 5 or more years at this school<br />
Teachers' average years of experience<br />
Teachers with advanced degrees<br />
75.5%<br />
24.5%<br />
0.0%<br />
Professional Teacher Credentials<br />
Facilities<br />
Fully licensed<br />
Provisional credential<br />
Emergency credential<br />
100.0%<br />
0.0%<br />
0.0%<br />
Classrooms available 37<br />
Number of classrooms short (-) or over (+) 4<br />
<strong>School</strong> facilities inspection results<br />
<strong>School</strong> Year Ending 2012<br />
From the 2011 school year school facilities<br />
inspection data are no longer available at the state<br />
level. Department schools are still required to do an<br />
annual assessment of its facilities in the following<br />
areas: Grounds, Building exterior, Building interior,<br />
Equipment/Furnishings, Health/Safety and<br />
Sanitation. All department schools should have their<br />
annual inspections completed by the second quarter<br />
of the school year.<br />
Historically the majority of the department schools<br />
attained inspection assessment points in the<br />
following ranges, 9-15 earning a "Satisfactory" rating<br />
and 16-18 points earning the highest "Very Good"<br />
rating.<br />
<strong>School</strong> Resources<br />
24.5<br />
18.5<br />
6.0<br />
0.0<br />
25<br />
11<br />
12.5<br />
13<br />
25<br />
0<br />
0<br />
*<br />
Students per Teaching Staff<br />
Regular Instruction<br />
Special Instruction<br />
<strong>School</strong> Year 2011-12<br />
Administrative and Student Services Staff<br />
Administration, FTE *<br />
Librarians, FTE<br />
Counselors, FTE<br />
Number of principals at this school<br />
in the last five years<br />
10.6<br />
7.8<br />
* Regular instruction includes both regular and<br />
supplemental teaching staff and does not include<br />
mainstreamed special education students. Therefore,<br />
these figures do not indicate class size.<br />
4.0<br />
0.0<br />
2.0<br />
* Administration includes Principals, Vice-Principals,<br />
Student Activity Coordinators, Student Services<br />
Coordinators, Registrars, and Athletic Directors<br />
Administration<br />
Library<br />
Caf eteria/<br />
Auditorium<br />
Classrooms<br />
Adequacy of <strong>School</strong>'s Space<br />
86%<br />
100%<br />
433%<br />
302%<br />
0% 100% 200%<br />
<strong>School</strong> facilities are considered inadequate if below 70%; marginal if<br />
between 70% and 99%; and in excess of state standard if above<br />
100%. <strong>School</strong> population is placed into size categories and is used in<br />
formulas to determine State standards for space. Graph does not<br />
display capacity exceeding 200%.<br />
2<br />
State Standard<br />
<strong>William</strong> P. <strong>Jarrett</strong> <strong>Middle</strong> <strong>School</strong> 01/13<br />
Page 5 of 8
<strong>School</strong> Status and Improvement Report<br />
<strong>School</strong> Quality Survey<br />
Vital Signs<br />
<strong>School</strong> Year 2011-12<br />
The <strong>School</strong> Quality Survey (SQS), administered periodically by the System Evaluation and Reporting<br />
Section, is used for strategic planning and to comply with state accountability requirements.<br />
*<br />
<strong>School</strong> Quality Survey<br />
Dimensions<br />
Standards-Based Learning<br />
Quality Student Support<br />
Professionalism & System<br />
Capacity<br />
Coordinated Team Work<br />
Responsiveness of the System<br />
Focused & Sustained Action<br />
Involvement<br />
Satisfaction<br />
Student Safety & Well Being<br />
2011<br />
2012<br />
2011<br />
2012<br />
2011<br />
2012<br />
2011<br />
2012<br />
2011<br />
2012<br />
2011<br />
2012<br />
2011<br />
2012<br />
2011<br />
2012<br />
2011<br />
2012<br />
Percent of Positive Responses<br />
Teachers Parents Students<br />
<strong>School</strong> State <strong>School</strong> State <strong>School</strong> State<br />
-- --<br />
-- --<br />
--<br />
97.2% 97.1% 90.1% 82.8% 91.6%<br />
-- --<br />
-- --<br />
--<br />
89.1% 89.2% 87.6% 82.4% 86.5%<br />
--<br />
89.9%<br />
--<br />
90.0%<br />
-- --<br />
-- --<br />
--<br />
80.4% 85.8% 83.6% 76.9% 85.8%<br />
-- --<br />
--<br />
94.2% 92.5% 89.8%<br />
There are no parent<br />
items for this<br />
dimension<br />
83.5%<br />
-- --<br />
-- --<br />
--<br />
94.9% 90.9% 90.3% 79.1% 92.3%<br />
-- --<br />
-- --<br />
--<br />
92.8% 91.7% 87.7% 81.7% 73.7%<br />
-- --<br />
-- --<br />
--<br />
75.4% 86.7% 90.9% 84.6% 87.0%<br />
-- --<br />
-- --<br />
--<br />
95.0% 89.3% 87.0% 82.5% 86.7%<br />
--<br />
--<br />
85.8%<br />
--<br />
75.6%<br />
--<br />
76.4%<br />
--<br />
87.5%<br />
--<br />
75.5%<br />
--<br />
79.4%<br />
--<br />
74.9%<br />
**<br />
Survey Return Rate 2011 -- -- -- -- -- --<br />
2012 95.7% 60.5% 39.0% 24.0% 91.5% 87.4%<br />
* State Teacher and Parent positive response figures are one of 4 grade spans (Gr. K to 5/6, Gr. 6/7 to 8, Gr. 9 to<br />
12, and Multi-level) that best correspond to this school's grade span. The Student positive response figures for<br />
the State and this school are those of the highest grade level surveyed at this school.<br />
**<br />
There are no student<br />
items for this<br />
dimension<br />
There are no student<br />
items for this<br />
dimension<br />
Note: Items and scales that make up the 2012 <strong>School</strong> Quality Survey dimensions were revised to reflect recent<br />
recommendations from internal and external reviewers. As a result the 2011 SQS percentages are intentionally<br />
blank (- - ) since they are not comparable to the 2012 percentages.<br />
State Return Rate for Teachers, Parents, and Students are for one of 6 grade spans (Elementary,<br />
Elementary/<strong>Middle</strong>, Elementary/<strong>Middle</strong>/High, <strong>Middle</strong>, <strong>Middle</strong>/High, High) that corresponds to this school.<br />
<strong>William</strong> P. <strong>Jarrett</strong> <strong>Middle</strong> <strong>School</strong> 01/13<br />
Page 6 of 8
<strong>School</strong> Status and Improvement Report <strong>School</strong> Year 2011-12<br />
Student Conduct<br />
94.1%<br />
9.6<br />
Attendance and Absences<br />
<strong>School</strong> Year<br />
2009-10 2010-11 2011-12<br />
Average Daily Attendance: %<br />
(higher is better)<br />
93.9%<br />
10.8<br />
<strong>School</strong> Retention<br />
Retention for elementary schools include students in all grades<br />
except kindergarten who were retained (kept back a grade).<br />
Retention for middle/intermediate schools include only eighth<br />
graders who were not promoted to ninth grade. Starting in<br />
2004, eighth grade retention calculations that conform to<br />
NCLB requirements are used.<br />
Total number of students<br />
Percent retained in grade<br />
94.1%<br />
Average Daily Absences: in days<br />
(lower is better)<br />
10.6<br />
Retention<br />
2010<br />
80<br />
0%<br />
State<br />
Standard<br />
95.0%<br />
9<br />
2011 2012<br />
73<br />
0%<br />
Vital Signs<br />
Non-suspended: 190<br />
Suspended: 54<br />
Class A: 28<br />
Class B: 69<br />
Class C: 25<br />
Class D: 0<br />
Examples of class of<br />
suspension:<br />
70<br />
1%<br />
Note. " -- " means missing data.<br />
" * " means data not reported to maintain student confidentiality (see FERPA).<br />
Suspensions, <strong>School</strong> Year 2011-2012<br />
0%<br />
22%<br />
23%<br />
20%<br />
57%<br />
78%<br />
These 54 students were<br />
responsible for these 122<br />
suspensions.<br />
0.0% 20.0% 40.0% 60.0% 80.0% 100.0%<br />
Class A: Burglary, robbery, sale of dangerous drugs<br />
Class B: Disorderly conduct, trespassing<br />
Class C: Class cutting, insubordination, smoking<br />
Class D: Contraband (e.g. possession of tobacco)<br />
<strong>William</strong> P. <strong>Jarrett</strong> <strong>Middle</strong> <strong>School</strong> 01/13 Page 7 of 8
<strong>School</strong> Status and Improvement Report <strong>School</strong> Year 2011-12<br />
Vital Signs<br />
Hawaii State Assessment Program<br />
Grade<br />
8<br />
7<br />
6<br />
Other <strong>School</strong> Information<br />
HCPS Reading HCPS Mathematics<br />
64%<br />
72%<br />
74%<br />
70%<br />
72%<br />
73%<br />
0% 20% 40% 60% 80% 100%<br />
Percent Proficient<br />
Grade<br />
<strong>School</strong> State<br />
A school's bar may not be shown to maintain student confidentiality (see FERPA).<br />
<strong>William</strong> P. <strong>Jarrett</strong> <strong>Middle</strong> <strong>School</strong> was accredited by the Western Association of <strong>School</strong>s and Colleges<br />
for a period of six years with a mid-term review. This school's accreditation status expires in 2016.<br />
Published on December 20, 2012. Updated on January 8, 2013.<br />
System Evaluation and Reporting Section, Systems Accountability Office, Office of the Superintendent, Honolulu, HI: Hawaii<br />
State Department of Education.<br />
<strong>William</strong> P. <strong>Jarrett</strong> <strong>Middle</strong> <strong>School</strong><br />
8<br />
Grade<br />
HCPS Science<br />
31%<br />
44%<br />
0% 20% 40% 60% 80% 100%<br />
Percent Proficient<br />
The HCPS Science assessment is given in grades 4, 8<br />
and 10.<br />
8<br />
7<br />
6<br />
58%<br />
56%<br />
58%<br />
63%<br />
58%<br />
71%<br />
0% 20% 40% 60% 80% 100%<br />
Percent Proficient<br />
01/13 Page 8 of 8