Lehua Elementary School - ARCH
Lehua Elementary School - ARCH
Lehua Elementary School - ARCH

Create successful ePaper yourself
Turn your PDF publications into a flip-book with our unique Google optimized e-Paper software.
<strong>School</strong> Code:<br />
<strong>Lehua</strong> <strong>Elementary</strong> <strong>School</strong><br />
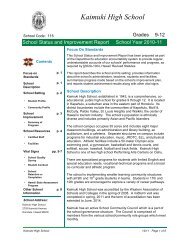
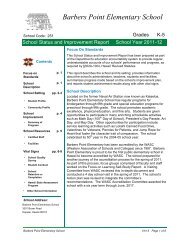
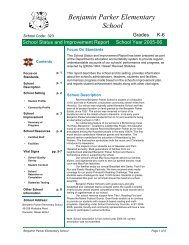
<strong>School</strong> Status and Improvement Report <strong>School</strong> Year 2011-12<br />
Focus on<br />
Standards<br />
<strong>School</strong><br />
Description<br />
Contents<br />
<strong>School</strong> Setting<br />
Student Profile<br />
Community Profile<br />
<strong>School</strong><br />
Improvement<br />
Summary of<br />
Progress<br />
<strong>School</strong> Resources<br />
Certified Staff<br />
Facilities<br />
Vital Signs<br />
•<br />
•<br />
•<br />
•<br />
•<br />
•<br />
•<br />
•<br />
•<br />
•<br />
<strong>School</strong> Quality<br />
Survey<br />
Student Conduct<br />
<strong>School</strong><br />
Retention or<br />
Completion<br />
Hawaii State Assessment<br />
Program<br />
<strong>School</strong> Address:<br />
268<br />
p. 1<br />
p. 1<br />
pp. 2-3<br />
p. 4<br />
p. 5<br />
pp. 6-8<br />
Other <strong>School</strong> Information<br />
<strong>Lehua</strong> <strong>Elementary</strong> <strong>School</strong><br />
791 <strong>Lehua</strong> Avenue<br />
Pearl City, Hawaii 96782<br />
Focus On Standards<br />
This <strong>School</strong> Status and Improvement Report has been prepared as part<br />
of the Department's education accountability system to provide regular,<br />
understandable accounts of our schools' performance and progress, as<br />
required by §302A-1004, Hawai'i Revised Statutes.<br />
This report describes the school and its setting; provides information<br />
about the school's administrators, teachers, students and facilities;<br />
summarizes progress made based on the school's improvement plan,<br />
and reports student achievement results along with other vital signs.<br />
<strong>School</strong> Description<br />
Grades<br />
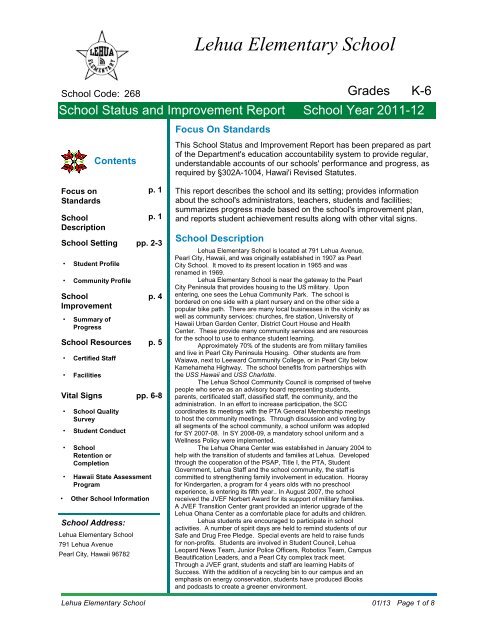
<strong>Lehua</strong> <strong>Elementary</strong> <strong>School</strong> is located at 791 <strong>Lehua</strong> Avenue,<br />
Pearl City, Hawaii, and was originally established in 1907 as Pearl<br />
City <strong>School</strong>. It moved to its present location in 1965 and was<br />
renamed in 1969.<br />
<strong>Lehua</strong> <strong>Elementary</strong> <strong>School</strong> is near the gateway to the Pearl<br />
City Peninsula that provides housing to the US military. Upon<br />
entering, one sees the <strong>Lehua</strong> Community Park. The school is<br />
bordered on one side with a plant nursery and on the other side a<br />
popular bike path. There are many local businesses in the vicinity as<br />
well as community services: churches, fire station, University of<br />
Hawaii Urban Garden Center, District Court House and Health<br />
Center. These provide many community services and are resources<br />
for the school to use to enhance student learning.<br />
Approximately 70% of the students are from military families<br />
and live in Pearl City Peninsula Housing. Other students are from<br />
Waiawa, next to Leeward Community College, or in Pearl City below<br />
Kamehameha Highway. The school benefits from partnerships with<br />
the USS Hawaii and USS Charlotte.<br />
The <strong>Lehua</strong> <strong>School</strong> Community Council is comprised of twelve<br />
people who serve as an advisory board representing students,<br />
parents, certificated staff, classified staff, the community, and the<br />
administration. In an effort to increase participation, the SCC<br />
coordinates its meetings with the PTA General Membership meetings<br />
to host the community meetings. Through discussion and voting by<br />
all segments of the school community, a school uniform was adopted<br />
for SY 2007-08. In SY 2008-09, a mandatory school uniform and a<br />
Wellness Policy were implemented.<br />
The <strong>Lehua</strong> Ohana Center was established in January 2004 to<br />
help with the transition of students and families at <strong>Lehua</strong>. Developed<br />
through the cooperation of the PSAP, Title I, the PTA, Student<br />
Government, <strong>Lehua</strong> Staff and the school community, the staff is<br />
committed to strengthening family involvement in education. Hooray<br />
for Kindergarten, a program for 4 years olds with no preschool<br />
experience, is entering its fifth year.. In August 2007, the school<br />
received the JVEF Norbert Award for its support of military families.<br />
A JVEF Transition Center grant provided an interior upgrade of the<br />
<strong>Lehua</strong> Ohana Center as a comfortable place for adults and children.<br />
<strong>Lehua</strong> students are encouraged to participate in school<br />
activities. A number of spirit days are held to remind students of our<br />
Safe and Drug Free Pledge. Special events are held to raise funds<br />
for non-profits. Students are involved in Student Council, <strong>Lehua</strong><br />
Leopard News Team, Junior Police Officers, Robotics Team, Campus<br />
Beautification Leaders, and a Pearl City complex track meet.<br />
Through a JVEF grant, students and staff are learning Habits of<br />
Success. With the addition of a recycling bin to our campus and an<br />
emphasis on energy conservation, students have produced iBooks<br />
and podcasts to create a greener environment.<br />
K-6<br />
<strong>Lehua</strong> <strong>Elementary</strong> <strong>School</strong> 01/13 Page 1 of 8
<strong>School</strong> Status and Improvement Report<br />
Student Profile<br />
<strong>School</strong> year 2009-10 2010-11 2011-12<br />
Fall enrollment<br />
Number and percent of students<br />
enrolled for the entire school<br />
year<br />
Number and percent of students<br />
receiving free or reduced-cost<br />
lunch<br />
n = 378<br />
411<br />
400<br />
<strong>School</strong> Setting<br />
376<br />
<strong>School</strong> Year 2011-12<br />
297 305 275 Number and percent of students 53 37 26<br />
72.3% 76.3% 73.1% with limited English proficiency 12.9% 9.3% 6.9%<br />
184 181 173<br />
44.8% 45.3% 46.0%<br />
Number and percent of students<br />
in Special Education programs<br />
Percent of Kindergartners who<br />
attended preschool<br />
Student Ethnicity, <strong>School</strong> Year 2011-12<br />
Part-Hawaiian 0<br />
Native American 1<br />
Black 59<br />
Chinese 1<br />
Filipino 43<br />
Native Hawaiian 50<br />
Japanese 13<br />
Korean 2<br />
Portuguese 0<br />
Hispanic 41<br />
Samoan 14<br />
Indo-Chinese 3<br />
Micronesian 2<br />
Tongan 2<br />
Guamanian/Chamorro 8<br />
White 139<br />
White two or more 0<br />
Other Asian 0<br />
Other Pacific Islander 0<br />
Pacific Islander two or more 0<br />
Asian two or more 0<br />
Multiple, two or more 0<br />
0.3%<br />
0.3%<br />
11.4%<br />
13.2%<br />
3.4%<br />
0.5%<br />
10.8%<br />
3.7%<br />
0.8%<br />
0.5%<br />
0.5%<br />
2.1%<br />
15.6%<br />
36.8%<br />
0% 20% 40% 60% 80% 100%<br />
2009-10 2010-11 2011-12<br />
40 49 46<br />
9.7% 12.3% 12.2%<br />
53% 24% 53%<br />
<strong>Lehua</strong> <strong>Elementary</strong> <strong>School</strong> 01/13<br />
Page 2 of 8
<strong>School</strong> Status and Improvement Report<br />
Community Profile<br />
<strong>School</strong> Setting<br />
<strong>School</strong> Year 2011-12<br />
The Community Profile information updated in this school report reflects selected 2010 demographics<br />
for the High <strong>School</strong> Complex (HSC) area in which this school resides. Profile data are based on the<br />
2010 U.S. Census, the American Community Survey (ACS) 2006-2010 five-year estimates (centric to<br />
2008), and incorporation of Hawaii’s HSC boundary areas with updated 2010 Census geography.<br />
Figures for educational attainment and median household income are sample estimates obtained from<br />
the ACS, adapted to conform to HSC geography, and should be considered rough approximations of<br />
census counts.<br />
Pearl City HSC Complex<br />
Total population<br />
Percentage of population aged 5-19<br />
Median age of population<br />
Number of family households<br />
Median household income<br />
Community Educational Attainment Level<br />
College<br />
Graduate<br />
Some College<br />
High <strong>School</strong><br />
Less than High<br />
<strong>School</strong><br />
Graduate<br />
7.9%<br />
10.2%<br />
23.8%<br />
29.4%<br />
31.4%<br />
31.0%<br />
29.0%<br />
37.3%<br />
0% 10% 20% 30% 40% 50% 60%<br />
State of Haw ai`i <strong>School</strong> Community<br />
Based on the 2010 U.S. Census and<br />
American Community Survey (ACS)<br />
<strong>School</strong><br />
Community<br />
51,078<br />
16.1%<br />
38.2<br />
11,788<br />
$77,316<br />
State of<br />
Hawai`i<br />
1,360,301<br />
18.4%<br />
38.6<br />
313,907<br />
$66,420<br />
<strong>Lehua</strong> <strong>Elementary</strong> <strong>School</strong> 01/13<br />
Page 3 of 8
<strong>School</strong> Status and Improvement Report<br />
Summary of Progress<br />
<strong>School</strong> Improvement<br />
<strong>School</strong> Year 2011-12<br />
During the 2011-12 school year, <strong>Lehua</strong> <strong>Elementary</strong> <strong>School</strong> successfully implemented the<br />
activities described in the academic plan. We have increased the rigor in the second year of<br />
implementation of The Leader in Me Program and Thinking Maps. AVID strategies have been introduced<br />
to grade 6, and teachers in grades 4 and 5 have undergone training during the school year. <strong>School</strong>Rise<br />
has also been contracted to work with the staff on aligning the writing<br />
curriculum. The common core curriculum has been implemented in grades K-2 and aligned in grades 3-<br />
6.<br />
This past year, 64% of the students were newly enrolled at <strong>Lehua</strong>. We usually have about 50%<br />
of our students transition into our school during the year and this was an exceptional year. The Leader in<br />
Me Program has advanced a school environment that promotes the following Habits of Success: 1. Be<br />
proactive. 2. Begin with the end in mind. 3. Put first things first. 4. Think Win-Win. 5. Seek first to<br />
understand, then to be understood. 6. Synergize.<br />
7. Sharpen the saw. 8. Find your voice and help others find theirs. The students are encouraged to<br />
develop leadership skills to build confidence in themselves and others, and to make the right choice even<br />
when no one is looking. Student opportunities for leadership have increased steadily. Two highly<br />
successful leadership days were held, one for the community on December 14, 2011 and another for<br />
parents on April 25, 2012. In regards to student discipline, the program was able to reduce the number of<br />
students referred to administration by 12 students and increase the number of students with no incidents<br />
by 2%. The Habits of Success have also been integral to other schoolwide initiatives.<br />
At the beginning of the school year, as the Habits are introduced, Thinking Maps are also<br />
introduced and the Habits are used as the content to learn. Training was provided by Dr. Lynn Williams<br />
on the use of multiple maps, the frame of reference and map questions. Morris West provided a work<br />
session on the software to facilitate the use of the maps. In March, a principal walk thru provided<br />
feedback to teachers on the types of maps, frequency of use, frame of reference, map questions, and<br />
student products taken off the map. This feedback provided teachers the impetus to develop plans on<br />
further use of the Thinking Maps for the rest of the school year. A few teachers were able to visit two<br />
schools to compare the use of Thinking Maps to <strong>Lehua</strong> and to garner ideas. Insights were shared and<br />
discussed with the staff for everyone’s professional learning. During the 2012 summer, 13 faculty<br />
members also attended Thinking Map training to expand their repertoire.<br />
Six faculty members attended the 2011 AVID training and developed a plan for implementation<br />
that was shared with the staff. As part of the plan development, an assessment of AVID strategies was<br />
completed to examine what we had in place and the next steps for full implementation. SMART goals<br />
were developed and the plan was shared with the entire staff.<br />
The Habits of Success were used to incorporate the AVID strategies schoolwide. Morning messages with<br />
college and career readiness goals were produced by students and faculty. Every student used a planner<br />
for homework and home-school communication. On Fridays, the faculty wore college shirts or colors and<br />
spoke about college with the students. Grades 4-6 were surveyed and researched career preparation.<br />
<strong>School</strong>Rise, a consultant firm under Dr. Kathy Au, was also contracted to complete a<br />
comprehensive needs assessment in writing and to facilitate the designing of infrastructure, philosophy<br />
and vision of writing, and the enter and exit writing outcomes for each grade level. In addition, the<br />
teachers have completed writing diary maps for this school year and feedback will be provided when the<br />
2012-13 school year begins to further increase the rigor in writing.<br />
<strong>Lehua</strong> <strong>Elementary</strong> <strong>School</strong> 01/13<br />
Page 4 of 8
<strong>School</strong> Status and Improvement Report<br />
Certified Staff<br />
Teaching Staff<br />
Total Full-Time Equivalent (FTE)<br />
Regular Instruction, FTE<br />
Special Instruction, FTE<br />
Supplemental Instruction, FTE<br />
Teacher headcount<br />
Teachers with 5 or more years at this school<br />
Teachers' average years of experience<br />
Teachers with advanced degrees<br />
74.1%<br />
25.9%<br />
0.0%<br />
Professional Teacher Credentials<br />
Facilities<br />
Fully licensed<br />
Provisional credential<br />
Emergency credential<br />
88.9%<br />
11.1%<br />
0.0%<br />
Classrooms available 29<br />
Number of classrooms short (-) or over (+) 0<br />
<strong>School</strong> facilities inspection results<br />
<strong>School</strong> Year Ending 2012<br />
From the 2011 school year school facilities<br />
inspection data are no longer available at the state<br />
level. Department schools are still required to do an<br />
annual assessment of its facilities in the following<br />
areas: Grounds, Building exterior, Building interior,<br />
Equipment/Furnishings, Health/Safety and<br />
Sanitation. All department schools should have their<br />
annual inspections completed by the second quarter<br />
of the school year.<br />
Historically the majority of the department schools<br />
attained inspection assessment points in the<br />
following ranges, 9-15 earning a "Satisfactory" rating<br />
and 16-18 points earning the highest "Very Good"<br />
rating.<br />
<strong>School</strong> Resources<br />
27.0<br />
20.0<br />
7.0<br />
0.0<br />
27<br />
11<br />
8.7<br />
7<br />
24<br />
3<br />
0<br />
*<br />
Students per Teaching Staff<br />
Regular Instruction<br />
Special Instruction<br />
<strong>School</strong> Year 2011-12<br />
Administrative and Student Services Staff<br />
Administration, FTE *<br />
Librarians, FTE<br />
Counselors, FTE<br />
Number of principals at this school<br />
in the last five years<br />
16.5<br />
6.6<br />
* Regular instruction includes both regular and<br />
supplemental teaching staff and does not include<br />
mainstreamed special education students. Therefore,<br />
these figures do not indicate class size.<br />
2.0<br />
1.0<br />
1.0<br />
* Administration includes Principals, Vice-Principals,<br />
Student Activity Coordinators, Student Services<br />
Coordinators, Registrars, and Athletic Directors<br />
Administration<br />
Library<br />
Caf eteria/<br />
Auditorium<br />
Classrooms<br />
Adequacy of <strong>School</strong>'s Space<br />
83%<br />
72%<br />
222%<br />
128%<br />
0% 100% 200%<br />
<strong>School</strong> facilities are considered inadequate if below 70%; marginal if<br />
between 70% and 99%; and in excess of state standard if above<br />
100%. <strong>School</strong> population is placed into size categories and is used in<br />
formulas to determine State standards for space. Graph does not<br />
display capacity exceeding 200%.<br />
1<br />
State Standard<br />
<strong>Lehua</strong> <strong>Elementary</strong> <strong>School</strong> 01/13<br />
Page 5 of 8
<strong>School</strong> Status and Improvement Report<br />
<strong>School</strong> Quality Survey<br />
Vital Signs<br />
<strong>School</strong> Year 2011-12<br />
The <strong>School</strong> Quality Survey (SQS), administered periodically by the System Evaluation and Reporting<br />
Section, is used for strategic planning and to comply with state accountability requirements.<br />
*<br />
<strong>School</strong> Quality Survey<br />
Dimensions<br />
Standards-Based Learning<br />
Quality Student Support<br />
Professionalism & System<br />
Capacity<br />
Coordinated Team Work<br />
Responsiveness of the System<br />
Focused & Sustained Action<br />
Involvement<br />
Satisfaction<br />
Student Safety & Well Being<br />
2011<br />
2012<br />
2011<br />
2012<br />
2011<br />
2012<br />
2011<br />
2012<br />
2011<br />
2012<br />
2011<br />
2012<br />
2011<br />
2012<br />
2011<br />
2012<br />
2011<br />
2012<br />
Percent of Positive Responses<br />
Teachers Parents Students<br />
<strong>School</strong> State <strong>School</strong> State <strong>School</strong> State<br />
-- --<br />
-- --<br />
--<br />
97.5% 98.3% 90.3% 89.8% 87.6%<br />
-- --<br />
-- --<br />
--<br />
91.7% 92.7% 89.0% 88.3% 82.8%<br />
--<br />
89.7%<br />
--<br />
94.3%<br />
-- --<br />
-- --<br />
--<br />
80.1% 90.0% 82.8% 83.0% 89.1%<br />
-- --<br />
--<br />
96.8% 94.6% 91.6%<br />
There are no parent<br />
items for this<br />
dimension<br />
89.6%<br />
-- --<br />
-- --<br />
--<br />
92.3% 94.2% 91.4% 87.1% 87.7%<br />
-- --<br />
-- --<br />
--<br />
98.7% 95.4% 91.8% 89.3% 75.0%<br />
-- --<br />
-- --<br />
--<br />
82.1% 91.0% 84.9% 88.5% 84.9%<br />
-- --<br />
-- --<br />
--<br />
96.7% 93.5% 90.3% 88.6% 81.4%<br />
--<br />
--<br />
90.3%<br />
--<br />
83.3%<br />
--<br />
90.1%<br />
--<br />
89.2%<br />
--<br />
83.5%<br />
--<br />
87.3%<br />
--<br />
83.2%<br />
**<br />
Survey Return Rate 2011 -- -- -- -- -- --<br />
2012 100.0% 62.3% 37.8% 38.8% 97.6% 93.3%<br />
* State Teacher and Parent positive response figures are one of 4 grade spans (Gr. K to 5/6, Gr. 6/7 to 8, Gr. 9 to<br />
12, and Multi-level) that best correspond to this school's grade span. The Student positive response figures for<br />
the State and this school are those of the highest grade level surveyed at this school.<br />
**<br />
There are no student<br />
items for this<br />
dimension<br />
There are no student<br />
items for this<br />
dimension<br />
Note: Items and scales that make up the 2012 <strong>School</strong> Quality Survey dimensions were revised to reflect recent<br />
recommendations from internal and external reviewers. As a result the 2011 SQS percentages are intentionally<br />
blank (- - ) since they are not comparable to the 2012 percentages.<br />
State Return Rate for Teachers, Parents, and Students are for one of 6 grade spans (<strong>Elementary</strong>,<br />
<strong>Elementary</strong>/Middle, <strong>Elementary</strong>/Middle/High, Middle, Middle/High, High) that corresponds to this school.<br />
<strong>Lehua</strong> <strong>Elementary</strong> <strong>School</strong> 01/13<br />
Page 6 of 8
<strong>School</strong> Status and Improvement Report <strong>School</strong> Year 2011-12<br />
Student Conduct<br />
94.8%<br />
8.3<br />
Attendance and Absences<br />
<strong>School</strong> Year<br />
2009-10 2010-11 2011-12<br />
Average Daily Attendance: %<br />
(higher is better)<br />
93.8%<br />
11.0<br />
<strong>School</strong> Retention<br />
Retention for elementary schools include students in all grades<br />
except kindergarten who were retained (kept back a grade).<br />
Retention for middle/intermediate schools include only eighth<br />
graders who were not promoted to ninth grade. Starting in<br />
2004, eighth grade retention calculations that conform to<br />
NCLB requirements are used.<br />
Total number of students<br />
Percent retained in grade<br />
94.7%<br />
Average Daily Absences: in days<br />
(lower is better)<br />
9.5<br />
Retention<br />
2010<br />
343<br />
0%<br />
State<br />
Standard<br />
95.0%<br />
9<br />
2011 2012<br />
323<br />
0%<br />
Vital Signs<br />
Non-suspended: 372<br />
Suspended: 4<br />
Class A: 1<br />
Class B: 3<br />
Class C: 0<br />
Class D: 1<br />
Examples of class of<br />
suspension:<br />
310<br />
0%<br />
Note. " -- " means missing data.<br />
" * " means data not reported to maintain student confidentiality (see FERPA).<br />
Suspensions, <strong>School</strong> Year 2011-2012<br />
1%<br />
0%<br />
20%<br />
20%<br />
These 4 students were<br />
responsible for these 5<br />
suspensions.<br />
60%<br />
0.0% 20.0% 40.0% 60.0% 80.0% 100.0%<br />
Class A: Burglary, robbery, sale of dangerous drugs<br />
Class B: Disorderly conduct, trespassing<br />
Class C: Class cutting, insubordination, smoking<br />
Class D: Contraband (e.g. possession of tobacco)<br />
<strong>Lehua</strong> <strong>Elementary</strong> <strong>School</strong> 01/13 Page 7 of 8<br />
99%
<strong>School</strong> Status and Improvement Report <strong>School</strong> Year 2011-12<br />
Vital Signs<br />
Hawaii State Assessment Program<br />
Grade<br />
6<br />
5<br />
4<br />
3<br />
Other <strong>School</strong> Information<br />
HCPS Reading HCPS Mathematics<br />
50%<br />
71%<br />
59%<br />
73%<br />
81%<br />
72%<br />
79%<br />
70%<br />
0% 20% 40% 60% 80% 100%<br />
Percent Proficient<br />
<strong>School</strong> State<br />
A school's bar may not be shown to maintain student confidentiality (see FERPA).<br />
Published on December 20, 2012. Updated on January 8, 2013.<br />
System Evaluation and Reporting Section, Systems Accountability Office, Office of the Superintendent, Honolulu, HI: Hawaii<br />
State Department of Education.<br />
<strong>Lehua</strong> <strong>Elementary</strong> <strong>School</strong><br />
Grade<br />
4<br />
Grade<br />
HCPS Science<br />
45%<br />
56%<br />
0% 20% 40% 60% 80% 100%<br />
Percent Proficient<br />
The HCPS Science assessment is given in grades 4, 8<br />
and 10.<br />
6<br />
5<br />
4<br />
3<br />
44%<br />
41%<br />
58%<br />
57%<br />
62%<br />
63%<br />
58%<br />
67%<br />
0% 20% 40% 60% 80% 100%<br />
Percent Proficient<br />
01/13 Page 8 of 8