Kahakai Elementary School - ARCH
Kahakai Elementary School - ARCH
Kahakai Elementary School - ARCH
Create successful ePaper yourself
Turn your PDF publications into a flip-book with our unique Google optimized e-Paper software.
<strong>School</strong> Code:<br />
<strong>Kahakai</strong> <strong>Elementary</strong> <strong>School</strong><br />
<strong>School</strong> Status and Improvement Report <strong>School</strong> Year 2011-12<br />
Focus on<br />
Standards<br />
<strong>School</strong><br />
Description<br />
Contents<br />
<strong>School</strong> Setting<br />
Student Profile<br />
Community Profile<br />
<strong>School</strong><br />
Improvement<br />
Summary of<br />
Progress<br />
<strong>School</strong> Resources<br />
Certified Staff<br />
Facilities<br />
Vital Signs<br />
•<br />
•<br />
•<br />
•<br />
•<br />
•<br />
•<br />
•<br />
•<br />
•<br />
<strong>School</strong> Quality<br />
Survey<br />
Student Conduct<br />
<strong>School</strong><br />
Retention or<br />
Completion<br />
Hawaii State Assessment<br />
Program<br />
<strong>School</strong> Address:<br />
371<br />
p. 1<br />
p. 1<br />
pp. 2-3<br />
p. 4<br />
p. 5<br />
pp. 6-8<br />
Other <strong>School</strong> Information<br />
<strong>Kahakai</strong> <strong>Elementary</strong> <strong>School</strong><br />
76-147 Royal Poinciana Drive<br />
Kailua-Kona, Hawaii 96740<br />
Focus On Standards<br />
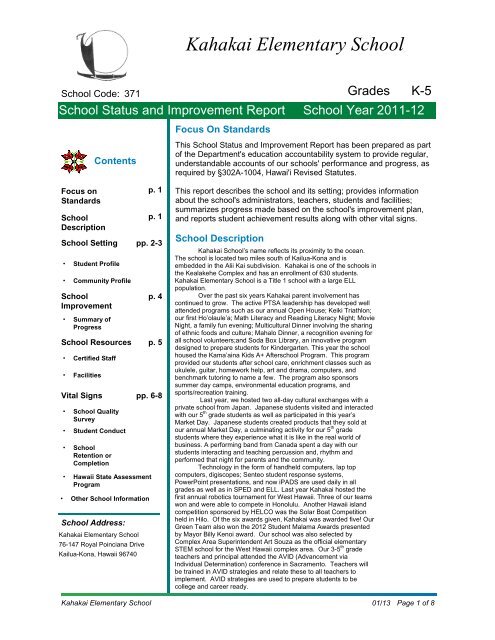
This <strong>School</strong> Status and Improvement Report has been prepared as part<br />
of the Department's education accountability system to provide regular,<br />
understandable accounts of our schools' performance and progress, as<br />
required by §302A-1004, Hawai'i Revised Statutes.<br />
This report describes the school and its setting; provides information<br />
about the school's administrators, teachers, students and facilities;<br />
summarizes progress made based on the school's improvement plan,<br />
and reports student achievement results along with other vital signs.<br />
<strong>School</strong> Description<br />
Grades<br />
<strong>Kahakai</strong> <strong>School</strong>’s name reflects its proximity to the ocean.<br />
The school is located two miles south of Kailua-Kona and is<br />
embedded in the Alii Kai subdivision. <strong>Kahakai</strong> is one of the schools in<br />
the Kealakehe Complex and has an enrollment of 630 students.<br />
<strong>Kahakai</strong> <strong>Elementary</strong> <strong>School</strong> is a Title 1 school with a large ELL<br />
population.<br />
Over the past six years <strong>Kahakai</strong> parent involvement has<br />
continued to grow. The active PTSA leadership has developed well<br />
attended programs such as our annual Open House; Keiki Triathlon;<br />
our first Ho’olaule’a; Math Literacy and Reading Literacy Night; Movie<br />
Night, a family fun evening; Multicultural Dinner involving the sharing<br />
of ethnic foods and culture; Mahalo Dinner, a recognition evening for<br />
all school volunteers;and Soda Box Library, an innovative program<br />
designed to prepare students for Kindergarten. This year the school<br />
housed the Kama’aina Kids A+ Afterschool Program. This program<br />
provided our students after school care, enrichment classes such as<br />
ukulele, guitar, homework help, art and drama, computers, and<br />
benchmark tutoring to name a few. The program also sponsors<br />
summer day camps, environmental education programs, and<br />
sports/recreation training.<br />
Last year, we hosted two all-day cultural exchanges with a<br />
private school from Japan. Japanese students visited and interacted<br />
with our 5 th grade students as well as participated in this year’s<br />
Market Day. Japanese students created products that they sold at<br />
our annual Market Day, a culminating activity for our 5 th grade<br />
students where they experience what it is like in the real world of<br />
business. A performing band from Canada spent a day with our<br />
students interacting and teaching percussion and, rhythm and<br />
performed that night for parents and the community.<br />
Technology in the form of handheld computers, lap top<br />
computers, digiscopes; Senteo student response systems,<br />
PowerPoint presentations, and now iPADS are used daily in all<br />
grades as well as in SPED and ELL. Last year <strong>Kahakai</strong> hosted the<br />
first annual robotics tournament for West Hawaii. Three of our teams<br />
won and were able to compete in Honolulu. Another Hawaii island<br />
competition sponsored by HELCO was the Solar Boat Competition<br />
held in Hilo. Of the six awards given, <strong>Kahakai</strong> was awarded five! Our<br />
Green Team also won the 2012 Student Malama Awards presented<br />
by Mayor Billy Kenoi award. Our school was also selected by<br />
Complex Area Superintendent Art Souza as the official elementary<br />
STEM school for the West Hawaii complex area. Our 3-5 th grade<br />
teachers and principal attended the AVID (Advancement via<br />
Individual Determination) conference in Sacramento. Teachers will<br />
be trained in AVID strategies and relate these to all teachers to<br />
implement. AVID strategies are used to prepare students to be<br />
college and career ready.<br />
K-5<br />
<strong>Kahakai</strong> <strong>Elementary</strong> <strong>School</strong> 01/13 Page 1 of 8
<strong>School</strong> Status and Improvement Report<br />
Student Profile<br />
<strong>School</strong> year 2009-10 2010-11 2011-12<br />
Fall enrollment<br />
Number and percent of students<br />
enrolled for the entire school<br />
year<br />
Number and percent of students<br />
receiving free or reduced-cost<br />
lunch<br />
n = 642<br />
593<br />
604<br />
<strong>School</strong> Setting<br />
614<br />
<strong>School</strong> Year 2011-12<br />
516 537 535 Number and percent of students 111 118 111<br />
87.0% 88.9% 87.1% with limited English proficiency 18.7% 19.5% 18.1%<br />
308 349 411<br />
51.9% 57.8% 66.9%<br />
Number and percent of students<br />
in Special Education programs<br />
Percent of Kindergartners who<br />
attended preschool<br />
Student Ethnicity, <strong>School</strong> Year 2011-12<br />
Part-Hawaiian 0<br />
Native American 7<br />
Black 17<br />
Chinese 6<br />
Filipino 105<br />
Native Hawaiian 182<br />
Japanese 18<br />
Korean 4<br />
Portuguese 6<br />
Hispanic 76<br />
Samoan 7<br />
Indo-Chinese 3<br />
Micronesian 67<br />
Tongan 3<br />
Guamanian/Chamorro 0<br />
White 141<br />
White two or more 0<br />
Other Asian 0<br />
Other Pacific Islander 0<br />
Pacific Islander two or more 0<br />
Asian two or more 0<br />
Multiple, two or more 0<br />
1.1%<br />
2.6%<br />
0.9%<br />
16.4%<br />
28.3%<br />
2.8%<br />
0.6%<br />
0.9%<br />
11.8%<br />
1.1%<br />
0.5%<br />
10.4%<br />
0.5%<br />
22.0%<br />
0% 20% 40% 60% 80% 100%<br />
2009-10 2010-11 2011-12<br />
42 47 39<br />
7.1% 7.8% 6.4%<br />
53% 49% 54%<br />
<strong>Kahakai</strong> <strong>Elementary</strong> <strong>School</strong> 01/13<br />
Page 2 of 8
<strong>School</strong> Status and Improvement Report<br />
Community Profile<br />
<strong>School</strong> Setting<br />
<strong>School</strong> Year 2011-12<br />
The Community Profile information updated in this school report reflects selected 2010 demographics<br />
for the High <strong>School</strong> Complex (HSC) area in which this school resides. Profile data are based on the<br />
2010 U.S. Census, the American Community Survey (ACS) 2006-2010 five-year estimates (centric to<br />
2008), and incorporation of Hawaii’s HSC boundary areas with updated 2010 Census geography.<br />
Figures for educational attainment and median household income are sample estimates obtained from<br />
the ACS, adapted to conform to HSC geography, and should be considered rough approximations of<br />
census counts.<br />
Kealakehe HSC Complex<br />
Total population<br />
Percentage of population aged 5-19<br />
Median age of population<br />
Number of family households<br />
Median household income<br />
Community Educational Attainment Level<br />
College<br />
Graduate<br />
Some College<br />
High <strong>School</strong><br />
Less than High<br />
<strong>School</strong><br />
Graduate<br />
7.2%<br />
10.2%<br />
28.1%<br />
29.4%<br />
33.2%<br />
31.4%<br />
31.6%<br />
29.0%<br />
0% 10% 20% 30% 40% 50% 60%<br />
State of Haw ai`i <strong>School</strong> Community<br />
Based on the 2010 U.S. Census and<br />
American Community Survey (ACS)<br />
<strong>School</strong><br />
Community<br />
42,511<br />
17.5%<br />
41.5<br />
10,394<br />
$66,079<br />
State of<br />
Hawai`i<br />
1,360,301<br />
18.4%<br />
38.6<br />
313,907<br />
$66,420<br />
<strong>Kahakai</strong> <strong>Elementary</strong> <strong>School</strong> 01/13<br />
Page 3 of 8
<strong>School</strong> Status and Improvement Report<br />
Summary of Progress<br />
<strong>School</strong> Improvement<br />
<strong>School</strong> Year 2011-12<br />
In 2005, <strong>Kahakai</strong>’s NCLB Status was “In Good Standing, Pending”. In 2006 the school moved to <strong>School</strong><br />
Improvement Year 1. In 2007 we continued to keep focused, striving to lead our students toward<br />
achieving the standards showing proficiency in both reading and math. We made adequate yearly<br />
progress (AYP) in 2008. Unfortunately, scores for 2009 remained static despite a very determined and<br />
focused effort by the entire staff.<br />
In school year 2010-11, <strong>Kahakai</strong> did not make AYP even though there were substantial gains made in the<br />
math scores. Under No Child Left Behind (NCLB), a school must “pass all sub-categories in order to<br />
make AYP. If even one category does not make the criteria, the school does not pass. <strong>Kahakai</strong> did meet<br />
the criteria in 37 of the 40 categories but fell short in the reading categories. This “classification”<br />
unfortunately does not present a total picture of the growth that a school makes. In 2010 all resources<br />
were directed towards math as the focus area and as a result the math scores soared. In 2012, the focus<br />
will continue on math but the school will step up its efforts in reading as well to ensure learning for all<br />
students. In 2012, we are happy to report that <strong>Kahakai</strong> <strong>Elementary</strong> made AYP. This was a direct result<br />
of focused professional development, effective instruction, and continuous analysis of data to reflect<br />
student progress. We are happy to report the following results: In reading in 2012, 70% of all our<br />
students were proficient in reading, a 9% increase over 2011 scores and an 18% increase from 2009.<br />
Looking at the subgroups, the percentage of disadvantages students who scored proficient jumped from<br />
52% to 68% this year, a 13% increase over 2011 and a 19% increase since 2009. There was a 10%<br />
increase in the number of Asian/Pacific Islander students who scored proficient in 2012, a 20% increase<br />
since 2009. There was also a 5% increase in the white sub-category in 2012. Again this year, our largest<br />
gains were in math. Phenomenal gains have been made at <strong>Kahakai</strong> <strong>Elementary</strong> since 2009. Since<br />
2009, our students went from 46% proficient to 71% proficient in 2012. That is a 25% increase in the<br />
number of students scoring as proficient. We made a 15% gain alone over last year’s scores. In the subcategories,<br />
we made remarkable gains also. The disadvantaged subgroup increased by 20% and the<br />
Asian Pacific Islander group increased by 18% and the white subgroup also increased by 8%.<br />
Students at <strong>Kahakai</strong> use Achieve 3000/Kid Biz, programs which use the Associated Press (AP) articles<br />
that are leveled by lexile scores which allows any reader from the 2 nd grade level to post high school level<br />
to access these articles. This program promotes the differentiated needs of our students. Students then<br />
participate in assessment activities to track their progress. This year, two of our students were rewarded<br />
for their efforts on Achieve 300. One student won the Grand Achiever Award for completing the most Kid<br />
Biz activities in a given period of time. She was recognized and awarded a medal, certificate and<br />
backpack at a luncheon held at the Four Seasons Resort. Another of our students was the runner up.<br />
He was awarded a medal and a certificate.. Additionally, this year the staff has focused on academic<br />
vocabulary to increase literacy.<br />
<strong>Kahakai</strong> <strong>Elementary</strong> <strong>School</strong> 01/13<br />
Page 4 of 8
<strong>School</strong> Status and Improvement Report<br />
Certified Staff<br />
Teaching Staff<br />
Total Full-Time Equivalent (FTE)<br />
Regular Instruction, FTE<br />
Special Instruction, FTE<br />
Supplemental Instruction, FTE<br />
Teacher headcount<br />
Teachers with 5 or more years at this school<br />
Teachers' average years of experience<br />
Teachers with advanced degrees<br />
74.3%<br />
20.0%<br />
5.7%<br />
Professional Teacher Credentials<br />
Facilities<br />
Fully licensed<br />
Provisional credential<br />
Emergency credential<br />
82.9%<br />
0.0%<br />
17.1%<br />
Classrooms available 43<br />
Number of classrooms short (-) or over (+) 1<br />
<strong>School</strong> facilities inspection results<br />
<strong>School</strong> Year Ending 2012<br />
From the 2011 school year school facilities<br />
inspection data are no longer available at the state<br />
level. Department schools are still required to do an<br />
annual assessment of its facilities in the following<br />
areas: Grounds, Building exterior, Building interior,<br />
Equipment/Furnishings, Health/Safety and<br />
Sanitation. All department schools should have their<br />
annual inspections completed by the second quarter<br />
of the school year.<br />
Historically the majority of the department schools<br />
attained inspection assessment points in the<br />
following ranges, 9-15 earning a "Satisfactory" rating<br />
and 16-18 points earning the highest "Very Good"<br />
rating.<br />
<strong>School</strong> Resources<br />
35.0<br />
26.0<br />
7.0<br />
2.0<br />
35<br />
20<br />
11.3<br />
15<br />
29<br />
0<br />
6<br />
*<br />
Students per Teaching Staff<br />
Regular Instruction<br />
Special Instruction<br />
<strong>School</strong> Year 2011-12<br />
Administrative and Student Services Staff<br />
Administration, FTE *<br />
Librarians, FTE<br />
Counselors, FTE<br />
Number of principals at this school<br />
in the last five years<br />
22.1<br />
5.6<br />
* Regular instruction includes both regular and<br />
supplemental teaching staff and does not include<br />
mainstreamed special education students. Therefore,<br />
these figures do not indicate class size.<br />
4.0<br />
1.0<br />
1.0<br />
* Administration includes Principals, Vice-Principals,<br />
Student Activity Coordinators, Student Services<br />
Coordinators, Registrars, and Athletic Directors<br />
Administration<br />
Library<br />
Caf eteria/<br />
Auditorium<br />
Classrooms<br />
Adequacy of <strong>School</strong>'s Space<br />
145%<br />
108%<br />
132%<br />
111%<br />
0% 100% 200%<br />
<strong>School</strong> facilities are considered inadequate if below 70%; marginal if<br />
between 70% and 99%; and in excess of state standard if above<br />
100%. <strong>School</strong> population is placed into size categories and is used in<br />
formulas to determine State standards for space. Graph does not<br />
display capacity exceeding 200%.<br />
1<br />
State Standard<br />
<strong>Kahakai</strong> <strong>Elementary</strong> <strong>School</strong> 01/13<br />
Page 5 of 8
<strong>School</strong> Status and Improvement Report<br />
<strong>School</strong> Quality Survey<br />
Vital Signs<br />
<strong>School</strong> Year 2011-12<br />
The <strong>School</strong> Quality Survey (SQS), administered periodically by the System Evaluation and Reporting<br />
Section, is used for strategic planning and to comply with state accountability requirements.<br />
*<br />
<strong>School</strong> Quality Survey<br />
Dimensions<br />
Standards-Based Learning<br />
Quality Student Support<br />
Professionalism & System<br />
Capacity<br />
Coordinated Team Work<br />
Responsiveness of the System<br />
Focused & Sustained Action<br />
Involvement<br />
Satisfaction<br />
Student Safety & Well Being<br />
2011<br />
2012<br />
2011<br />
2012<br />
2011<br />
2012<br />
2011<br />
2012<br />
2011<br />
2012<br />
2011<br />
2012<br />
2011<br />
2012<br />
2011<br />
2012<br />
2011<br />
2012<br />
Percent of Positive Responses<br />
Teachers Parents Students<br />
<strong>School</strong> State <strong>School</strong> State <strong>School</strong> State<br />
-- --<br />
-- --<br />
--<br />
98.9% 98.3% 93.5% 89.8% 90.6%<br />
-- --<br />
-- --<br />
--<br />
94.4% 92.7% 91.0% 88.3% 86.2%<br />
--<br />
100.0%<br />
--<br />
94.3%<br />
-- --<br />
-- --<br />
--<br />
94.5% 90.0% 89.0% 83.0% 90.5%<br />
-- --<br />
--<br />
98.6% 94.6% 90.9%<br />
There are no parent<br />
items for this<br />
dimension<br />
89.6%<br />
-- --<br />
-- --<br />
--<br />
97.3% 94.2% 93.3% 87.1% 89.1%<br />
-- --<br />
-- --<br />
--<br />
100.0% 95.4% 91.1% 89.3% 89.6%<br />
-- --<br />
-- --<br />
--<br />
97.2% 91.0% 92.9% 88.5% 93.3%<br />
-- --<br />
-- --<br />
--<br />
94.0% 93.5% 90.8% 88.6% 86.9%<br />
--<br />
--<br />
90.3%<br />
--<br />
83.3%<br />
--<br />
90.1%<br />
--<br />
89.2%<br />
--<br />
83.5%<br />
--<br />
87.3%<br />
--<br />
83.2%<br />
**<br />
Survey Return Rate 2011 -- -- -- -- -- --<br />
2012 28.9% 62.3% 38.3% 38.8% 76.5% 93.3%<br />
* State Teacher and Parent positive response figures are one of 4 grade spans (Gr. K to 5/6, Gr. 6/7 to 8, Gr. 9 to<br />
12, and Multi-level) that best correspond to this school's grade span. The Student positive response figures for<br />
the State and this school are those of the highest grade level surveyed at this school.<br />
**<br />
There are no student<br />
items for this<br />
dimension<br />
There are no student<br />
items for this<br />
dimension<br />
Note: Items and scales that make up the 2012 <strong>School</strong> Quality Survey dimensions were revised to reflect recent<br />
recommendations from internal and external reviewers. As a result the 2011 SQS percentages are intentionally<br />
blank (- - ) since they are not comparable to the 2012 percentages.<br />
State Return Rate for Teachers, Parents, and Students are for one of 6 grade spans (<strong>Elementary</strong>,<br />
<strong>Elementary</strong>/Middle, <strong>Elementary</strong>/Middle/High, Middle, Middle/High, High) that corresponds to this school.<br />
<strong>Kahakai</strong> <strong>Elementary</strong> <strong>School</strong> 01/13<br />
Page 6 of 8
<strong>School</strong> Status and Improvement Report <strong>School</strong> Year 2011-12<br />
Student Conduct<br />
93.5%<br />
10.6<br />
Attendance and Absences<br />
<strong>School</strong> Year<br />
2009-10 2010-11 2011-12<br />
Average Daily Attendance: %<br />
(higher is better)<br />
93.5%<br />
11.4<br />
<strong>School</strong> Retention<br />
Retention for elementary schools include students in all grades<br />
except kindergarten who were retained (kept back a grade).<br />
Retention for middle/intermediate schools include only eighth<br />
graders who were not promoted to ninth grade. Starting in<br />
2004, eighth grade retention calculations that conform to<br />
NCLB requirements are used.<br />
Total number of students<br />
Percent retained in grade<br />
92.7%<br />
Average Daily Absences: in days<br />
(lower is better)<br />
13.2<br />
Retention<br />
2010<br />
469<br />
0%<br />
State<br />
Standard<br />
95.0%<br />
9<br />
2011 2012<br />
472<br />
0%<br />
Vital Signs<br />
Non-suspended: 593<br />
Suspended: 21<br />
Class A: 2<br />
Class B: 3<br />
Class C: 2<br />
Class D: 26<br />
Examples of class of<br />
suspension:<br />
458<br />
0%<br />
Note. " -- " means missing data.<br />
" * " means data not reported to maintain student confidentiality (see FERPA).<br />
Suspensions, <strong>School</strong> Year 2011-2012<br />
3%<br />
6%<br />
6%<br />
9%<br />
79%<br />
97%<br />
These 21 students were<br />
responsible for these 33<br />
suspensions.<br />
0.0% 20.0% 40.0% 60.0% 80.0% 100.0%<br />
Class A: Burglary, robbery, sale of dangerous drugs<br />
Class B: Disorderly conduct, trespassing<br />
Class C: Class cutting, insubordination, smoking<br />
Class D: Contraband (e.g. possession of tobacco)<br />
<strong>Kahakai</strong> <strong>Elementary</strong> <strong>School</strong> 01/13 Page 7 of 8
<strong>School</strong> Status and Improvement Report <strong>School</strong> Year 2011-12<br />
Vital Signs<br />
Hawaii State Assessment Program<br />
Grade<br />
5<br />
4<br />
3<br />
Other <strong>School</strong> Information<br />
HCPS Reading HCPS Mathematics<br />
71%<br />
70%<br />
66%<br />
72%<br />
70%<br />
65%<br />
0% 20% 40% 60% 80% 100%<br />
Percent Proficient<br />
<strong>School</strong> State<br />
A school's bar may not be shown to maintain student confidentiality (see FERPA).<br />
Published on December 20, 2012. Updated on January 8, 2013.<br />
System Evaluation and Reporting Section, Systems Accountability Office, Office of the Superintendent, Honolulu, HI: Hawaii<br />
State Department of Education.<br />
<strong>Kahakai</strong> <strong>Elementary</strong> <strong>School</strong><br />
Grade<br />
4<br />
Grade<br />
HCPS Science<br />
38%<br />
45%<br />
0% 20% 40% 60% 80% 100%<br />
Percent Proficient<br />
The HCPS Science assessment is given in grades 4, 8<br />
and 10.<br />
5<br />
4<br />
3<br />
62%<br />
63%<br />
68%<br />
65%<br />
67%<br />
69%<br />
0% 20% 40% 60% 80% 100%<br />
Percent Proficient<br />
01/13 Page 8 of 8


