Nanakuli Elementary School - ARCH
Nanakuli Elementary School - ARCH
Nanakuli Elementary School - ARCH

Create successful ePaper yourself
Turn your PDF publications into a flip-book with our unique Google optimized e-Paper software.
<strong>School</strong> Code:<br />
<strong>Nanakuli</strong> <strong>Elementary</strong> <strong>School</strong><br />
<strong>School</strong> Status and Improvement Report <strong>School</strong> Year 2010-11<br />
Focus on<br />
Standards<br />
<strong>School</strong><br />
Description<br />
Contents<br />
<strong>School</strong> Setting<br />
•<br />
•<br />
Student Profile<br />
Community Profile<br />
<strong>School</strong><br />
Improvement<br />
•<br />
Summary of<br />
Progress<br />
<strong>School</strong> Resources<br />
•<br />
•<br />
Certified Staff<br />
Facilities<br />
Vital Signs<br />
•<br />
•<br />
•<br />
<strong>School</strong> Quality<br />
Survey<br />
Student Conduct<br />
<strong>School</strong><br />
Retention or<br />
Completion<br />
<strong>School</strong> Address:<br />
262<br />
p. 1<br />
p. 1<br />
p. 2<br />
p. 3<br />
p. 4<br />
pp. 5-7<br />
• Hawaii State Assessment<br />
Program<br />
Other <strong>School</strong> p. 8<br />
Information<br />
<strong>Nanakuli</strong> <strong>Elementary</strong> <strong>School</strong><br />
89-778 Haleakala Avenue<br />
Waianae, Hawaii 96792<br />
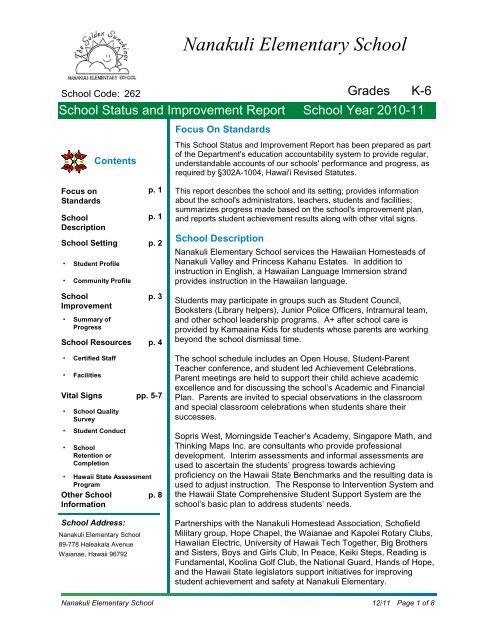
Focus On Standards<br />
This <strong>School</strong> Status and Improvement Report has been prepared as part<br />
of the Department's education accountability system to provide regular,<br />
understandable accounts of our schools' performance and progress, as<br />
required by §302A-1004, Hawai'i Revised Statutes.<br />
This report describes the school and its setting; provides information<br />
about the school's administrators, teachers, students and facilities;<br />
summarizes progress made based on the school's improvement plan,<br />
and reports student achievement results along with other vital signs.<br />
<strong>School</strong> Description<br />
Grades<br />
K-6<br />
<strong>Nanakuli</strong> <strong>Elementary</strong> <strong>School</strong> services the Hawaiian Homesteads of<br />
<strong>Nanakuli</strong> Valley and Princess Kahanu Estates. In addition to<br />
instruction in English, a Hawaiian Language Immersion strand<br />
provides instruction in the Hawaiian language.<br />
Students may participate in groups such as Student Council,<br />
Booksters (Library helpers), Junior Police Officers, Intramural team,<br />
and other school leadership programs. A+ after school care is<br />
provided by Kamaaina Kids for students whose parents are working<br />
beyond the school dismissal time.<br />
The school schedule includes an Open House, Student-Parent<br />
Teacher conference, and student led Achievement Celebrations.<br />
Parent meetings are held to support their child achieve academic<br />
excellence and for discussing the school’s Academic and Financial<br />
Plan. Parents are invited to special observations in the classroom<br />
and special classroom celebrations when students share their<br />
successes.<br />
Sopris West, Morningside Teacher’s Academy, Singapore Math, and<br />
Thinking Maps Inc. are consultants who provide professional<br />
development. Interim assessments and informal assessments are<br />
used to ascertain the students’ progress towards achieving<br />
proficiency on the Hawaii State Benchmarks and the resulting data is<br />
used to adjust instruction. The Response to Intervention System and<br />
the Hawaii State Comprehensive Student Support System are the<br />
school’s basic plan to address students’ needs.<br />
Partnerships with the <strong>Nanakuli</strong> Homestead Association, Schofield<br />
Military group, Hope Chapel, the Waianae and Kapolei Rotary Clubs,<br />
Hawaiian Electric, University of Hawaii Tech Together, Big Brothers<br />
and Sisters, Boys and Girls Club, In Peace, Keiki Steps, Reading is<br />
Fundamental, Koolina Golf Club, the National Guard, Hands of Hope,<br />
and the Hawaii State legislators support initiatives for improving<br />
student achievement and safety at <strong>Nanakuli</strong> <strong>Elementary</strong>.<br />
<strong>Nanakuli</strong> <strong>Elementary</strong> <strong>School</strong> 12/11 Page 1 of 8
<strong>School</strong> Status and Improvement Report<br />
Student Profile<br />
<strong>School</strong> year 2008-09 2009-10 2010-11<br />
Fall enrollment<br />
Number and percent of students<br />
enrolled for the entire school<br />
year<br />
Number and percent of students<br />
receiving free or reduced-cost<br />
lunch<br />
n = 459<br />
Community Profile<br />
483<br />
485<br />
<strong>School</strong> Setting<br />
435<br />
2010 Census Data not available at this time.<br />
<strong>School</strong> Year 2010-11<br />
443 447 405 Number and percent of students 1 0 0<br />
91.7% 92.2% 93.1% with limited English proficiency 0.2% 0.0% 0.0%<br />
348 350 335<br />
72.0% 72.2% 77.0%<br />
Number and percent of students<br />
in Special Education programs<br />
Percent of Kindergartners who<br />
attended preschool<br />
Student Ethnicity, <strong>School</strong> Year 2010-11<br />
Native American 0<br />
Black 1<br />
Chinese 1<br />
Filipino 6<br />
Native Hawaiian 438<br />
Japanese 0<br />
Korean 1<br />
Portuguese 1<br />
Hispanic 4<br />
Samoan 4<br />
Indo-Chinese 0<br />
Micronesian 0<br />
Tongan 0<br />
Guamanian/Chamorro 0<br />
White 2<br />
White two or more 0<br />
Other Asian 0<br />
Other Pacific Islander 0<br />
Pacific Islander two or more 0<br />
Asian two or more 0<br />
Multiple, two or more 1<br />
0.2%<br />
0.2%<br />
1.3%<br />
0.2%<br />
0.2%<br />
0.9%<br />
0.9%<br />
0.4%<br />
0.2%<br />
2008-09 2009-10 2010-11<br />
62 54 53<br />
12.8% 11.1% 12.2%<br />
28% 24% 43%<br />
95.4%<br />
0% 20% 40% 60% 80% 100%<br />
<strong>Nanakuli</strong> <strong>Elementary</strong> <strong>School</strong> 12/11<br />
Page 2 of 8
<strong>School</strong> Status and Improvement Report<br />
Summary of Progress<br />
<strong>School</strong> Improvement<br />
<strong>School</strong> Year 2010-11<br />
<strong>Nanakuli</strong> <strong>Elementary</strong> <strong>School</strong> has made significant progress in the area of standards<br />
implementation. Using the principles of Response to Intervention, several core curriculum<br />
materials as well as instructional strategies have been identified as being effective and, thus, are<br />
being used school-wide. Tier three curriculum materials have also been identified for trial with<br />
students needing a different approach. Reading instruction emphasis is on phonics, phonemics,<br />
fluency, comprehension, and vocabulary which are the five pillars of reading that were identified<br />
by the National Reading Panel. Fluency as well as concept development in mathematics are also<br />
emphasized. Although, there is still a need for and instruction on foundational skills, the<br />
instructional focus is now shifting to an emphasis on questioning, reasoning, and application.<br />
Across the school, visual tools are used to organize thoughts for speaking, writing, and studying<br />
vocabulary. Emphasis is also on writing and oral language development.<br />
Student learning is frequently monitored by analyzing student data from curricular<br />
assessments, benchmark mini-assessments, and rubric defined assessments. The analysis of<br />
current student learning needs is followed by the implementation of intervention plans.<br />
Teachers regularly meet in collegial groups to analyze the student data and to then, plan<br />
interventions. Data that is collected throughout the year on student progress indicate that the<br />
majority of students are becoming proficient on both the reading and math benchmarks.<br />
Students practice setting goals, planning, and sharing their reflections to others during<br />
the several times a year “Celebrations”. During this event, students share their accomplishments<br />
and plans in a presentation to parents.<br />
Any available waiver days, planning and collaboration days, faculty meetings, and<br />
teacher meeting times are used for data analysis and planning as well as for professional<br />
development. Teachers not only work and plan together, they also spend time observing in<br />
classrooms and participating in a dialogue with teachers of the school and of other schools.<br />
<strong>Nanakuli</strong> <strong>Elementary</strong> <strong>School</strong> 12/11<br />
Page 3 of 8
<strong>School</strong> Status and Improvement Report<br />
Certified Staff<br />
Teaching Staff<br />
Total Full-Time Equivalent (FTE)<br />
Regular Instruction, FTE<br />
Special Instruction, FTE<br />
Supplemental Instruction, FTE<br />
Teacher headcount<br />
Teachers with 5 or more years at this school<br />
Teachers' average years of experience<br />
Teachers with advanced degrees<br />
73.5%<br />
23.5%<br />
2.9%<br />
Professional Teacher Credentials<br />
Facilities<br />
Fully licensed<br />
Provisional credential<br />
Emergency credential<br />
76.5%<br />
20.6%<br />
2.9%<br />
Classrooms available 38<br />
Number of classrooms short (-) or over (+) 33<br />
<strong>School</strong> facilities inspection results<br />
<strong>School</strong> Year Ending 2011<br />
From the 2011 school year school facilities<br />
inspection data are no longer available at the state<br />
level. Department schools are still required to do an<br />
annual assessment of its facilities in the following<br />
areas: Grounds, Building exterior, Building interior,<br />
Equipment/Furnishings, Health/Safety and<br />
Sanitation. All department schools should have their<br />
annual inspections completed by the second quarter<br />
of the school year.<br />
Historically the majority of the department schools<br />
attained inspection assessment points in the<br />
following ranges, 9-15 earning a "Satisfactory" rating<br />
and 16-18 points earning the highest "Very Good"<br />
rating.<br />
<strong>School</strong> Resources<br />
34.0<br />
25.0<br />
8.0<br />
1.0<br />
34<br />
16<br />
8.5<br />
8<br />
26<br />
7<br />
1<br />
*<br />
Students per Teaching Staff<br />
Regular Instruction<br />
Special Instruction<br />
<strong>School</strong> Year 2010-11<br />
Administrative and Student Services Staff<br />
Administration, FTE *<br />
Librarians, FTE<br />
Counselors, FTE<br />
Number of principals at this school<br />
in the last five years<br />
14.7<br />
6.6<br />
* Regular instruction includes both regular and<br />
supplemental teaching staff and does not include<br />
mainstreamed special education students. Therefore,<br />
these figures do not indicate class size.<br />
2.0<br />
1.0<br />
1.0<br />
* Administration includes Principals, Vice-Principals,<br />
Student Activity Coordinators, Student Services<br />
Coordinators, Registrars, and Athletic Directors<br />
Administration<br />
Library<br />
Caf eteria/<br />
Auditorium<br />
Classrooms<br />
Adequacy of <strong>School</strong>'s Space<br />
150%<br />
124%<br />
179%<br />
175%<br />
0% 100% 200%<br />
<strong>School</strong> facilities are considered inadequate if below 70%; marginal if<br />
between 70% and 99%; and in excess of state standard if above<br />
100%. <strong>School</strong> population is placed into size categories and is used in<br />
formulas to determine State standards for space. Graph does not<br />
display capacity exceeding 200%.<br />
1<br />
State Standard<br />
<strong>Nanakuli</strong> <strong>Elementary</strong> <strong>School</strong> 12/11<br />
Page 4 of 8
<strong>School</strong> Status and Improvement Report<br />
<strong>School</strong> Quality Survey<br />
Vital Signs<br />
<strong>School</strong> Year 2010-11<br />
The <strong>School</strong> Quality Survey (SQS), administered periodically by the System Evaluation and Reporting<br />
Section, is used for strategic planning and to comply with state accountability requirements.<br />
*<br />
<strong>School</strong> Quality Survey<br />
Dimensions<br />
Standards-Based Learning<br />
Quality Student Support<br />
Professionalism & System<br />
Capacity<br />
Coordinated Team Work<br />
Responsiveness of the System<br />
Focused & Sustained Action<br />
Involvement<br />
Satisfaction<br />
Student Safety & Well Being<br />
2010<br />
2011<br />
2010<br />
2011<br />
2010<br />
2011<br />
2010<br />
2011<br />
2010<br />
2011<br />
2010<br />
2011<br />
2010<br />
2011<br />
2010<br />
2011<br />
2010<br />
2011<br />
Percent of Positive Responses<br />
Teachers Parents Students<br />
<strong>School</strong> State <strong>School</strong> State <strong>School</strong> State<br />
83.8% 92.0% 60.6% 76.2% 71.7%<br />
92.1% 92.6% 75.5% 80.0% 78.6%<br />
70.3% 81.9% 61.7% 76.4% 65.5%<br />
82.3% 80.3% 76.7% 78.6% 68.2%<br />
77.0% 85.9% 78.9% 79.2% 85.4%<br />
91.3% 85.7% 82.6% 81.4% 79.8%<br />
62.3% 75.4% 59.7% 66.5% 77.8%<br />
77.0% 75.5% 62.0% 71.1% 76.5%<br />
78.7% 85.0% 65.4%<br />
82.6% 84.2% 68.7%<br />
70.8%<br />
72.6%<br />
73.7% 84.5% 53.0% 64.1% 63.3%<br />
85.1% 83.2% 54.3% 67.7% 67.5%<br />
71.0% 78.6% 69.0% 70.9% 68.0%<br />
76.1% 77.6% 70.3% 72.1% 70.4%<br />
64.0% 78.3% 72.1% 74.9% 79.1%<br />
87.0% 77.5% 63.7% 79.3% 81.6%<br />
74.3% 85.6% 61.0% 77.8% 66.0%<br />
84.5% 83.4% 79.0% 79.8% 69.4%<br />
76.3%<br />
77.3%<br />
70.3%<br />
71.5%<br />
87.8%<br />
88.5%<br />
77.9%<br />
79.5%<br />
There are no student<br />
items for this<br />
dimension<br />
81.4%<br />
82.4%<br />
69.7%<br />
69.5%<br />
79.6%<br />
81.4%<br />
69.2%<br />
70.5%<br />
**<br />
Survey Return Rate 2010 92.6% 70.1% 37.7% 37.6% 84.9% 93.0%<br />
2011 67.6% 70.7% 19.2% 39.0% 90.8% 92.6%<br />
* State Teacher and Parent positive response figures are one of 4 grade spans (Gr. K to 5/6, Gr. 6/7 to 8, Gr. 9 to<br />
12, and Multi-level) that best correspond to this school's grade span. The Student positive response figures for<br />
the State and this school are those of the highest grade level surveyed at this school.<br />
**<br />
State Return Rate for Teachers, Parents, and Students are for one of 6 grade spans (i.e., Gr. K to 5/6, Gr. K to<br />
7/8, Gr. K to 12, Gr. 6/7 to 8, Gr. 6 to 12, and Gr. 9 to 12) that correspond to this school's grade span.<br />
<strong>Nanakuli</strong> <strong>Elementary</strong> <strong>School</strong> 12/11<br />
Page 5 of 8
<strong>School</strong> Status and Improvement Report <strong>School</strong> Year 2010-11<br />
Student Conduct<br />
91.0%<br />
15.9<br />
Attendance and Absences<br />
<strong>School</strong> Year<br />
2008-09 2009-10 2010-11<br />
Average Daily Attendance: %<br />
(higher is better)<br />
91.6%<br />
14.0<br />
<strong>School</strong> Retention<br />
Retention for elementary schools include students in all grades<br />
except kindergarten who were retained (kept back a grade).<br />
Retention for middle/intermediate schools include only eighth<br />
graders who were not promoted to ninth grade. Starting in<br />
2004, eighth grade retention calculations that conform to<br />
NCLB requirements are used.<br />
Total number of students<br />
Percent retained in grade<br />
91.1%<br />
Average Daily Absences: in days<br />
(lower is better)<br />
15.8<br />
Retention<br />
2009<br />
420<br />
0%<br />
State<br />
Standard<br />
95.0%<br />
9<br />
2010 2011<br />
413<br />
0%<br />
Vital Signs<br />
Non-suspended: 435<br />
Suspended: 0<br />
Class A: 0<br />
Class B: 0<br />
Class C: 0<br />
Class D: 0<br />
Examples of class of<br />
suspension:<br />
370<br />
0%<br />
Note. " -- " means missing data.<br />
" * " means data not reported to maintain student confidentiality (see FERPA).<br />
Suspensions, <strong>School</strong> Year 2010-2011<br />
0%<br />
0%<br />
0%<br />
0%<br />
0%<br />
No students were<br />
suspended at this school.<br />
0.0% 20.0% 40.0% 60.0% 80.0% 100.0%<br />
Class A: Burglary, robbery, sale of dangerous drugs<br />
Class B: Disorderly conduct, trespassing<br />
Class C: Class cutting, insubordination, smoking<br />
Class D: Contraband (e.g. possession of tobacco)<br />
<strong>Nanakuli</strong> <strong>Elementary</strong> <strong>School</strong> 12/11 Page 6 of 8<br />
100%
<strong>School</strong> Status and Improvement Report <strong>School</strong> Year 2010-11<br />
Vital Signs<br />
Hawaii State Assessment Program<br />
Grade<br />
6<br />
5<br />
4<br />
3<br />
HCPS Reading HCPS Mathematics<br />
47%<br />
67%<br />
58%<br />
52%<br />
66%<br />
67%<br />
65%<br />
54%<br />
0% 20% 40% 60% 80% 100%<br />
Percent Proficient<br />
<strong>School</strong> State<br />
A school's bar may not be shown to maintain student confidentiality (see FERPA).<br />
Grade<br />
Grade<br />
4<br />
10%<br />
43%<br />
63%<br />
69%<br />
Note. From 2006-2007, the Hawaii Content and Performance Standards (HCPS) III and TerraNova assessments were used.<br />
" -- " means missing data.<br />
" * " means data not reported to maintain student confidentiality (see FERPA).<br />
Grade<br />
HCPS Science<br />
0% 20% 40% 60% 80% 100%<br />
Percent Proficient<br />
The HCPS Science assessment is given in grades 4, 8<br />
and 10.<br />
6<br />
5<br />
4<br />
3<br />
44%<br />
52%<br />
58%<br />
51%<br />
61%<br />
67%<br />
0% 20% 40% 60% 80% 100%<br />
Percent Proficient<br />
TerraNova, 2nd Edition<br />
Percent Average and Above<br />
Reading<br />
Mathematics<br />
National Norm is 77%<br />
National Norm is 77%<br />
<strong>School</strong><br />
State<br />
<strong>School</strong><br />
State<br />
3 68% 80%<br />
73%<br />
85%<br />
4 68% 84%<br />
86%<br />
89%<br />
5 65% 85%<br />
80%<br />
90%<br />
6 68% 84%<br />
87%<br />
89%<br />
The TerraNova is a national norm-reference assessment with 9 stanine levels. Scores in stanines 1 to 3 represent "Below<br />
Average," and scores in stanines 4 to 9 represent "Average and Above."<br />
<strong>Nanakuli</strong> <strong>Elementary</strong> <strong>School</strong> 12/11 Page 7 of 8
<strong>School</strong> Status and Improvement Report<br />
Other <strong>School</strong> Information<br />
<strong>School</strong> Year 2010-11<br />
Published on December 2, 2011.<br />
System Evaluation and Reporting Section, Systems Accountability Office, Office of the Superintendent, Honolulu, HI: Hawaii<br />
State Department of Education.<br />
<strong>Nanakuli</strong> <strong>Elementary</strong> <strong>School</strong> 12/11<br />
Page 8 of 8