Zone Leveling Crystal Growth of Thermoelectric PbTe Alloys with ...
Zone Leveling Crystal Growth of Thermoelectric PbTe Alloys with ...
Zone Leveling Crystal Growth of Thermoelectric PbTe Alloys with ...

You also want an ePaper? Increase the reach of your titles
YUMPU automatically turns print PDFs into web optimized ePapers that Google loves.
<strong>Crystal</strong> <strong>Growth</strong> & Design ARTICLE<br />
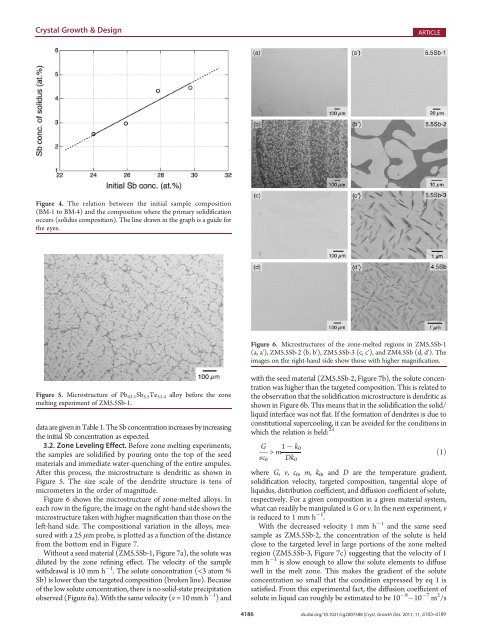
Figure 4. The relation between the initial sample composition<br />
(BM-1 to BM-4) and the composition where the primary solidification<br />
occurs (solidus composition). The line drawn in the graph is a guide for<br />
the eyes.<br />
Figure 5. Microstructure <strong>of</strong> Pb43.1Sb5.5Te51.4 alloy before the zone<br />
melting experiment <strong>of</strong> ZM5.5Sb-1.<br />
dataaregiveninTable1.TheSbconcentration increases by increasing<br />
the initial Sb concentration as expected.<br />
3.2. <strong>Zone</strong> <strong>Leveling</strong> Effect. Before zone melting experiments,<br />
the samples are solidified by pouring onto the top <strong>of</strong> the seed<br />
materials and immediate water-quenching <strong>of</strong> the entire ampules.<br />
After this process, the microstructure is dendritic as shown in<br />
Figure 5. The size scale <strong>of</strong> the dendrite structure is tens <strong>of</strong><br />
micrometers in the order <strong>of</strong> magnitude.<br />
Figure 6 shows the microstructure <strong>of</strong> zone-melted alloys. In<br />
each row in the figure, the image on the right-hand side shows the<br />
microstructure taken <strong>with</strong> higher magnification than those on the<br />
left-hand side. The compositional variation in the alloys, measured<br />
<strong>with</strong> a 25 μm probe, is plotted as a function <strong>of</strong> the distance<br />
from the bottom end in Figure 7.<br />
Without a seed material (ZM5.5Sb-1, Figure 7a), the solute was<br />
diluted by the zone refining effect. The velocity <strong>of</strong> the sample<br />
<strong>with</strong>drawal is 10 mm h 1 . The solute concentration (m ð1Þ<br />
vc0 Dk0<br />
where G, v, c0, m, k0, and D are the temperature gradient,<br />
solidification velocity, targeted composition, tangential slope <strong>of</strong><br />
liquidus, distribution coefficient, and diffusion coefficient <strong>of</strong> solute,<br />
respectively. For a given composition in a given material system,<br />
what can readily be manipulated is G or v. In the next experiment, v<br />
is reduced to 1 mm h 1 .<br />
With the decreased velocity 1 mm h 1 and the same seed<br />
sample as ZM5.5Sb-2, the concentration <strong>of</strong> the solute is held<br />
close to the targeted level in large portions <strong>of</strong> the zone melted<br />
region (ZM5.5Sb-3, Figure 7c) suggesting that the velocity <strong>of</strong> 1<br />
mm h 1 is slow enough to allow the solute elements to diffuse<br />
well in the melt zone. This makes the gradient <strong>of</strong> the solute<br />
concentration so small that the condition expressed by eq 1 is<br />
satisfied. From this experimental fact, the diffusion coefficient <strong>of</strong><br />
solute in liquid can roughly be estimated to be 10 8 10 7 m 2 /s<br />
4186 dx.doi.org/10.1021/cg2007588 |Cryst. <strong>Growth</strong> Des. 2011, 11, 4183–4189