Photon-Induced Near Field Electron Microscopy - California Institute ...
Photon-Induced Near Field Electron Microscopy - California Institute ...
Photon-Induced Near Field Electron Microscopy - California Institute ...

You also want an ePaper? Increase the reach of your titles
YUMPU automatically turns print PDFs into web optimized ePapers that Google loves.
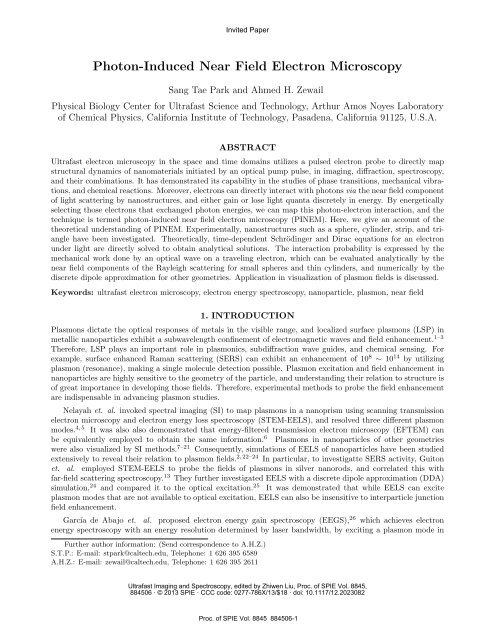
Invited Paper<br />
<strong>Photon</strong>-<strong>Induced</strong> <strong>Near</strong> <strong>Field</strong> <strong>Electron</strong> <strong>Microscopy</strong><br />
Sang Tae Park and Ahmed H. Zewail<br />
Physical Biology Center for Ultrafast Science and Technology, Arthur Amos Noyes Laboratory<br />
of Chemical Physics, <strong>California</strong> <strong>Institute</strong> of Technology, Pasadena, <strong>California</strong> 91125, U.S.A.<br />
ABSTRACT<br />
Ultrafast electron microscopy in the space and time domains utilizes a pulsed electron probe to directly map<br />
structural dynamics of nanomaterials initiated by an optical pump pulse, in imaging, diffraction, spectroscopy,<br />
and their combinations. It has demonstrated its capability in the studies of phase transitions, mechanical vibrations,<br />
and chemical reactions. Moreover, electrons can directly interact with photons via the near field component<br />
of light scattering by nanostructures, and either gain or lose light quanta discretely in energy. By energetically<br />
selecting those electrons that exchanged photon energies, we can map this photon-electron interaction, and the<br />
technique is termed photon-induced near field electron microscopy (PINEM). Here, we give an account of the<br />
theoretical understanding of PINEM. Experimentally, nanostructures such as a sphere, cylinder, strip, and triangle<br />
have been investigated. Theoretically, time-dependent Schrödinger and Dirac equations for an electron<br />
under light are directly solved to obtain analytical solutions. The interaction probability is expressed by the<br />
mechanical work done by an optical wave on a traveling electron, which can be evaluated analytically by the<br />
near field components of the Rayleigh scattering for small spheres and thin cylinders, and numerically by the<br />
discrete dipole approximation for other geometries. Application in visualization of plasmon fields is discussed.<br />
Keywords: ultrafast electron microscopy, electron energy spectroscopy, nanoparticle, plasmon, near field<br />
1. INTRODUCTION<br />
Plasmons dictate the optical responses of metals in the visible range, and localized surface plasmons (LSP) in<br />
metallic nanoparticles exhibit a subwavelength confinement of electromagnetic waves and field enhancement. 1–3<br />
Therefore, LSP plays an important role in plasmonics, subdiffraction wave guides, and chemical sensing. For<br />
example, surface enhanced Raman scattering (SERS) can exhibit an enhancement of 10 8 ∼ 10 14 by utilizing<br />
plasmon (resonance), making a single molecule detection possible. Plasmon excitation and field enhancement in<br />
nanoparticles are highly sensitive to the geometry of the particle, and understanding their relation to structure is<br />
of great importance in developing those fields. Therefore, experimental methods to probe the field enhancement<br />
are indispensable in advancing plasmon studies.<br />
Nelayah et. al. invoked spectral imaging (SI) to map plasmons in a nanoprism using scanning transmission<br />
electron microscopy and electron energy loss spectroscopy (STEM-EELS), and resolved three different plasmon<br />
modes. 4, 5 It was also also demonstrated that energy-filtered transmission electron microscopy (EFTEM) can<br />
be equivalently employed to obtain the same information. 6 Plasmons in nanoparticles of other geometries<br />
were also visualized by SI methods. 7–21 Consequently, simulations of EELS of nanoparticles have been studied<br />
extensively to reveal their relation to plasmon fields. 2, 22–24 In particular, to investigatte SERS activity, Guiton<br />
et. al. employed STEM-EELS to probe the fields of plasmons in silver nanorods, and correlated this with<br />
far-field scattering spectroscopy. 13 They further investigated EELS with a discrete dipole approximation (DDA)<br />
simulation, 24 and compared it to the optical excitation. 25 It was demonstrated that while EELS can excite<br />
plasmon modes that are not available to optical excitation, EELS can also be insensitive to interparticle junction<br />
field enhancement.<br />
García de Abajo et. al. proposed electron energy gain spectroscopy (EEGS), 26 which achieves electron<br />
energy spectroscopy with an energy resolution determined by laser bandwidth, by exciting a plasmon mode in<br />
Further author information: (Send correspondence to A.H.Z.)<br />
S.T.P.: E-mail: stpark@caltech.edu, Telephone: 1 626 395 6589<br />
A.H.Z.: E-mail: zewail@caltech.edu, Telephone: 1 626 395 2611<br />
Ultrafast Imaging and Spectroscopy, edited by Zhiwen Liu, Proc. of SPIE Vol. 8845,<br />
884506 · © 2013 SPIE · CCC code: 0277-786X/13/$18 · doi: 10.1117/12.2023082<br />
Proc. of SPIE Vol. 8845 884506-1
e<br />
e<br />
p<br />
EELS<br />
PINEM (EEGS)<br />
20 10 0 -10 -20 -30 -40 20 10<br />
electron energy (eV)<br />
0 -10 -20 -30 -40<br />
electron energy (eV)<br />
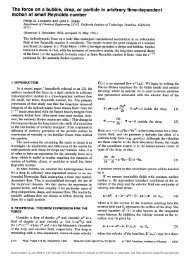
Figure 1. Comparison of interactions in EELS and PINEM.<br />
a nanoparticle with external light and probing it with the energy gain process of a swift electron. Barwick et.<br />
al. demonstrated this technique for nanostructures with a femtosecond laser in ultrafast electron microscopy<br />
(UEM), and termed it photon-induced near field electron microscopy (PINEM), emphasizing the capability to<br />
spatially map the photon-electron interaction. 27, 28 Theoretical accounts have been given by various groups. 29–31<br />
Here, we present the imaging aspect of PINEM, in particular, the capability to visualize the optical near field<br />
by spatially mapping the photon-electron interaction, and compare it to that by EELS. In EELS, swift electrons<br />
induce a transient electric field with a continuous spectrum of frequency and excite plasmons in nearby particles.<br />
In PINEM, a single-frequency optical pulse drives plasmons in particles, and electrons interact with confined<br />
plasmon fields (scattering). Therefore, PINEM maps the field of a single plasmon excited by light, whereas EELS<br />
maps the excitation efficiency of plasmons. We demonstrate this for a dielectric sphere, a silver nanorod, and a<br />
silver triangle, and discuss the plasmon field distribution with respect to PINEM images.<br />
2.1 <strong>Electron</strong>-plasmon coupling<br />
2. THEORETICAL<br />
In EELS (see Fig. 1), a moving electron imposes a spectrum of the electric field of<br />
Ẽ e (r, ω) = 2eω [<br />
ɛveγ 2 exp i ω ] [ i<br />
z<br />
ɛ v e<br />
γ ɛ<br />
K 0<br />
( ω<br />
v e<br />
) (<br />
b<br />
ω<br />
ˆv e − K 1<br />
γ ɛ v e<br />
)<br />
b<br />
ˆb<br />
γ ɛ<br />
]<br />
, (1)<br />
√<br />
where b is the impact parameter, γ ɛ = 1 − ɛ v2 e<br />
c<br />
is the Lorentz contraction factor for an electron moving at<br />
2<br />
the velocity, v e , in dielectric medium, ɛ, and K n is the modified bessel function of the second kind. 22 This<br />
transient electric field excites plasmons in a nanoparticle nearby, and the electron loses an energy quanta of<br />
¯hω. The plasmon field is determined by the geometry and material of the particle, and the transient field of a<br />
swift electron. Classically, the efficiency of the energy loss process is calculated by the rate of mechanical work<br />
performed on the electron by the electric field,<br />
Γ EELS (ω) =<br />
e<br />
π¯hω<br />
∫<br />
[<br />
dtRe v e ·<br />
{Ẽ (re , ω) e −iωt}] , (2)<br />
where r e = v e t and Ẽ is the plasmon field of the particle. In EELS, an electron both excites and probes plasmons,<br />
producing an efficiency map. A strong spatial dependence in Eqn. (1) results in a significant excitation of<br />
plasmon only when the electron trajectory is very close to the plasmon mode. The angular dependence of the<br />
radial component allows excitations of the plasmon modes of an antisymmetric field when the electron impinges<br />
inside the particle, unlike light which, in the Rayleigh regime, can only excite a dipole mode. 24<br />
Proc. of SPIE Vol. 8845 884506-2
2.2 <strong>Photon</strong>-electron coupling<br />
Contrastingly, in PINEM (see Fig. 1), plasmons are excited by the linearly-polarized planar wave incident light<br />
of<br />
[<br />
]<br />
Ẽ p (⃗r, t) = Ẽ0ˆx (z − c (t + τ))2<br />
exp [i (k p z − ω p t)] exp −<br />
4c 2 σt 2 , (3)<br />
p<br />
where σt p is the photon duration, and τ is the delay between electron and photon pulses, and electrons interact<br />
with the plasmon fields and gain and/or lose multiple light quanta, n¯hω p . A detailed derivation of the transition<br />
probability of PINEM in a non-relativistic formulation was given in Ref. 30 and summarized in Ref. 32, where<br />
the time-dependent 1D Schrödinger equation of a free electron under a scattered electromagnetic wave was<br />
analytically solved to first order. The relativistic formulation was also given in Ref. 32, and it was shown that<br />
the PINEM probability in a non-relativistic formulation is, to first order, equivalent to that in a relativistic<br />
formulation as long as the relativistic velocity of an electron is used. The temporal filter aspect of PINEM was<br />
given in Ref. 33 and utilized to characterize the temporal spread and the energy-time correlation of an electron<br />
pulse in Ref. 34.<br />
When the total density of a propagating electron packet is given by P e (z ′ ) on a moving frame, z ′ ≡ z − v e t,<br />
the electron density in the nth order state becomes<br />
and the nth order transition probability, Q n , is given by<br />
Q n (z ′ ; τ) = |ξ n | 2<br />
⎛ ⎞<br />
ξ n (z ′ ; τ) = ⎝ ˜F 0<br />
∣ ˜F<br />
∣⎠<br />
∣∣<br />
0<br />
P n (z ′ ) = P e (z ′ ) Q n (z ′ ; τ) (4)<br />
n<br />
⎧ ⎨ e<br />
J n<br />
⎩ − ∣ ˜F<br />
∣ ∣∣ [<br />
0<br />
exp − (z′ − v e τ) 2<br />
¯hω p 4veσt 2 2 p<br />
] ⎫ ⎬<br />
⎭ , (5)<br />
where −e is the electron charge, and J n is Bessel function of the first kind. The exponential function describes<br />
the overlapping of electrons with the incident light pulse at the position of particle, z = 0, in a slowly-varying<br />
envelope approximation. 30 For a weak interaction, we obtain Q +1 ∝ ∣ ˜F<br />
∣ 2 (<br />
because J n (Ω) ≈ 1 Ω<br />
) n<br />
n! 2 for a small<br />
argument. The field integral, ˜F , is defined as<br />
∫ +∞<br />
˜F (x, y) ≡ v e dt ′′ Ẽ z (x, y, v e t ′′ , t ′′ ) (6)<br />
−∞<br />
which is mechanical work (per charge) performed by an electromagnetic wave (of ω p ) on a traveling electron<br />
at z ′′ ≡ v e t ′′ , and therefore equivalent to Eqn. (2). By factoring out the time dependence, e −iωpt , Eqn. (6) is<br />
reduced to<br />
∫ +∞<br />
[ ( ) ]<br />
˜F 0 (x, y) = dz ′′ Ẽ z (x, y, z ′′ ωp<br />
, 0) exp −i z ′′ (7)<br />
v e<br />
−∞<br />
which becomes the Fourier transform of the z component of the scattered electric field at a spatial frequency<br />
∆k ≡ ωp<br />
v 0<br />
.<br />
The field integral is determined by the scattered light and the electron velocity, and it describes the magnitude<br />
of photon-electron interaction. Therefore, the task of PINEM image simulation reduces to calculating the light<br />
scattering of a nanoparticle and then evaluating Eqn. (7) as a function of position, (x,y). Note that the<br />
scattered electric field is a three-component vector quantity in 3D (x, y, z) space, while the field integral is a<br />
scalar quantity of 1D (z) projectile trajectories, in 2D (x, y) subspace. Similarly, an object is a 3D distribution of<br />
density, ρ (x, y, z), while a TEM image, I (x, y), is a set of projections (integrations of electron scattering density<br />
along z) in the x-y plane.<br />
Proc. of SPIE Vol. 8845 884506-3
|E| 2<br />
Re[E x ] Im[F 0 ]<br />
|F 0 | 2<br />
x-polarized<br />
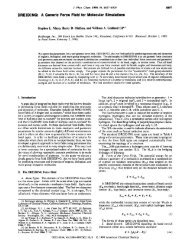
Figure 2. Scattered electric fields ( E), ⃗ field integral ( ˜F 0), and first-order transition probability ( ˛ ˜F 0˛˛˛2<br />
), for a dielectric<br />
sphere at 519 nm excitation.<br />
3. RESULT<br />
Light scattering by nanoparticles can be analytically expressed by Mie theory 35, 36 for spheres or cylinders of<br />
arbitrary sizes, and by Rayleigh dipole approximation 37, 38 for small ellipsoids. Mie theory has been extended<br />
to multilayer spheres 39 and spheres with inhomogeneous refractive indices. 40 For other geometries, numerical<br />
methods such as finite difference time domain (FDTD) approach, 41 discrete dipole approximation (DDA), 42 or<br />
boundary element method (BEM) 22, 43 can be used. Then, Eqn. (7) can be numerically evaluated with the<br />
scattered electric field calculated by the methods mentioned above.<br />
Analytical formulations of plasmon excitation by a swift electron have been studied for various geometries (see<br />
Ref. 22 and references therein). DDA and BEM can be easily modified to implement numerical simulations of<br />
such excitations for arbitrary geometries by replacing the incident light with Eqn. (1) for each electron trajectory.<br />
3.1 Sphere<br />
<strong>Near</strong> field approximation 30 of Rayleigh scattering for r > a is given by<br />
where a is the radius and χ s ≡ 3<br />
b > a as<br />
ɛ+2<br />
E x ≈ Ẽ0χ s a 3 3x2 − r 2<br />
3r 5<br />
E y ≈ Ẽ0χ s a 3 xy<br />
r 5 e−iωpt<br />
E z ≈ Ẽ0χ s a 3 zx<br />
r 5 e−iωpt ,<br />
e −iωpt<br />
(ɛ − 1). It allows one to obtain an analytical expression for Eqn. (7) for<br />
˜F 0 = −iẼ0 cos φχ s<br />
2<br />
3 a3 ∆k 2 K 1 [∆kb] , (9)<br />
where b = √ x 2 + y 2 and cos φ = x b<br />
. Fig. 2 (a) and (b) plot the scattered intensity and the electric field x<br />
component using Eqn. (8) on the x-y plane at z = 0. On the plane of z = 0, E z vanishes due to its symmetry,<br />
and E x , which is parallel to the incident light polarization, is a major component. Along the x axis at y = 0,<br />
{<br />
E x attenuates with r −3 , resulting in the decay length of δ E =<br />
lim b→a<br />
∂ log|E|<br />
∂b<br />
(8)<br />
} −1<br />
= a/3, and the intensity,<br />
I ∝ |E| 2 , has a decay length of a/6. Fig. 2 (c) and (d) plot the field integral and the first order transition<br />
probability using Eqns. (9) and (5), respectively, in the x-y plane. Eqn. (9) decays approximately reciprocally<br />
{<br />
} −1<br />
∂ log|<br />
for b > a due to the bessel function, such that its decay length becomes δ F = lim ˜F 0|<br />
b→a ∂b<br />
= a. Eqn.<br />
(7) is numerically evaluated for b < a, and it shows that the field integral monotonically decreases as b → 0 and<br />
vanishes at b = 0. The polarization angle dependence is given by cos φ in Eqn. (9), and results in a node at<br />
x = 0. Since ˜F 0 decays with a, Q +1 ∝ ∣ ˜F<br />
∣ ∣∣<br />
2<br />
0 decays with a/2.<br />
Outside the particle, ∣E<br />
⃗ ∣ 2 on the x-y plane (z = 0) and ∣ ˜F<br />
∣ ∣∣<br />
2<br />
0 are generally correlated, even though the phase<br />
of ˜F 0 does not match that of E x or E y . One may choose to compare to E z on an elevated x-y plane (z = 2a<br />
where E z shows optima), in which case the angular dependence matches but the radial dependence still deviates.<br />
As stated before, we cannot exactly compare a 3D vector quantity ( ⃗ E) and a 2D scalar quantity ( ˜F 0 ), since ˜F 0<br />
is a (Fourier component of z component) subset of ⃗ E (k).<br />
Proc. of SPIE Vol. 8845 884506-4
Q x<br />
30<br />
20<br />
10<br />
0<br />
0E+0<br />
x<br />
y<br />
1E+4<br />
top<br />
center<br />
bottom<br />
2E+4<br />
0 1 2 3 4 5<br />
photon energy (eV)<br />
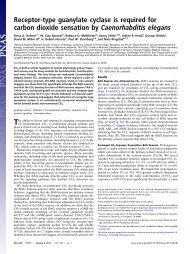
Figure 3. Optical and electric excitation efficiencies of a silver nanotriangle.<br />
Q x<br />
|E| 2<br />
Re[E // ]<br />
Im[F 0 ]<br />
|F 0 | 2<br />
x-polarized<br />
y-polarized<br />
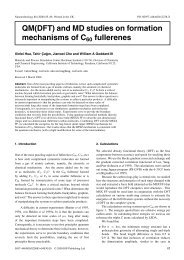
Figure 4. Scattered electric fields ( E), ⃗ field integrals ( ˜F 0), and transition probabilities ( ˛ ˜F 0˛˛˛2<br />
) for a silver nanotriangle<br />
at ŷ and ˆx polarized 519 nm excitations. Note that electric fields were Gaussian-filtered (σ = 1 pixel) to reduce DDA<br />
artifact.<br />
3.2 Triangle<br />
A silver nanotriangle of 130 nm width and 20 nm height (see Ref. 44 for the geometry) was studied using<br />
DDA simulations (with 2 nm grid size) for optical excitations. (Readers are referred to Refs. 4, 6, 5, 7, 23,<br />
and 17 for electric excitation.) Vertices and sides were rounded with a radius of curvature of 10 nm to mimic<br />
the particle studied previously. 44 Fig. 3 plots extinction efficiencies for planar wave optical excitations and<br />
for swift electron transient field excitations at top, center, and bottom of the nanotriangle. The positions of<br />
resonance peaks generally coincide, but the intensities are different. For electric excitations, the efficiency spectra<br />
strongly depend on the position of impinging electrons, as demonstrated in SI measurements. 4, 5 For planar wave<br />
excitations, polarization dependence is very small due to the three fold symmetry of the particle.<br />
Fig. 4 shows electric fields, field integral, and transition probability at 519 nm excitations. They are similar<br />
to those of a sphere in Fig. 2, except fields are concentrated around vertices. Namely, it can be regarded as<br />
a dipole mode with two vertices, or with one sharp vertex and one dull edge. Similarly, PINEM images are<br />
generally correlated to scattering intensities.<br />
Figs. 5 and 6 show scattering intensities and PINEM images at various resonance energies, respectively.<br />
582 nm resonance is dominated by a dipole excitation. 399 nm excitation exhibits a quadrupole characteristic.<br />
PINEM is stronger at edges than vertices at higher photon energies. 250 nm excitation seems to be a dipole<br />
mode. Similar to 519 nm excitation, PINEM images are generally correlated to scattering intensities at these<br />
resonance energies.<br />
STEM-EELS and EFTEM images 4, 5 always show a three-fold symmetry for a nanotriangle, because they<br />
map electric excitation efficiency and the polarization of electric transient field cannot be controlled. Polarization<br />
Proc. of SPIE Vol. 8845 884506-5
582 nm 399 nm 250 nm<br />
582 nm 399 nm 250 nm<br />
x-polarized<br />
y-polarized<br />
Figure 5. Scattering intensities of a silver nanotriangle at 582, 399, and 250 nm. Note that electric fields were Gaussianfiltered<br />
(σ = 1 pixel) to reduce DDA artifact.<br />
582 nm 399 nm 250 nm<br />
x-polarized y-polarized<br />
Figure 6. Transition probabilities of a silver nanotriangle at 582, 399, and 250 nm.<br />
dependence of PINEM images reveals more information, and PINEM images are evidently correlated to plasmon<br />
modes by optical excitations.<br />
3.3 Rod<br />
A silver nanorod of 192 nm length and 20 nm diameter (see Ref. 13 for the geometry) was studied using DDA<br />
simulations (with 1 nm grid size) for optical excitations. (Readers are referred to Refs. 13, 24, and 25 for electric<br />
excitation.) Ends were rounded with a radius of curvature of 10 nm. Fig. 7 plots extinction efficiencies for planar<br />
wave optical excitation and for swift electron transient field excitations at end, center, and side of the nanorod.<br />
Note that DDA calculations at photon energies below 1.5 eV (longer wavelength) were not carried out here due<br />
to slow convergences. The resonance peaks of two different excitations coincide at 2.5, 3.1, and 3.6 eV (which<br />
correspond to l = 3, l = 5, and l ′ = 1, respectively, where l = 1 denotes a dipole mode which shows one node<br />
in electric fields), but the electric excitation shows stronger peaks at 2.0, 2.9, and 3.2 eV. 24 Electric excitation<br />
also shows the position dependence of the efficiency spectra, resulting from the plasmon mode distribution. 13<br />
Planar wave excitation exhibits a strong anisotropy due to the geometry (large aspect ratio) of the particle such<br />
that the polarization dependence is complementary. The polarization parallel to the axis shows resonances at<br />
lower photon energies (longer wavelengths) compared to the perpendicular polarization which only shows a broad<br />
resonance at ∼3.6 eV.<br />
Fig. 8 shows electric fields, field integral, and transition probability at 519 nm excitations. Perpendicular<br />
excitation shows the same dipole excitation behavior as an infinite thin cylinder, except at truncated ends. 20<br />
nm radius of the rod is small enough to fulfill Rayleigh approximation criteria and 192 nm length is long enough<br />
to treat the middle region as an infinite cylinder. However, parallel excitation shows a multipole behavior (l = 3)<br />
Proc. of SPIE Vol. 8845 884506-6
Q x<br />
8<br />
6<br />
4<br />
2<br />
0<br />
0E+0<br />
x<br />
2E+4<br />
y<br />
cap<br />
4E+4<br />
center<br />
6E+4<br />
side<br />
8E+4<br />
0 1 2 3 4 5<br />
photon energy (eV)<br />
Figure 7. Optical and electric excitation efficiencies of a silver nanorod.<br />
|E| 2 Re[E Im[F 0 ] |F 0 | 2<br />
// ]<br />
Q x<br />
x<br />
y<br />
Figure 8. Scattered electric fields ( E), ⃗ field integral ( ˜F 0), and transition probabilities ( ˛ ˜F 0˛˛˛2<br />
) for a silver nanorod at ŷ and<br />
ˆx polarized 519 nm excitations. Note that electric fields were Gaussian-filtered (σ = 1 pixel) to reduce DDA artifact.<br />
∣<br />
with much stronger intensities in the middle. Furthermore, ∣Ẽ ∣ is dominated by Ẽx at ends, but by Ẽy in<br />
∣<br />
the middle, which results in different numbers of nodes between ∣Ẽ ∣ 2 ]<br />
and Re<br />
[Ẽx , and the PINEM image is<br />
correlated to ∣E<br />
⃗ ∣ 2 .<br />
Figs. 9 and 10 show scattering intensities and PINEM images at various resonance energies, respectively.<br />
Good correlations between scattering intensities and PINEM images are readily seen. Perpendicular excitations<br />
all show PINEM images similar to that at 519 nm, which is a dipole excitation in a cylinder. Parallel excitations<br />
show a strong wavelength dependence. In particular, 400 nm shows (linear) hexapole (l = 5) behavior, and the<br />
PINEM image shows six maxima along the rod axis. 342 nm corresponds to 3.6 eV peak in Fig. 7, which shows a<br />
strong excitation for perpendicular polarization and almost no excitation for parallel polarization. Consequently,<br />
the PINEM image for 342 nm parallel polarization shows non-resonant behavior, namely a weak dipole excitation.<br />
489 nm 400 nm<br />
342 nm 250 nm<br />
x<br />
y<br />
Figure 9. Scattering intensities of a silver nanorod at 489, 400, 342, and 250 nm. Note that electric fields were Gaussianfiltered<br />
(σ = 1 pixel) to reduce DDA artifact.<br />
489 nm 400 nm<br />
342 nm 250 nm<br />
x<br />
y<br />
Figure 10. Transition probabilities of a silver nanorod at 489, 400, 342, and 250 nm.<br />
Proc. of SPIE Vol. 8845 884506-7
4. SUMMARY<br />
Although EELS and PINEM share an equivalent probing mechanism, which is mechanical work performed by<br />
an electromagnetic field on a moving electron, their excitation mechanisms are different. The optical excitation<br />
mechanism of PINEM enables one to visualize the plasmon field in optical excitation, while EELS only produces<br />
an efficiency map of electric excitation.<br />
A silver nanorod and a silver triangle are two examples whose plasmon excitations are well studied with<br />
EELS techniques. The spatial profiles of PINEM for those geometries were investigated in relation to the<br />
plasmon scattered field. In general, it was observed that PINEM images are correlated to scattering intensities<br />
outside of particles, such that PINEM intensity is strong where the scattering intensity is strong, and it allows<br />
one to identify optical hot spots at given light polarizations.<br />
ACKNOWLEDGMENTS<br />
This work was supported by the National Science Foundation and the Air Force Office of Scientific Research in<br />
the Center for Physical Biology funded by the Gordon and Betty Moore Foundation.<br />
REFERENCES<br />
[1] Maier, S. A., [Plasmonics: Fundamentals and Applications], Springer, New York (2007).<br />
[2] Pitarke, J. M., Silkin, V. M., Chulkov, E. V., and Echenique, P. M., “Theory of surface plasmons and<br />
surface-plasmon polaritons,” Rep. Prog. Phys. 70(1), 1–87 (2007).<br />
[3] Zhang, J., Zhang, L., and Xu, W., “Surface plasmon polaritons: physics and applications,” J. Phys. D:<br />
Appl. Phys. 45(11), 113001 (2012).<br />
[4] Nelayah, J., Kociak, M., Stéphan, O., García de Abajo, F. J., Tencé, M., Henrard, L., Taverna, D., Pastoriza-<br />
Santos, I., Liz-Marzán, L. M., and Colliex, C., “Mapping surface plasmons on a single metallic nanoparticle,”<br />
Nat. Phys. 3(5), 348–353 (2007).<br />
[5] Nelayah, J., Kociak, M., Stephan, O., Geuquet, N., Henrard, L., García de Abajo, F. J., Pastoriza-Santos, I.,<br />
Liz-Marzan, L. M., and Colliex, C., “Two-dimensional quasistatic stationary short range surface plasmons<br />
in flat nanoprisms,” Nano Lett. 10(3), 902–907 (2010).<br />
[6] Nelayah, J., Gu, I., Sigle, W., Koch, C. T., Pastoriza-Santos, I., Liz-Marzán, L. M., and van Aken, P. A.,<br />
“Direct imaging of surface plasmon resonances on single triangular silver nanoprisms at optical wavelength<br />
using low-loss EFTEM imaging,” Opt. Lett. 34(7), 1003–1005 (2009).<br />
[7] Rang, M., Jones, A. C., Zhou, F., Li, Z. Y., Wiley, B. J., Xia, Y. N., and Raschke, M. B., “Optical near-field<br />
mapping of plasmonic nanoprisms,” Nano Lett. 8(10), 3357–3363 (2008).<br />
[8] Schaffer, B., Hohenester, U., Trugler, A., and Hofer, F., “High-resolution surface plasmon imaging of gold<br />
nanoparticles by energy-filtered transmission electron microscopy,” Phys. Rev. B 79(4), 041401 (2009).<br />
[9] Sigle, W., Nelayah, J., Koch, C. T., and van Aken, P. A., “<strong>Electron</strong> energy losses in Ag nanoholes-from<br />
localized surface plasmon resonances to rings of fire,” Opt. Lett. 34(14), 2150–2152 (2009).<br />
[10] Arslan, I., Hyun, J. K., Erni, R., Fairchild, M. N., Hersee, S. D., and Muller, D. A., “Using electrons as a<br />
high-resolution probe of optical modes in individual nanowires,” Nano Lett. 9(12), 4073–4077 (2009).<br />
[11] Hohenester, U., Ditlbacher, H., and Krenn, J. R., “<strong>Electron</strong>-energy-loss spectra of plasmonic nanoparticles,”<br />
Phys. Rev. Lett. 103(10), 106801 (2009).<br />
[12] Koh, A. L., Bao, K., Khan, I., Smith, W. E., Kothleitner, G., Nordlander, P., Maier, S. A., and McComb,<br />
D. W., “<strong>Electron</strong> energy-loss spectroscopy (EELS) of surface plasmons in single silver nanoparticles and<br />
dimers: Influence of beam damage and mapping of dark modes,” ACS Nano 3(10), 3015–3022 (2009).<br />
[13] Guiton, B. S., Iberi, V., Li, S. Z., Leonard, D. N., Parish, C. M., Kotula, P. G., Varela, M., Schatz, G. C.,<br />
Pennycook, S. J., and Camden, J. P., “Correlated optical measurements and plasmon mapping of silver<br />
nanorods,” Nano Lett. 11(8), 3482–3488 (2011).<br />
[14] Alber, I., Sigle, W., Muller, S., Neumann, R., Picht, O., Rauber, M., van Aken, P. A., and Toimil-Molares,<br />
M. E., “Visualization of multipolar longitudinal and transversal surface plasmon modes in nanowire dimers,”<br />
ACS Nano 5(12), 9845–9853 (2011).<br />
Proc. of SPIE Vol. 8845 884506-8
[15] Henry, A. I., Bingham, J. M., Ringe, E., Marks, L. D., Schatz, G. C., and Van Duyne, R. P., “Correlated<br />
structure and optical property studies of plasmonic nanoparticles,” J. Phys. Chem. C 115(19), 9291–9305<br />
(2011).<br />
[16] Andersen, K., Jacobsen, K. W., and Thygesen, K. S., “Spatially resolved quantum plasmon modes in<br />
metallic nano-films from first-principles,” Phys. Rev. B 86(24), 245129 (2012).<br />
[17] Blaber, M. G., Henry, A. I., Bingham, J. M., Schatz, G. C., and Van Duyne, R. P., “LSPR imaging of silver<br />
triangular nanoprisms: Correlating scattering with structure using electrodynamics for plasmon lifetime<br />
analysis,” J.Phys. Chem. C 116(1), 393–403 (2012).<br />
[18] Duan, H. G., Fernandez-Dominguez, A. I., Bosman, M., Maier, S. A., and Yang, J. K. W., “Nanoplasmonics:<br />
Classical down to the nanometer scale,” Nano Lett. 12(3), 1683–1689 (2012).<br />
[19] Edwards, P. R., Jagadamma, L. K., Bruckbauer, J., Liu, C. W., Shields, P., Allsopp, D., Wang, T., and<br />
Martin, R. W., “High-resolution cathodoluminescence hyperspectral imaging of nitride nanostructures,”<br />
Microsc. Microanal. 18(6), 1212–1219 (2012).<br />
[20] Mazzucco, S., Geuquet, N., Ye, J., Stephan, O., Van Roy, W., Van Dorpe, P., Henrard, L., and Kociak, M.,<br />
“Ultralocal modification of surface plasmons properties in silver nanocubes,” Nano Lett. 12(3), 1288–1294<br />
(2012).<br />
[21] Myroshnychenko, V., Nelayah, J., Adamo, G., Geuquet, N., Rodriguez-Fernandez, J., Pastoriza-Santos,<br />
I., MacDonald, K. F., Henrard, L., Liz-Marzan, L. M., Zheludev, N. I., Kociak, M., and García de Abajo,<br />
F. J., “Plasmon spectroscopy and imaging of individual gold nanodecahedra: A combined optical microscopy,<br />
cathodoluminescence, and electron energy-loss spectroscopy study,” Nano Lett. 12(8), 4172–4180 (2012).<br />
[22] García de Abajo, F. J., “Optical excitations in electron microscopy,” Rev. Mod. Phys. 82(1), 209–275 (2010).<br />
[23] Geuquet, N. and Henrard, L., “EELS and optical response of a noble metal nanoparticle in the frame of a<br />
discrete dipole approximation,” Ultramicroscopy 110(8), 1075–1080 (2010).<br />
[24] Bigelow, N. W., Vaschillo, A., Iberi, V., Camden, J. P., and Masiello, D. J., “Characterization of the<br />
electron- and photon-driven plasmonic excitations of metal nanorods,” ACS Nano 6(8), 7497–7504 (2012).<br />
[25] Mirsaleh-Kohan, N., Iberi, V., Simmons, P. D., Bigelow, N. W., Vaschillo, A., Rowland, M. M., Best, M. D.,<br />
Pennycook, S. J., Masiello, D. J., Guiton, B. S., and Camden, J. P., “Single-molecule surface-enhanced raman<br />
scattering: Can STEM/EELS image electromagnetic hot spots?,” J. Phys. Chem. Lett. 3(16), 2303–2309<br />
(2012).<br />
[26] García de Abajo, F. J. and Kociak, M., “<strong>Electron</strong> energy-gain spectroscopy,” New J. Phys. 10, 073035<br />
(2008).<br />
[27] Barwick, B., Flannigan, D. J., and Zewail, A. H., “<strong>Photon</strong>-induced near-field electron microscopy,” Nature<br />
462(7275), 902–906 (2009).<br />
[28] Flannigan, D. J., Barwick, B., and Zewail, A. H., “Biological imaging with 4D ultrafast electron microscopy,”<br />
Proc. Natl. Acad. Sci. USA 107(22), 9933–9937 (2010).<br />
[29] García de Abajo, F. J., Asenjo-Garcia, A., and Kocíak, M., “Multiphoton absorption and emission by<br />
interaction of swift electrons with evanescent light fields,” Nano Lett. 10(5), 1859–1863 (2010).<br />
[30] Park, S. T., Lin, M., and Zewail, A. H., “<strong>Photon</strong>-induced near-field electron microscopy (PINEM): Theoretical<br />
and experimental,” New J. Phys. 12, 123028 (2010).<br />
[31] Howie, A., “<strong>Photon</strong> interactions for electron microscopy applications,” Eur. Phys. J.-Appl. Phys. 54(3),<br />
33502 (2011).<br />
[32] Park, S. T. and Zewail, A. H., “Relativistic effects in photon-induced near-field electron microscopy,” J.<br />
Phys. Chem. A 116(46), 11128–11133 (2012).<br />
[33] Park, S. T. and Zewail, A. H., “Enhancing image contrast and slicing electron pulses in 4D near field electron<br />
microscopy,” Chem. Phys. Lett. 521, 1–6 (2012).<br />
[34] Park, S. T., Kwon, O.-H., and Zewail, A. H., “Chirped imaging pulses in four-dimensional electron microscopy:<br />
femtosecond pulsed hole burning,” New J. Phys. 14, 053046 (2012).<br />
[35] Mie, G., “Beiträge zur optik trüber medien, speziell kolloidaler metallösungen,” Ann. Phys., Berlin 25,<br />
377–445 (1908).<br />
[36] van der Hulst, H. C., [Light Scattering by Small Particles], Wiley, New York (1957).<br />
[37] Jackson, J. D., [Classical Electrodynamics], Wiley, New York (1975).<br />
Proc. of SPIE Vol. 8845 884506-9
[38] Gans, R., “Über die form ultramikroskopischer goldteilchen,” Ann. Phys. (Lepzig) 37, 881–900 (1912).<br />
[39] Johnson, B. R., “Light scattering by a multilayer sphere,” Appl. Opt. 35(18), 3286–3296 (1996).<br />
[40] Perelman, A. Y., “Scattering by particles with radially variable refractive indices,” Appl. Opt. 35(27),<br />
5452–5460 (1996).<br />
[41] Courant, R., Friedrichs, K. O., and Lewy, H., “Über die partiellen differenzengleichungen der mathematischen<br />
physik,” Math. Ann. 100(1), 32–74 (1928).<br />
[42] Draine, B. T., “The discrete-dipole approximation and its application to interstellar graphite grains,” Astrophys.<br />
J. 333(2), 848–872 (1988).<br />
[43] García de Abajo, F. J. and Howie, A., “Retarded field calculation of electron energy loss in inhomogeneous<br />
dielectrics,” Phys. Rev. B 65(11), 115418 (2002).<br />
[44] Yurtserver, A., van der Veen, R. M., and Zewail, A. H., “Subparticle ultrafast spectrum imaging in 4D<br />
electron microscopy,” Science 335(6064), 59–64 (2012).<br />
Proc. of SPIE Vol. 8845 884506-10