Zone Leveling Crystal Growth of Thermoelectric PbTe Alloys with ...
Zone Leveling Crystal Growth of Thermoelectric PbTe Alloys with ...
Zone Leveling Crystal Growth of Thermoelectric PbTe Alloys with ...

You also want an ePaper? Increase the reach of your titles
YUMPU automatically turns print PDFs into web optimized ePapers that Google loves.
Received: June 15, 2011<br />
Revised: July 26, 2011<br />
Published: August 03, 2011<br />
ARTICLE<br />
pubs.acs.org/crystal<br />
<strong>Zone</strong> <strong>Leveling</strong> <strong>Crystal</strong> <strong>Growth</strong> <strong>of</strong> <strong>Thermoelectric</strong> <strong>PbTe</strong> <strong>Alloys</strong> <strong>with</strong><br />
Sb 2Te 3 Widmanst€atten Precipitates<br />
Teruyuki Ikeda,* ,†,‡ Nathan J. Marolf, ‡ and G. Jeffrey Snyder ‡<br />
† PRESTO, Japan Science and Technology Agency, 4-1-8 Honcho, Kawaguchi, Saitama 332-0012, Japan<br />
‡ Materials Science, California Institute <strong>of</strong> Technology, 1200 California Boulevard, Pasadena, California 91125, United States<br />
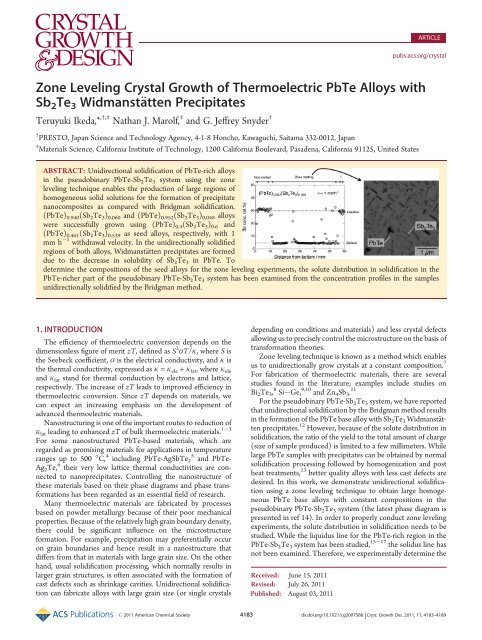
ABSTRACT: Unidirectional solidification <strong>of</strong> <strong>PbTe</strong>-rich alloys<br />
in the pseudobinary <strong>PbTe</strong>-Sb2Te3 system using the zone<br />
leveling technique enables the production <strong>of</strong> large regions <strong>of</strong><br />
homogeneous solid solutions for the formation <strong>of</strong> precipitate<br />
nanocomposites as compared <strong>with</strong> Bridgman solidification.<br />
(<strong>PbTe</strong>) 0.940(Sb 2Te 3) 0.060 and (<strong>PbTe</strong>) 0.952(Sb 2Te 3) 0.048 alloys<br />
were successfully grown using (<strong>PbTe</strong>)0.4(Sb2Te3)0.6 and<br />
(<strong>PbTe</strong>)0.461(Sb2Te3)0.539 as seed alloys, respectively, <strong>with</strong> 1<br />
mm h 1 <strong>with</strong>drawal velocity. In the unidirectionally solidified<br />
regions <strong>of</strong> both alloys, Widmanst€atten precipitates are formed<br />
due to the decrease in solubility <strong>of</strong> Sb2Te3 in <strong>PbTe</strong>. To<br />
determine the compositions <strong>of</strong> the seed alloys for the zone leveling experiments, the solute distribution in solidification in the<br />
<strong>PbTe</strong>-richer part <strong>of</strong> the pseudobinary <strong>PbTe</strong>-Sb 2Te 3 system has been examined from the concentration pr<strong>of</strong>iles in the samples<br />
unidirectionally solidified by the Bridgman method.<br />
1. INTRODUCTION<br />
The efficiency <strong>of</strong> thermoelectric conversion depends on the<br />
dimensionless figure <strong>of</strong> merit zT, defined as S 2 σT/k, where S is<br />
the Seebeck coefficient, σ is the electrical conductivity, and k is<br />
the thermal conductivity, expressed as k = kele + klat, where kele<br />
and k lat stand for thermal conduction by electrons and lattice,<br />
respectively. The increase <strong>of</strong> zT leads to improved efficiency in<br />
thermoelectric conversion. Since zT depends on materials, we<br />
can expect an increasing emphasis on the development <strong>of</strong><br />
advanced thermoelectric materials.<br />
Nanostructuring is one <strong>of</strong> the important routes to reduction <strong>of</strong><br />
1 3<br />
klat leading to enhanced zT <strong>of</strong> bulk thermoelectric materials.<br />
For some nanostructured <strong>PbTe</strong>-based materials, which are<br />
regarded as promising materials for applications in temperature<br />
ranges up to 500 °C, 4 including <strong>PbTe</strong>-AgSbTe2 5 and <strong>PbTe</strong>-<br />
Ag2Te, 6 their very low lattice thermal conductivities are connected<br />
to nanoprecipitates. Controlling the nanostructure <strong>of</strong><br />
these materials based on their phase diagrams and phase transformations<br />
has been regarded as an essential field <strong>of</strong> research.<br />
Many thermoelectric materials are fabricated by processes<br />
based on powder metallurgy because <strong>of</strong> their poor mechanical<br />
properties. Because <strong>of</strong> the relatively high grain boundary density,<br />
there could be significant influence on the microstructure<br />
formation. For example, precipitation may preferentially occur<br />
on grain boundaries and hence result in a nanostructure that<br />
differs from that in materials <strong>with</strong> large grain size. On the other<br />
hand, usual solidification processing, which normally results in<br />
larger grain structures, is <strong>of</strong>ten associated <strong>with</strong> the formation <strong>of</strong><br />
cast defects such as shrinkage cavities. Unidirectional solidification<br />
can fabricate alloys <strong>with</strong> large grain size (or single crystals<br />
depending on conditions and materials) and less crystal defects<br />
allowing us to precisely control the microstructure on the basis <strong>of</strong><br />
transformation theories.<br />
<strong>Zone</strong> leveling technique is known as a method which enables<br />
us to unidirectionally grow crystals at a constant composition. 7<br />
For fabrication <strong>of</strong> thermoelectric materials, there are several<br />
studies found in the literature; examples include studies on<br />
Bi2Te3, 8 Si Ge, 9,10 and Zn4Sb3. 11<br />
For the pseudobinary <strong>PbTe</strong>-Sb2Te3 system, we have reported<br />
that unidirectional solidification by the Bridgman method results<br />
in the formation <strong>of</strong> the <strong>PbTe</strong> base alloy <strong>with</strong> Sb2Te3 Widmanst€atten<br />
precipitates. 12 However, because <strong>of</strong> the solute distribution in<br />
solidification, the ratio <strong>of</strong> the yield to the total amount <strong>of</strong> charge<br />
(size <strong>of</strong> sample produced) is limited to a few millimeters. While<br />
large <strong>PbTe</strong> samples <strong>with</strong> precipitates can be obtained by normal<br />
solidification processing followed by homogenization and post<br />
heat treatments, 13 better quality alloys <strong>with</strong> less cast defects are<br />
desired. In this work, we demonstrate unidirectional solidification<br />
using a zone leveling technique to obtain large homogeneous<br />
<strong>PbTe</strong> base alloys <strong>with</strong> constant compositions in the<br />
pseudobinary <strong>PbTe</strong>-Sb2Te3 system (the latest phase diagram is<br />
presented in ref 14). In order to properly conduct zone leveling<br />
experiments, the solute distribution in solidification needs to be<br />
studied. While the liquidus line for the <strong>PbTe</strong>-rich region in the<br />
<strong>PbTe</strong>-Sb2Te3 system has been studied, 15 17 the solidus line has<br />
not been examined. Therefore, we experimentally determine the<br />
r 2011 American Chemical Society 4183 dx.doi.org/10.1021/cg2007588 | Cryst. <strong>Growth</strong> Des. 2011, 11, 4183–4189
<strong>Crystal</strong> <strong>Growth</strong> & Design ARTICLE<br />
solute distribution in solidification in the <strong>PbTe</strong>-rich part <strong>of</strong> the<br />
phase diagram <strong>of</strong> the <strong>PbTe</strong>-Sb 2Te 3 system as well.<br />
2. EXPERIMENTAL SECTION<br />
2.1. Determination <strong>of</strong> Solute Distribution in Solidification.<br />
Four alloys <strong>with</strong> the initial compositions listed in Table 1 were<br />
synthesized by melting Pb, Sb, and Te (99.999% purity) at 1223 K for<br />
600 s in fused quartz tubes <strong>with</strong> a 6 mm inner diameter under Ar at 3.4<br />
10 4 Pa. The compositions <strong>of</strong> these alloys are on the pseudobinary <strong>PbTe</strong>-<br />
Sb2Te3 line and in the range where the primary solidification is supposed<br />
to be <strong>with</strong> the <strong>PbTe</strong> phase. 15 Unidirectional solidification experiments<br />
by the Bridgman method were performed <strong>with</strong> 0.3 mm h 1 velocity. The<br />
alloys were lowered downward in a temperature gradient <strong>of</strong> ∼27 K<br />
mm 1 (at temperatures close to the melting temperatures). The samples<br />
were cut lengthwise in half <strong>with</strong> a diamond saw and the inner cross<br />
sections were polished <strong>with</strong> a series <strong>of</strong> SiC papers up to #800 and then<br />
polished <strong>with</strong> a series <strong>of</strong> Al 2O 3 powder (3 0.3 μm). The chemical<br />
composition was measured as a function <strong>of</strong> the distance from the bottom<br />
end <strong>of</strong> the sample using a wavelength dispersive X-ray spectrometer<br />
(WDS, JXA-8200, JEOL Ltd.) <strong>with</strong> Sb and <strong>PbTe</strong> samples as standards<br />
for ZAF correction 18 from intensities <strong>of</strong> Pb MR, SbLR, and Te LR to<br />
concentrations. The accelerating voltage was 15 kV. To determine the<br />
average composition <strong>of</strong> heterophase microstructure, which is formed by<br />
the solid-state precipitation, the probe diameter was set to 25 μm.<br />
2.2. <strong>Zone</strong> Melting Experiments. Ampules used for the zone<br />
melting experiments were prepared by the following procedure. The<br />
composition <strong>of</strong> seed alloy for each sample alloy was chosen based on the<br />
solute distribution data obtained in the former part <strong>of</strong> this work so that<br />
the primary solidification <strong>of</strong> the seed alloys occurs at the targeted<br />
compositions. By starting the zone melting experiment from the seed<br />
alloy in each experiment, the alloy <strong>with</strong> the targeted composition can be<br />
grown continuously if the unidirectional solidification proceeds <strong>with</strong><br />
single phase (zone leveling effect 7 ). The sample and seed alloys <strong>with</strong> the<br />
compositions listed in Table 2 were synthesized by melting Pb, Sb, and<br />
Table 1. Compositions <strong>of</strong> <strong>Alloys</strong> Used in Unidirectional<br />
Solidification by the Bridgman Method a<br />
sample ID<br />
initial composition<br />
(atom %)<br />
solidus composition<br />
(atom %)<br />
BM-1 Pb17.8Sb29.8Te57.4 Pb44.4Sb4.5Te51.1 (<strong>PbTe</strong>)46.2(Sb2Te3)53.8 (<strong>PbTe</strong>)95.2(Sb2Te3)4.8<br />
BM-2 Pb15.2Sb27.8Te57.0 Pb44.6Sb4.3Te51.1<br />
(<strong>PbTe</strong>)52.2(Sb2Te3)47.8<br />
(<strong>PbTe</strong>)95.4(Sb2Te3)4.6<br />
BM-3 Pb17.6Sb25.9Te56.5 Pb46.3Sb3.0Te50.7<br />
(<strong>PbTe</strong>) 57.6(Sb2Te3) 42.4 (<strong>PbTe</strong>) 96.9(Sb2Te3) 3.1<br />
BM-4 Pb20Sb24Te56 Pb46.8Sb2.5Te50.6 (<strong>PbTe</strong>) 62.5(Sb2Te3) 37.5 (<strong>PbTe</strong>) 97.4(Sb2Te3) 2.6<br />
a<br />
The right column lists the composition <strong>of</strong> primary solidification, which<br />
is regarded as solidus composition for each alloy. The compositions in<br />
pseudo-binary notation are shown in the second lines.<br />
Table 2. Conditions <strong>of</strong> the <strong>Zone</strong> Melting Experiments a<br />
Te at 1223 K for 600 s in fused quartz tubes <strong>with</strong> a 12 mm inner diameter<br />
under Ar at 3.4 10 4 Pa. The compositions <strong>of</strong> these alloys (both<br />
samples and seeds) are on the pseudobinary <strong>PbTe</strong>-Sb2Te3 line. The<br />
alloys were then smashed into small pieces.<br />
The seed alloy was sealed under Ar at 3.4 10 4 Pa in a fused quartz<br />
<strong>with</strong> 6 mm inner and 10 mm outer diameters, melted, and solidified by<br />
air-cooling. The small pieces <strong>of</strong> the sample alloy, <strong>with</strong> the targeted<br />
composition in Table 2, were then loaded into the same ampule and<br />
sealed under Ar. (The targeted composition is here defined as the<br />
composition at which the solid phase is supposed to be grown in each<br />
experiment if the unidirectional solidification proceeds <strong>with</strong> single<br />
phase. It is typically the same as the sample composition in zone leveling<br />
experiments.) The end <strong>of</strong> the ampule containing the sample alloy <strong>with</strong><br />
the targeted composition was placed into a furnace up to the point <strong>of</strong> the<br />
seed alloy at the opposite end. The sample alloy was melted and then<br />
solidified by being poured onto the top <strong>of</strong> the seed alloy by flipping the<br />
ampule upside down, followed by immediate water-quenching. The<br />
approximate weight and length are 7.5 g and 35 mm for the seed alloy<br />
(bottom) and 14.5 g and 65 mm for the sample alloy (top).<br />
The set up for the zone melting experiments is shown in Figure 1. A<br />
part <strong>of</strong> the alloy is melted by induction heating <strong>with</strong> a spiral coil (13 mm<br />
inner diameter). Upper and lower parts <strong>of</strong> the melt zone are cooled by air<br />
flow to control the length <strong>of</strong> the melt zone and enhance the steepness <strong>of</strong><br />
the temperature gradients. The heated and cooled zones are separated<br />
by fused quartz plates <strong>with</strong> 13 mm spacing. An ampule is loaded in the<br />
system so that the boundary between the seed and sample alloy is located<br />
at the position <strong>of</strong> the top fused quartz plate. The heating power is chosen<br />
so that the liquid/solid interfaces are located around the fused quartz<br />
plates. Then, the ampule is lowered downward <strong>with</strong> a constant velocity<br />
(1 or 10 mm h 1 ). During the experiment, the ampule is turned at a<br />
Figure 1. Set up for the zone melting experiments.<br />
sample ID sample composition (targeted composition) (atom %) seed composition (atom %) velocity/mm h 1<br />
ZM5.5Sb-1 Pb43.1Sb5.5Te51.4 (<strong>PbTe</strong>)0.940(Sb2Te3)0.060 none 10<br />
ZM5.5Sb-2 Pb43.1Sb5.5Te51.4 (<strong>PbTe</strong>)0.940(Sb2Te3)0.060 Pb10.5Sb31.6Te57.9 (<strong>PbTe</strong>)0.4(Sb2Te3)0.6 10<br />
ZM5.5Sb-3 Pb43.1Sb5.5Te51.4 (<strong>PbTe</strong>)0.940(Sb2Te3)0.060 Pb10.5Sb31.6Te57.9 (<strong>PbTe</strong>)0.4(Sb2Te3)0.6 1<br />
ZM4.5Sb Pb 44.4Sb 4.5Te 51.1 (<strong>PbTe</strong>) 0.952(Sb 2Te 3) 0.048 Pb 12.8Sb 29.8Te 57.4 (<strong>PbTe</strong>) 0.461(Sb 2Te 3) 0.539 1<br />
a The compositions in pseudo-binary notation are shown in the right columns.<br />
4184 dx.doi.org/10.1021/cg2007588 |Cryst. <strong>Growth</strong> Des. 2011, 11, 4183–4189
<strong>Crystal</strong> <strong>Growth</strong> & Design ARTICLE<br />
Figure 2. Concentration variation in Pb20Sb24Te56 alloy, which was unidirectionally solidified by the Bridgman method <strong>with</strong> 0.3 mm h 1 velocity. The<br />
micrographs shown in the pr<strong>of</strong>ile versus the distance from the bottom <strong>of</strong> the sample (a) show the microstructures at the corresponding positions. Panel<br />
(b) shows the ternary plot for the composition variation.<br />
constant rate. The temperature distribution is measured <strong>with</strong> an optical<br />
pyrometer (Modline 5, IRcon Corp.).<br />
After zone melting, the samples were cut lengthwise in half and<br />
the inner cross sections were prepared for microstructure observations<br />
in the same manner as mentioned above. The final polishing<br />
was done <strong>with</strong> colloidal silica (0.05 μm). The microstructure was<br />
observed using a field emission-scanning electron microscope<br />
(FE-SEM, Carl Zeiss LEO 1550 VP) equipped <strong>with</strong> a backscattered<br />
electron detector. The accelerating voltage was 20 kV. The chemical<br />
composition was measured as a function <strong>of</strong> the distance from the<br />
bottom end <strong>of</strong> the sample by WDS. To determine the average<br />
composition <strong>of</strong> heterophase microstructure, the probe diameter<br />
was set to 25 μm.<br />
3. RESULTS AND DISCUSSION<br />
3.1. Solute Distribution in Solidification. For all <strong>of</strong> the alloys<br />
used in the unidirectional solidification experiments to determine<br />
the distribution coefficient by the Bridgman method<br />
(BM-1 to 4), <strong>PbTe</strong> was crystallized at the bottom as the primary<br />
solidification phase, consistent <strong>with</strong> previous studies. 12,15<br />
Figure 2 shows an example <strong>of</strong> the concentration pr<strong>of</strong>iles <strong>of</strong> the<br />
primary solidification regions (sample: BM-4). In this sample,<br />
the Widmanst€atten structure (<strong>with</strong> <strong>PbTe</strong> matrix and Sb2Te3<br />
plate precipitates), which has been reported previously, 12 is<br />
observed in the high Sb concentration region (cSb J 3 atom<br />
%), while just a few precipitates are found in the region <strong>with</strong><br />
lower Sb concentrations. The average composition measured<br />
<strong>with</strong> 25 μm probe size, which is larger than the microstructure<br />
size, shifts monotonically to the Sb2Te3-richer direction,<br />
until “Pb 2Sb 6Te 11” is crystallized by the peritectic reaction.<br />
(The chemical formula “Pb2Sb6Te11” was first used by Abrikosov<br />
et al. 15 However, the crystal structure has been reported to be<br />
PbSb2Te4. 19 Therefore, quotation marks are used for this<br />
chemical formula in this paper.) The bottom end <strong>of</strong> the alloy is<br />
crystallized when the majority <strong>of</strong> the alloy is still in the liquid<br />
state <strong>with</strong> the composition very close to the initial composition.<br />
Therefore, if the chemical diffusion in cooling after solidification<br />
does not affect the compositional variation reflecting<br />
the solute distribution much, the composition at the bottom<br />
end is regarded as the solidus composition against the liquidus<br />
Figure 3. Temperature variation <strong>with</strong> time evaluated from the temperature<br />
distribution in the furnace and the velocity <strong>of</strong> sample <strong>with</strong>drawal<br />
in the unidirectional solidification by the Bridgman method.<br />
composition which equals the initial composition <strong>of</strong> the alloy.<br />
Figure 3 shows the temperature variation <strong>with</strong> time at a constant<br />
position in a sample during the unidirectional solidification,<br />
evaluated from the temperature distribution and the velocity <strong>of</strong><br />
the sample. On the basis <strong>of</strong> the cooling curve, the diffusion distance<br />
x is roughly estimated to be ∼10 μmusingx =( R 0 t∞ D(t)dt) 1/2 ,<br />
where D(t) is the diffusivity <strong>of</strong> atoms which depends on temperatureandhencetimet.<br />
In the estimation, the diffusion coefficient<br />
<strong>of</strong> Sb in <strong>PbTe</strong> 20 was used. Thus, the diffusion distance is much<br />
smaller than the length scale <strong>of</strong> the compositional variation due<br />
to the solute distribution in solidification (Figure 2), allowing us to<br />
determine the primary solidification composition as that at the<br />
bottom. Figure 4 plots the Sb concentration <strong>of</strong> the solidus<br />
against the initial Sb concentration in the alloy. The numerical<br />
4185 dx.doi.org/10.1021/cg2007588 |Cryst. <strong>Growth</strong> Des. 2011, 11, 4183–4189
<strong>Crystal</strong> <strong>Growth</strong> & Design ARTICLE<br />
Figure 4. The relation between the initial sample composition<br />
(BM-1 to BM-4) and the composition where the primary solidification<br />
occurs (solidus composition). The line drawn in the graph is a guide for<br />
the eyes.<br />
Figure 5. Microstructure <strong>of</strong> Pb43.1Sb5.5Te51.4 alloy before the zone<br />
melting experiment <strong>of</strong> ZM5.5Sb-1.<br />
dataaregiveninTable1.TheSbconcentration increases by increasing<br />
the initial Sb concentration as expected.<br />
3.2. <strong>Zone</strong> <strong>Leveling</strong> Effect. Before zone melting experiments,<br />
the samples are solidified by pouring onto the top <strong>of</strong> the seed<br />
materials and immediate water-quenching <strong>of</strong> the entire ampules.<br />
After this process, the microstructure is dendritic as shown in<br />
Figure 5. The size scale <strong>of</strong> the dendrite structure is tens <strong>of</strong><br />
micrometers in the order <strong>of</strong> magnitude.<br />
Figure 6 shows the microstructure <strong>of</strong> zone-melted alloys. In<br />
each row in the figure, the image on the right-hand side shows the<br />
microstructure taken <strong>with</strong> higher magnification than those on the<br />
left-hand side. The compositional variation in the alloys, measured<br />
<strong>with</strong> a 25 μm probe, is plotted as a function <strong>of</strong> the distance<br />
from the bottom end in Figure 7.<br />
Without a seed material (ZM5.5Sb-1, Figure 7a), the solute was<br />
diluted by the zone refining effect. The velocity <strong>of</strong> the sample<br />
<strong>with</strong>drawal is 10 mm h 1 . The solute concentration (m ð1Þ<br />
vc0 Dk0<br />
where G, v, c0, m, k0, and D are the temperature gradient,<br />
solidification velocity, targeted composition, tangential slope <strong>of</strong><br />
liquidus, distribution coefficient, and diffusion coefficient <strong>of</strong> solute,<br />
respectively. For a given composition in a given material system,<br />
what can readily be manipulated is G or v. In the next experiment, v<br />
is reduced to 1 mm h 1 .<br />
With the decreased velocity 1 mm h 1 and the same seed<br />
sample as ZM5.5Sb-2, the concentration <strong>of</strong> the solute is held<br />
close to the targeted level in large portions <strong>of</strong> the zone melted<br />
region (ZM5.5Sb-3, Figure 7c) suggesting that the velocity <strong>of</strong> 1<br />
mm h 1 is slow enough to allow the solute elements to diffuse<br />
well in the melt zone. This makes the gradient <strong>of</strong> the solute<br />
concentration so small that the condition expressed by eq 1 is<br />
satisfied. From this experimental fact, the diffusion coefficient <strong>of</strong><br />
solute in liquid can roughly be estimated to be 10 8 10 7 m 2 /s<br />
4186 dx.doi.org/10.1021/cg2007588 |Cryst. <strong>Growth</strong> Des. 2011, 11, 4183–4189
<strong>Crystal</strong> <strong>Growth</strong> & Design ARTICLE<br />
Figure 7. Concentration pr<strong>of</strong>iles after zone melting experiments <strong>of</strong> ZM5.5Sb-1 (a), ZM5.5Sb-2 (b), ZM5.5Sb-3 (c), and ZM4.5Sb (d). The zone<br />
melted region is indicated at the top <strong>of</strong> each graph.<br />
Figure 8. A “Pb2Sb6Te11 band” <strong>with</strong> <strong>PbTe</strong> dendrites observed in<br />
ZM5.5Sb-3.<br />
since the range <strong>of</strong> D is derived from eq 1 as v 1c 0m(1 k 0)/k 0/<br />
G < D < v2c0m(1 k0)/k0/G, wherev1 and v2 are 1 and<br />
10 mm h 1 . In the estimation, the following parameters were<br />
used: c 0 = 5.5 atom % Sb, k 0 = 0.17, G =1 10 K mm 1 ,andm ∼ 10.<br />
Here, k0 was calculated as the ratio <strong>of</strong> the solidus to the liquidus<br />
(5.5 to 31.5 atom % Sb), and m was roughly estimated from the previous<br />
phase diagram. 15 The diffusion coefficients in liquid metals<br />
typically fall into the range <strong>with</strong>in an order from 5 10 9 m 2 s 1 . 22<br />
The diffusivity we obtain here agrees <strong>with</strong> this empirical law.<br />
As Figure 7c shows, the alloy is partly solidified <strong>with</strong> the<br />
composition <strong>of</strong> the seed material. The microstructure <strong>of</strong> such<br />
regions is shown in Figure 8. The region <strong>with</strong> the seed material<br />
(Pb10.5Sb31.6Te57.9) formsa“band” perpendicularly to the <strong>with</strong>drawal<br />
direction, in which the solidification microstructure is<br />
similar to that previously observed in a solidification study <strong>with</strong><br />
higher cooling rates (air- or water-cooling). 23 Therefore, such<br />
regions were presumably solidified <strong>with</strong> higher cooling rates than<br />
other regions. Because the composition <strong>of</strong> liquidus in equilibrium<br />
<strong>with</strong> the targeted composition (∼5.5 atom % Sb) is close to the<br />
peritectic composition (∼32 atom % Sb 15 ), supercooling due to a<br />
higher cooling rate could result in the solidification <strong>with</strong> the<br />
peritectic phase “Pb2Sb6Te11”.Thefluctuation <strong>of</strong> the cooling rates<br />
is attributed to the temperature instability, which could be related<br />
to the variation in the heating efficiency, reflecting the existence <strong>of</strong><br />
such crystal defects as cracks in the solid part <strong>of</strong> the samples.<br />
To avoid the formation <strong>of</strong> the peritectic phase, the temperature<br />
<strong>of</strong> the melt zone should be controlled in a more stable fashion<br />
(i.e., using a susceptor) or the melt composition in equilibrium<br />
<strong>with</strong> the targeted composition has to be farther from the<br />
4187 dx.doi.org/10.1021/cg2007588 |Cryst. <strong>Growth</strong> Des. 2011, 11, 4183–4189
<strong>Crystal</strong> <strong>Growth</strong> & Design ARTICLE<br />
Figure 9. Area per unit volume <strong>of</strong> the plate precipitates <strong>of</strong> ZM4.5Sb<br />
(4.5 atom % Sb) and ZM5.5Sb-3 (5.5 atom % Sb) compared <strong>with</strong> that <strong>of</strong><br />
alloys cooled <strong>with</strong> constant rates after homogenization. 13 Error range<br />
corresponds to statistic errors from analyses <strong>of</strong> multiple images.<br />
peritectic composition so that the solidification temperature at<br />
the targeted composition will be increased. The sample composition<br />
<strong>of</strong> ZM4.5Sb (∼4.5 atom % Sb) is in equilibrium <strong>with</strong> the<br />
liquid <strong>with</strong> the composition ∼29.8 atom % Sb, which is farther<br />
from the peritectic composition (∼32 atom % Sb) than that the<br />
liquid which ZM5.5Sb (∼5.5 atom % Sb) is in equilibrium <strong>with</strong><br />
(∼31.6 atom % Sb), as seen in Figure 4. A zone leveling<br />
experiment for ZM4.5Sb was performed using the seed material<br />
<strong>with</strong> the ∼29.8 atom % Sb composition. As Figures 6d and 7d<br />
show, the alloy <strong>with</strong> the ∼29.8 atom % Sb composition works<br />
well as the seed alloy for ZM4.5Sb. At this composition, an<br />
almost homogeneous alloy <strong>with</strong> the targeted composition was<br />
obtained except for only a few bands <strong>of</strong> the peritectic phase.<br />
3.3. Formation <strong>of</strong> Widmanst€atten Precipitates. The regions<br />
<strong>with</strong> the targeted compositions are uniformly formed <strong>of</strong> Widmanst€atten<br />
precipitates <strong>of</strong> Sb2Te3 both in ZM5.5Sb-3 and<br />
ZM4.5Sb as shown in Figure 6, panels c 0 and d 0 , respectively.<br />
The formation <strong>of</strong> the precipitates in the solid state is due to the<br />
decrease in the solubility <strong>of</strong> Sb2Te3 in <strong>PbTe</strong>. 12 The temperature<br />
gradient measured in the solid phase where the solidification<br />
interface has passed is 30 40 K mm 1 . From this temperature<br />
gradient and the velocity <strong>of</strong> 1 mm h 1 , the cooling rate is<br />
estimated to be 30 40 K h 1 . The micrographs taken by<br />
scanning electron microscopy were digitally analyzed in the<br />
way proposed in the previous work 13 to obtain the area per unit<br />
volume <strong>of</strong> the plate precipitates as shown in Figure 9. The results<br />
in this work agree in terms <strong>of</strong> the size scales <strong>of</strong> precipitates <strong>with</strong><br />
those presented for the samples which were cooled in electrical<br />
furnaces after homogenization annealing 13 <strong>with</strong>in error ranges.<br />
The relatively large error ranges could be attributed to the<br />
temperature instability. In previous work, it was concluded that<br />
the size scale <strong>of</strong> Widmanst€atten precipitates can be regulated by<br />
controlling the rate <strong>of</strong> cooling or by modifying composition. The<br />
same method could be used to control the size <strong>of</strong> precipitates in a<br />
zone leveling method; the cooling rates can be regulated through<br />
the control <strong>of</strong> the <strong>with</strong>drawal velocity <strong>of</strong> the material or temperature<br />
gradient. It should be noted, however, that there is a<br />
limit in velocity if the formation <strong>of</strong> dendrites needs to be avoided<br />
as discussed above.<br />
It has been recognized that the formation <strong>of</strong> nanoprecipitates<br />
is effective for the reduction <strong>of</strong> the lattice thermal conductivity <strong>of</strong><br />
thermoelectric materials. Since solid-state precipitation behavior<br />
is affected by the existence <strong>of</strong> grain boundaries, it is preferable to<br />
prepare samples <strong>with</strong> large grains by solidification processing in<br />
order to control the size scale <strong>of</strong> precipitates precisely. The<br />
advantage <strong>of</strong> the samples fabricated by the zone leveling technique<br />
is that they do not contain shrinkage cavities as much as<br />
those prepared by the normal solidification method since they<br />
are grown unidirectionally so that the degradation <strong>of</strong> mechanical<br />
and thermoelectric properties by the formation <strong>of</strong> cavities could<br />
be avoided.<br />
4. CONCLUSIONS<br />
<strong>Zone</strong> leveling is an ideal method to produce large homogeneous<br />
regions <strong>of</strong> supersaturated solid solutions for the formation <strong>of</strong><br />
nanoscale precipitation composites. The solute distribution in<br />
solidification in the <strong>PbTe</strong>-richer part <strong>of</strong> the pseudobinary <strong>PbTe</strong>-<br />
Sb2Te3 system has been determined from the concentration<br />
pr<strong>of</strong>iles in the samples unidirectionally solidified by the Bridgman<br />
method. On the basis <strong>of</strong> the solute distribution, seed alloys <strong>of</strong> zone<br />
leveling experiments have been chosen: Pb10.5Sb31.6Te57.9 seed to<br />
grow Pb43.1Sb5.5Te51.4 and Pb12.8Sb29.8Te57.4 seed to grow<br />
Pb44.4Sb4.5Te51.1. <strong>Zone</strong> melting <strong>with</strong> the sample and seed alloy<br />
combinations and <strong>with</strong> 1 mm h 1 <strong>with</strong>drawal velocity results in the<br />
formation <strong>of</strong> homogeneous primary solidification <strong>with</strong> <strong>PbTe</strong><br />
crystal <strong>with</strong> the targeted concentrations <strong>of</strong> the solute. Sb2Te3 Widmanst€atten precipitates form in <strong>PbTe</strong> during cooling in zone<br />
melting experiments due to the decrease in the solubility <strong>of</strong> Sb2Te3<br />
in <strong>PbTe</strong> <strong>with</strong> temperature.<br />
’ AUTHOR INFORMATION<br />
Corresponding Author<br />
*Tel.: +1-626-395-4814. Fax: +1-626-395-8868. E-mail: tikeda@<br />
caltech.edu.<br />
’ ACKNOWLEDGMENT<br />
This work was funded by the PRESTO program (PRESTO:<br />
Precursory Research for Embryonic Science and Technology) <strong>of</strong><br />
Japan Science and Technology Agency. Microscopy facilities are<br />
supported by NSF CSEM MRSEC at Caltech.<br />
’ REFERENCES<br />
(1) Snyder, G. J.; Toberer, E. S. Nat. Mater. 2008, 7, 105–114.<br />
(2) Medlin, D. L.; Snyder, G. J. Curr. Opin. Colloid Interface Sci. 2009,<br />
14, 226–235.<br />
(3) Kanatzidis, M. G. Chem. Mater. 2010, 22, 648–659.<br />
(4) Wood, C. Rep. Prog. Phys. 1988, 51, 459–539.<br />
(5) Hsu, K. F.; Loo, S.; Guo, F.; Chen, W.; Dyck, J. S.; Uher, C.;<br />
Hogan, T.; Polychroniadis, E. K.; Kanatzidis, M. G. Science 2004,<br />
303, 818–821.<br />
(6) Pei, Y.; Lensch-Falk, J.; Toberer, E. S.; Medlin, D. L.; Snyder,<br />
G. J. Adv. Funct. Mater. 2011, 21, 241–249.<br />
(7) Pfann, W. G. <strong>Zone</strong> Melting; John Wiley and Sons, Inc: New York,<br />
1958.<br />
(8) Ha, H. P.; Hyun, D. B.; Byun, J. Y.; Oh, Y. J.; Yoon, E. P. J. Mater.<br />
Sci. 2002, 37, 4691–4696.<br />
(9) Dismukes, J. P.; Ekstrom, L.; Steigmeier, E. F.; Kudman, I.; Beers,<br />
D. S. J. Appl. Phys. 1964, 35, 2899.<br />
(10) Vining, C. B.; Laskow, W.; Hanson, J. O.; Van der Beck, R. R.;<br />
Gorsuch, P. D. J. Appl. Phys. 1991, 69, 4333–4340.<br />
(11) Pedersen, B. L.; Iversen, B. B. Appl. Phys. Lett. 2008, 92, 161907.<br />
4188 dx.doi.org/10.1021/cg2007588 |Cryst. <strong>Growth</strong> Des. 2011, 11, 4183–4189
<strong>Crystal</strong> <strong>Growth</strong> & Design ARTICLE<br />
(12) Ikeda, T.; Ravi, V. A.; Snyder, G. J. Acta Mater. 2009, 57<br />
666–672.<br />
(13) Ikeda, T.; Marolf, N. J.; Bergum, K.; Toussaint, M. B.; Heinz,<br />
N. A.; Ravi, V. A.; Snyder, G. J. Acta Mater. 2011, 59, 2679–2692.<br />
(14) Ikeda, T.; Snyder, G. J. Mater. Res. Soc. Symp. Proc. 2010,<br />
1267, DD06–07.<br />
(15) Abrikosov, N. K.; Elagina, E. I.; Popova, M. A. Inorg. Mater.<br />
1965, 1, 1944–1946.<br />
(16) Hirai, T.; Takeda, Y.; Kurata, K. J. Less-Common Met. 1967, 13<br />
352–356.<br />
(17) Reynolds, R. A. J. Electrochem. Soc. 1967, 114, 526–529.<br />
(18) Flewitt, P. E. J.; Wild, R. K. Physical Methods for Materials<br />
Characterization; Institute <strong>of</strong> Physics Publishing: Bristol and Philadelphia,<br />
1994.<br />
(19) Shelimova, L. E.; Karpinskii, O. G.; Svechnikova, T. E.; Avilov,<br />
E. S.; Kretova, M. A.; Zemskov, V. S. Inorg. Mater. 2004, 40, 1264–1270.<br />
(20) Boltaks, B. I.; Makhov, Y. N. Sov. Phys.-Techn. Phys. 1958, 3<br />
974–977.<br />
(21) Rutter, J. W.; Chalmers, B. Can. J. Phys. 1953, 31, 15–39.<br />
(22) Chalmers, B. Principle <strong>of</strong> Solidification; Wiley: New York, 1964.<br />
(23) Ikeda, T.; Haile, S. M.; Ravi, V. A.; Azizgolshani, H.; Gascoin, F.;<br />
Snyder, G. J. Acta Mater. 2007, 55, 1227–1239.<br />
4189 dx.doi.org/10.1021/cg2007588 |Cryst. <strong>Growth</strong> Des. 2011, 11, 4183–4189