Download the pdf - Global Footprint Network
Download the pdf - Global Footprint Network
Download the pdf - Global Footprint Network

You also want an ePaper? Increase the reach of your titles
YUMPU automatically turns print PDFs into web optimized ePapers that Google loves.
32<br />
State of key ecosystems<br />
40%<br />
oveR 40% oF<br />
<strong>the</strong> CoRAL<br />
ReeFs AnD<br />
MAngRoves oF<br />
<strong>the</strong> RegIon hAve<br />
DIsAPPeAReD<br />
oveR <strong>the</strong> LAst<br />
40 YeARs<br />
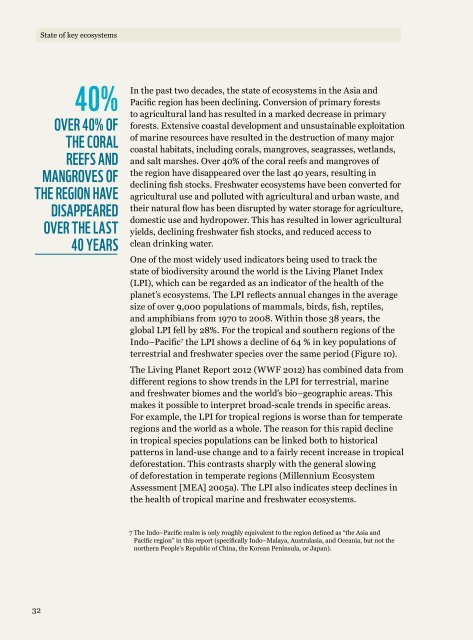
In <strong>the</strong> past two decades, <strong>the</strong> state of ecosystems in <strong>the</strong> Asia and<br />
Pacific region has been declining. Conversion of primary forests<br />
to agricultural land has resulted in a marked decrease in primary<br />
forests. Extensive coastal development and unsustainable exploitation<br />
of marine resources have resulted in <strong>the</strong> destruction of many major<br />
coastal habitats, including corals, mangroves, seagrasses, wetlands,<br />
and salt marshes. Over 40% of <strong>the</strong> coral reefs and mangroves of<br />
<strong>the</strong> region have disappeared over <strong>the</strong> last 40 years, resulting in<br />
declining fish stocks. Freshwater ecosystems have been converted for<br />
agricultural use and polluted with agricultural and urban waste, and<br />
<strong>the</strong>ir natural flow has been disrupted by water storage for agriculture,<br />
domestic use and hydropower. This has resulted in lower agricultural<br />
yields, declining freshwater fish stocks, and reduced access to<br />
clean drinking water.<br />
One of <strong>the</strong> most widely used indicators being used to track <strong>the</strong><br />
state of biodiversity around <strong>the</strong> world is <strong>the</strong> Living Planet Index<br />
(LPI), which can be regarded as an indicator of <strong>the</strong> health of <strong>the</strong><br />
planet’s ecosystems. The LPI reflects annual changes in <strong>the</strong> average<br />
size of over 9,000 populations of mammals, birds, fish, reptiles,<br />
and amphibians from 1970 to 2008. Within those 38 years, <strong>the</strong><br />
global LPI fell by 28%. For <strong>the</strong> tropical and sou<strong>the</strong>rn regions of <strong>the</strong><br />
Indo–Pacific 7 <strong>the</strong> LPI shows a decline of 64 % in key populations of<br />
terrestrial and freshwater species over <strong>the</strong> same period (Figure 10).<br />
The Living Planet Report 2012 (WWF 2012) has combined data from<br />
different regions to show trends in <strong>the</strong> LPI for terrestrial, marine<br />
and freshwater biomes and <strong>the</strong> world’s bio–geographic areas. This<br />
makes it possible to interpret broad-scale trends in specific areas.<br />
For example, <strong>the</strong> LPI for tropical regions is worse than for temperate<br />
regions and <strong>the</strong> world as a whole. The reason for this rapid decline<br />
in tropical species populations can be linked both to historical<br />
patterns in land-use change and to a fairly recent increase in tropical<br />
deforestation. This contrasts sharply with <strong>the</strong> general slowing<br />
of deforestation in temperate regions (Millennium Ecosystem<br />
Assessment [MEA] 2005a). The LPI also indicates steep declines in<br />
<strong>the</strong> health of tropical marine and freshwater ecosystems.<br />
7 The Indo–Pacific realm is only roughly equivalent to <strong>the</strong> region defined as “<strong>the</strong> Asia and<br />
Pacific region” in this report (specifically Indo–Malaya, Australasia, and Oceania, but not <strong>the</strong><br />
nor<strong>the</strong>rn People’s Republic of China, <strong>the</strong> Korean Peninsula, or Japan).