Bengali Report - Bengalee Association Bihar
Bengali Report - Bengalee Association Bihar
Bengali Report - Bengalee Association Bihar

Create successful ePaper yourself
Turn your PDF publications into a flip-book with our unique Google optimized e-Paper software.
CONTENTS<br />
ii<br />
Page No.<br />
List of Tables i<br />
Section I : Introduction 1-4<br />
Approach of the Survey 3<br />
Structure of the <strong>Report</strong> 4<br />
Section II : Socio-Economic Conditions of <strong>Bengali</strong> Population 5-26<br />
Structure of Sample 5<br />
Demographic Profile 6<br />
Literacy Status 9<br />
Employment Patterns 12<br />
Economic Status 15<br />
Housing Conditions 21<br />
Section III : <strong>Bengali</strong> Refugees from East Pakistan (Bangladesh) 27-33<br />
Domicile Status 27<br />
Displacement and Rehabilitation 28<br />
Caste Status 30<br />
A.K. Biswas <strong>Report</strong> 33<br />
Section IV : Conclusions 36-39<br />
Appendix A : Questionnaire for Survey 40-41<br />
Appendix B : A List of Scheduled Castes in <strong>Bihar</strong> and West Bengal 42<br />
Appendix C : <strong>Report</strong> of A.K. Biswas 43-49<br />
Appendix D : Office Order of Deputy Commissioner, East Champaran 50-51
Table 1 : Sample Size of Survey<br />
LIST OF TABLES<br />
Table 2 : Demographic Profile of <strong>Bengali</strong> Population<br />
Table 3 : Percentage Distribution of Persons (Above 6 Years) by Education Status<br />
Table 4 : Percentage Distribution of Households by the Highest Level of Literacy of<br />
Members<br />
Table 5 : Knowledge of <strong>Bengali</strong> among <strong>Bengali</strong> Population (About 6 Years)<br />
Table 6 : Percentage Distribution of <strong>Bengali</strong> Population (15 Years or above) by Occupation<br />
(Male)<br />
Table 7 : Percentage Distribution of <strong>Bengali</strong> Population (15 Years or above) by Occupation<br />
(Female)<br />
Table 8 : Percentage Distribution of Households by Their Landholding<br />
Table 9 : Leasing Out and Mortgaging of Land by Landowning Households<br />
Table 10 : Percentage Distribution of <strong>Bengali</strong> Households by the Monthly Income<br />
Table 11 : Percentage of <strong>Bengali</strong> Households by Type of Their Ration Cards<br />
Table 12 : Percentage of <strong>Bengali</strong> Households Benefited by Selected Government Welfare<br />
Programmes<br />
Table 13 : Percentage Distribution of <strong>Bengali</strong> Households by Type of Ownership of Their<br />
House<br />
Table 14 : Percentage Distribution of <strong>Bengali</strong> Households by Type of Roof and Floor of Their<br />
Dwellings<br />
Table 15 : Percentage Distribution of <strong>Bengali</strong> Households by Source of Drinking Water<br />
Table 16 : Percentage Distribution of <strong>Bengali</strong> Households by Toilet Facilities at Their House<br />
Table 17 : Percentage Distribution of <strong>Bengali</strong> Households by Availability of Electricity at Their<br />
Houses<br />
Table 18 : Percentage Distribution of <strong>Bengali</strong> Households by Their Domicile Status<br />
Table 19 : Percentage Distribution of Refugee <strong>Bengali</strong> Households by Their Year of<br />
Displacement<br />
Table 20 : Percentage Distribution of Refugee <strong>Bengali</strong> Households by Their Year of<br />
Rehabilitation<br />
Table 21 : Percentage Distribution of Refugee <strong>Bengali</strong> Households by Land Allocated to<br />
Them<br />
Table 22 : Percentage Distribution of Refugee <strong>Bengali</strong> Households by Their Caste Category<br />
According to the <strong>Bihar</strong> Caste List<br />
Table 23 : Information on Mismatch between Caste Classification of <strong>Bengali</strong> Households<br />
iii i
SECTION I<br />
INTRODUCTION<br />
The history of <strong>Bengali</strong> population in <strong>Bihar</strong> is very long. Because of their long stay in<br />
<strong>Bihar</strong>, a majority of them are indeed as <strong>Bihar</strong>i as any other, except for the distinction<br />
that their mother tongue is <strong>Bengali</strong>, not Hindi. Broadly speaking, the <strong>Bengali</strong><br />
population in <strong>Bihar</strong> can be divided into a few broad categories. The first of these<br />
covers those who have been original residents of <strong>Bihar</strong> in the districts adjacent to<br />
West Bengal, particularly in the Purnea division in north-eastern region of the state.<br />
In the second category, one may include those who have migrated to <strong>Bihar</strong>, once<br />
the colonial administration had started spreading its wings from Bengal, its initial<br />
seal. This stream of migration from Bengal had started sometime in the nineteenth<br />
century and continued till the beginning of the next century; thereafter, the state's<br />
own education system was able to produce enough number of qualified persons to<br />
fill the posts in colonial administration, arresting the trend of migration of <strong>Bengali</strong>s<br />
from Bengal to <strong>Bihar</strong>. The third category of <strong>Bengali</strong> population in <strong>Bihar</strong> includes<br />
those who have migrated to the state on their own, either before or after<br />
independence, mainly for employment opportunities. Finally, there is a large size of<br />
<strong>Bengali</strong> population in <strong>Bihar</strong> who had come here as refugees from East Pakistan<br />
(now Bangladesh), right after the partition of the country. As a part of the national<br />
policy of rehabilitation for refugees from East Pakistan, these <strong>Bengali</strong>s were actually<br />
brought to <strong>Bihar</strong> through state initiative, and they were gradually rehabilitated<br />
mostly in the districts of West Champaran and East Champaran, but some families<br />
were also rehabilitated in Purnea, Katihar and Bhagalpur. In view of this historical<br />
trend, it is obvious that, an overwhelming proportion of <strong>Bengali</strong> population in <strong>Bihar</strong><br />
are permanent residents of the state, those residing here temporarily for reasons of<br />
employment being a rather small fraction. Contrary to general impression, it should<br />
be noted that a substantial section of the <strong>Bengali</strong> population in <strong>Bihar</strong> lives in rural<br />
areas. These rural <strong>Bengali</strong> population includes those who are original residents of<br />
1
the state and the substantial number of refugee population settled in West<br />
Champaran and East Champaran.<br />
According to 2001 census, the size of the <strong>Bengali</strong> population in <strong>Bihar</strong> was 4.43 lakh,<br />
which is estimated to reach the figure of about 5.30 lakh in 2011. It is quite likely<br />
that this is an underestimate of the size of the <strong>Bengali</strong> population in <strong>Bihar</strong>, since the<br />
mother tongue of a large number of them might have been recorded as Hindi,<br />
because of certain deficiencies in census operations. An alternative estimate by<br />
knowledgeable sources puts the present size of <strong>Bengali</strong> population to be close to<br />
12 lakhs. This is indeed a believable figure, since the official records show that the<br />
number of refugee <strong>Bengali</strong>s settled in <strong>Bihar</strong> in the late fifties was close to 3.5 lakh.<br />
By now, this part of the <strong>Bengali</strong> population itself must be accounting for about 7 lakh<br />
<strong>Bengali</strong>s. Outside West Bengal and Tripura, the two states where <strong>Bengali</strong> is the<br />
principal language, the size of the <strong>Bengali</strong> population in <strong>Bihar</strong> is the third highest,<br />
only after Assam and Jharkhand. Unlike the <strong>Bengali</strong> population in some other states<br />
of India where they are found mostly in the urban areas, those residing in <strong>Bihar</strong> are<br />
found both in the rural and urban areas, as mentioned before.<br />
Since about 12 lakh <strong>Bengali</strong>s constitute only a small fraction of the total population<br />
of <strong>Bihar</strong> at 103.8 million, they are considered as a linguistic minority in the state.<br />
Presently, only one out of every 100 <strong>Bihar</strong>is is a <strong>Bengali</strong>-speaking person. As is the<br />
case with minority population anywhere, the <strong>Bengali</strong> population in <strong>Bihar</strong> also suffers<br />
from certain social and economic disadvantages. One obvious disadvantage arises<br />
from the fact that they do not enjoy the opportunity of being educated in their<br />
mother tongue, and this also often translates into cultural disadvantages for the<br />
<strong>Bengali</strong>s. Next, the overall socio-economic status of the <strong>Bengali</strong> population is also<br />
inferior to that of the general population and this has been substantiated by the<br />
results of the present survey. Finally, those refugee <strong>Bengali</strong>s who had settled in<br />
<strong>Bihar</strong> also face certain problems regarding their caste-status. This problem is rather<br />
serious since, to avail the benefits of various state government welfare<br />
2
programmes, it is now often necessary to produce a duly issued caste-certificate. In<br />
the past, the refugee <strong>Bengali</strong> population also had to face the problem of citizenship<br />
which, however, has since been solved.<br />
In the past, the <strong>Bihar</strong> <strong>Bengali</strong> <strong>Association</strong> had repeatedly approached the<br />
concerned officials of Government of <strong>Bihar</strong> to redress various difficulties faced by<br />
the <strong>Bengali</strong> population, and the state government has already taken some positive<br />
steps in that direction. However, to identify a comprehensive policy towards the<br />
<strong>Bengali</strong> population, particularly the refugee population, the Honourable Chief<br />
Minister had requested the <strong>Bihar</strong> <strong>Bengali</strong> <strong>Association</strong> to prepare a comprehensive<br />
document on their socio-economic status and the specific problems that refugee<br />
<strong>Bengali</strong> population is facing here. The <strong>Bihar</strong> <strong>Bengali</strong> <strong>Association</strong>, after agreeing to<br />
the request, had requested the <strong>Bihar</strong> State Minorities Commission for necessary<br />
help on this regard, since <strong>Bengali</strong>s form a linguistic minority in the state. The<br />
Commission, in turn, had approached the Centre for Economic Policy and Public<br />
Finance (CEPPF) at the Asian Development Research Institute (ADRI), Patna for<br />
the survey, since the organisation had done a similar survey for the Muslim<br />
population in <strong>Bihar</strong>. The purpose of the present survey is just the same, viz.,<br />
creation of an information base on <strong>Bengali</strong> population in <strong>Bihar</strong>, based on some<br />
primary data, collected from across the state.<br />
Approach of the Survey<br />
Taking into account the availability of resources, it was first decided that the sample<br />
size for the present survey will be 10,000 households. One possible approach to<br />
select the sample households was to divide it among those district where there<br />
resides a sizeable <strong>Bengali</strong> population and distribute the total sample size among<br />
those districts proportionally. One could prepare a list of such districts from the<br />
2001 census data. But such an approach would have implied rather small sample<br />
from many of the districts. It was, therefore, decided to restrict the number of<br />
districts to only 5, each of which has a very large <strong>Bengali</strong> population. Two of these<br />
3
districts are Purnea and Katihar where the <strong>Bengali</strong> population are largely original<br />
inhabitants. The next two districts were West Champaran and East Champaran<br />
where the refugees from East Pakistan (presently Bangladesh) were rehabilitated<br />
after independence, because of partition of Bengal. As mentioned before, knowing<br />
about the socio-economic conditions of this refuge population is one of the specific<br />
objectives of the survey. In all these 4 districts, the sample households were from<br />
the rural areas. Finally, it was decided to include Bhagalpur as one of the sample<br />
districts where the sample households were from Bhagalpur town, providing an<br />
information base for urban <strong>Bengali</strong> population. It should be noted here that the<br />
<strong>Bengali</strong> population in Bhagalpur town are generally old settlers.<br />
The questionnaire for the household survey (Appendix A) had included a number of<br />
enquiries, some on the individuals and others on the household. For the individuals,<br />
the survey had collected data on their sex, age, marital status, educational<br />
achievements, occupation, knowledge about their mother tongue <strong>Bengali</strong>, and<br />
whether the adults among them were listed as voters. For the household level<br />
information, the survey had tried to find out their economic status, living conditions,<br />
problems encountered in caste-classification and, finally, how complete has been<br />
the rehabilitation for the refugee households.<br />
Structure of the <strong>Report</strong><br />
After this introductory section, Section 2 of the report presents an analysis of the<br />
socio-economic conditions of the <strong>Bengali</strong> population along the characteristics that<br />
were included in the survey questionnaire. Since the refugee <strong>Bengali</strong> population<br />
faces a number of special problems regarding their rehabilitation process, Section 3<br />
tries to identify these issues, and the extent of severity of these problems. Finally,<br />
Section 4 summarises the main findings of the survey, and also records some<br />
suggestions for the state government to ameliorate the conditions of the <strong>Bengali</strong><br />
population.<br />
4
SECTION II<br />
SOCIO-ECONOMIC CONDITIONS OF BENGALI POPULATION<br />
For historical reasons, the <strong>Bengali</strong>s in <strong>Bihar</strong> constitute a rather heterogeneous<br />
population in terms of their socio-economic status. The differences are observed<br />
not only between the rural and urban areas, but among the various regions or<br />
districts as well. At one end, the households vary first in terms of their domicile<br />
status (whether original residents or came to <strong>Bihar</strong> as immigrants), and secondly,<br />
with respect to the economic opportunities that are available to them in their<br />
respective regions. This section is focused on the socio-economic status of the<br />
overall <strong>Bengali</strong> population, as well as some differences that are observed across<br />
different districts. Wherever possible, the socio-economic conditions of the <strong>Bengali</strong><br />
population has been compared with that the general population in <strong>Bihar</strong>.<br />
Structure of Sample<br />
The sample for the present survey, as mentioned before, was selected from 5<br />
districts of <strong>Bihar</strong> — Purnea, Katihar, West Champaran, East Champaran and<br />
Bhagalpur. Two of these 5 districts (Purnea and Katihar) were choosen to obtain<br />
information largely on the <strong>Bengali</strong>s who are original residents of the state; data from<br />
the next two districts (West Champaran and East Champaran) was expected to<br />
provide knowledge about the refugee <strong>Bengali</strong> population in <strong>Bihar</strong>; and finally,<br />
Bhagalpur was choosen to obtain required information on the urban <strong>Bengali</strong>s, most<br />
of whom have settled in <strong>Bihar</strong> long ago.<br />
In place of 10,000 households that was originally planned as the sample size for the<br />
survey, the Field Investigators had finally collected data from 10,536 household, the<br />
distribution of which among the 5 districts in presented in Table 1. It would have<br />
been better if the overall sample size was even more spread out among<br />
the 4 districts (Purnea, Katihar, East Champaran and Bhagalpur), at the cost of<br />
5
Districts<br />
Table 1 : Sample Size of Survey<br />
Households Persons<br />
Number Percentage Number Percentage<br />
Purnea 2192 20.8 10979 21.9<br />
Katihar 1383 13.1 5569 11.1<br />
West Champaran 4994 47.4 24517 48.8<br />
East Champaran 1642 15.6 7502 14.9<br />
Bhagalpur 325 3.1 1671 3.3<br />
All Districts 10536 100.0 50238 100.0<br />
West Champaran where the sample size was very large. But this limitation of the<br />
survey would not really affect its results, since absolute size of the sample in each<br />
district is fairly large.<br />
Demographic Profile<br />
To begin with, it is first noted from Table 2 that the average household size for the<br />
<strong>Bengali</strong> population in 4.8 persons, compared to 5.5 persons for general population<br />
in <strong>Bihar</strong>, as per the 2001 census. There could be two reasons for this demographic<br />
difference — first, the proportion of nuclear households is higher among the <strong>Bengali</strong><br />
population than among the general population and, second, the fertility rate for the<br />
<strong>Bengali</strong> population is lower compared to the general population. One should also<br />
note here that the average size of the household varies considerably among the<br />
districts, from only 4.0 persons in Katihar to 5.1 persons in Bhagalpur. That the<br />
average size of household is the highest in Bhagalpur is, of course, somewhat<br />
surprising in view of the fact that they represent the urban <strong>Bengali</strong>s.<br />
6
Districts<br />
Table 2 : Demographic Profile of <strong>Bengali</strong> Population<br />
Average<br />
Househo<br />
ld Size<br />
All Ages<br />
Sex Ratio Percentage<br />
of<br />
0-6<br />
Years<br />
7<br />
population<br />
above 60<br />
years<br />
Literacy Rate<br />
Male Female Person<br />
Purnea 5.0 920 951 6.3 78.1 68.3 73.5<br />
Katihar 4.0 932 940 5.9 91.3 76.8 79.5<br />
West Champaran 4.9 918 947 5.4 65.2 47.6 56.9<br />
East Champaran 4.6 949 945 5.4 65.7 44.4 55.9<br />
Bhagalpur 5.1 971 975 9.2 93.9 93.7 93.8<br />
All Districts 4.8 938 948 5.8 78.8 66.2 71.9<br />
<strong>Bihar</strong> 5.5 916 933 6.8 73.4 53.3 63.8<br />
The demographic profile of the <strong>Bengali</strong> population in <strong>Bihar</strong> also appears to be better<br />
than that of its general population in terms of yet another characteristics — sex ratio<br />
(Table 2). In contrast to a sex ratio of 916 females per 1000 males (for all ages) for<br />
the general population, it is a little higher at 938 females for the <strong>Bengali</strong> population.<br />
One also observes considerable inter-district variations here, Purnea recording the<br />
lowest sex ratio of 920 and Bhagalpur recording the highest sex ratio at 971. When<br />
one moves to the sex-ratio for the children in the age-group 0-6 years, it registers<br />
an improvement, both for the <strong>Bengali</strong> population (938 to 948) and the general<br />
population (916 to 933). This obviously indicates that the unfortunate<br />
social practice of gender discrimination is diminishing in <strong>Bihar</strong>, across all sections of<br />
the society.<br />
In the absence of any detailed information on the health status of the population,<br />
the present survey has found out the 'percentage of population above 60 years' as<br />
a broad indicator of its health condition (Table 2). A higher percentage figure<br />
obviously indicates higher longevity of the population and, thereby, implies relatively<br />
better health conditions for them.
According to the present survey, only 5.8 percent of the total <strong>Bengali</strong> population<br />
were above 60 years of age, the comparable figure for the general population being<br />
slightly higher at 6.8 percent, as per the 2001 census. In other words, the average<br />
8
health status of the <strong>Bengali</strong> population is probably inferior to that of the general<br />
population. It is quite possible that the urban population enjoys a relatively better<br />
health status vis-à-vis their rural counterparts, both for the <strong>Bengali</strong> and general<br />
population. At least among the <strong>Bengali</strong> urban population in Bhagalpur, the<br />
percentage of population above 66 years was substantially higher at 9.2 percent.<br />
Literacy Status<br />
In spite of the fact that a major portion of the sample households in the present<br />
survey is from rural areas where the literacy rates are usually lower, it is interesting<br />
to note that the recorded literacy rate for the surveyed <strong>Bengali</strong> population was 71.9<br />
percent, a clear 8.1 percentage point more than the literacy rate for the general<br />
population in <strong>Bihar</strong> (63.8 percent), as per 2011 census (Table 2). There were only<br />
two districts where the literacy rate of the <strong>Bengali</strong> population was found to be low —<br />
West Champaran (56.9 percent) and East Champaran (55.9 percent). As<br />
mentioned before, <strong>Bengali</strong> population residing in these two districts are generally<br />
refugees and they are indeed socially disadvantaged in many respects. It is also<br />
interesting to know that the literacy rate for the urban <strong>Bengali</strong>s is very high (93.8<br />
percent), as observed for the sample households in Bhagalpur.<br />
Apart from recording a higher literacy rate, the gender disparity in literacy rate is<br />
also noticeably lower among the <strong>Bengali</strong> population than among the general<br />
population in <strong>Bihar</strong> (Table 2). Among the <strong>Bengali</strong>s, the female literacy rate (66.2<br />
percent) is 84 percent of the male literacy rate (78.8 percent); however, among the<br />
general population, the female literacy rate (53.3 percent) is only 73 percent of the<br />
male literacy rate (73.4 percent). This lower gender disparity with respect to literacy<br />
rate is observed in all the districts, particularly in Bhagalpur where the two gender-<br />
specific literacy rates are nearly equal (93.7 and 93.9 percent, for females and<br />
males respectively).<br />
Since a person is generally defined to be literate using a very liberal criterion in<br />
most socio-economic surveys in India (including the present survey), the literacy<br />
9
ate of a population is often an insufficient indicator of its educational status. For a<br />
comprehensive idea of about the educational status of a population, one should<br />
really consider the distribution of the population in various categories of educational<br />
levels and Table 3 presents such a distribution for the <strong>Bengali</strong> population of <strong>Bihar</strong>. It<br />
is immediately observed there that a large percentage of the literate <strong>Bengali</strong>s have<br />
only marginal educational achievements, i.e., below matriculation. One cannot<br />
expect such people to derive much advantage of education through either skill<br />
formation, or wider income opportunities, or higher levels of awareness on social<br />
issues. Among the <strong>Bengali</strong> population, only 16.2 percent of the persons are seen to<br />
have passed matriculation or any other higher examinations. This is indeed a low<br />
figure, pointing to the educational disadvantaged of the <strong>Bengali</strong>s, in spite of bare<br />
literacy skills that many of them posess. As before, the educational status is the<br />
worst for the <strong>Bengali</strong> population in West Champaran and East Champaran, followed<br />
by the two north-eastern districts of Purnea and Katihar; the educational status is, of<br />
course, the best in Bhagalpur since it represents the urban <strong>Bengali</strong> population.<br />
Table 3 : Percentage Distribution of Persons (Above 6 Years) by Education Status<br />
Districts<br />
Illiterate<br />
Just<br />
Literate<br />
Percentage of Persons<br />
Literate,<br />
but below<br />
Matric<br />
10<br />
Matric, but<br />
below<br />
Graduation<br />
Graduate<br />
and<br />
above<br />
Total<br />
Purnea 18.5 43.4 18.3 14.4 5.5 100.0<br />
Katihar 15.3 46.6 15.6 17.6 5.0 100.0<br />
West Champaran 35.3 31.0 23.8 8.7 1.1 100.0<br />
East Champaran 36.8 28.4 23.6 9.5 1.6 100.0<br />
Bhagalpur 3.3 12.4 8.2 31.6 44.4 100.0<br />
All Districts 28.1 34.2 21.0 12.0 4.2 100.0<br />
As a supplementary information on the educational status of <strong>Bengali</strong> population in<br />
<strong>Bihar</strong>, Table 4 presents the percentage distribution of households by the highest
level of education of any of its members. The rationale for this information lies in the<br />
fact that it gives an estimate of 'first generation learners' in a population which, as<br />
has been underlined by many researchers, is an important challenge for the spread<br />
of literacy and education. Assuming that it is necessary for at least one member of<br />
the household to have primary education so that next generation learners can have<br />
at-home learning inputs, it is observed that only about half the <strong>Bengali</strong> households<br />
(50.2 percent) have this advantage. If one considers matriculation as the minimum<br />
level of education required to provide at-home learning inputs to young children, the<br />
proportion of households with at least one matriculate person is found to be only<br />
33.0 percent among the <strong>Bengali</strong> households. It is quite likely that, for the general<br />
population in <strong>Bihar</strong>, this advantage is even narrower, implying a larger proportion of<br />
first generation learners.<br />
Table 4 : Percentage Distribution of Households by the Highest Level of Literacy of<br />
Members<br />
Districts<br />
Illiterate<br />
Percentage of Households with highest level of literacy at<br />
Below<br />
Primary<br />
Above<br />
Primary,<br />
Below<br />
Matric<br />
11<br />
Above<br />
Matric,<br />
Below<br />
Graduate<br />
Graduate<br />
and<br />
Above<br />
Total<br />
Purnea 5.2 42.5 11.6 13.1 27.6 100.0<br />
Katihar 6.7 41.9 10.9 15.4 25.1 100.0<br />
West<br />
Champaran<br />
12.1 39.5 23.4 14.4 10.6 100.0<br />
East Champaran 10.5 46.7 14.0 18.6 10.2 100.0<br />
Bhagalpur 0.3 5.2 1.2 6.2 87.1 100.0<br />
All Districts 9.3 40.5 17.2 14.7 18.3 100.0<br />
By virtue of residing in <strong>Bihar</strong>, either as an original resident or as an immigrant, one<br />
special problem for the <strong>Bengali</strong> population in <strong>Bihar</strong> is an insufficient knowledge of<br />
<strong>Bengali</strong> language, their mother tongue. It is quite common to come across <strong>Bengali</strong>s<br />
who are literate, but their knowledge of <strong>Bengali</strong> language is very limited. This
happens because they do not have the opportunity of receiving their elementary<br />
education in <strong>Bengali</strong>; they attend schools imparting education either in Hindi, the<br />
local language, or in a limited number of cases, in English. The present survey had,<br />
therefore, tried to find out the percentage of <strong>Bengali</strong>s who can read and write<br />
<strong>Bengali</strong> language. It is obviously assumed that they all can at least speak <strong>Bengali</strong><br />
and it is a reasonable assumption. The pitiable condition of the <strong>Bengali</strong> population<br />
in this regard is presented in Table 5. As regards reading abilities, only one-third of<br />
the <strong>Bengali</strong>s are reported to be able to read the <strong>Bengali</strong> script, either with difficulty<br />
or easily. A similar situation is also observed with respect to their abilities for writing<br />
<strong>Bengali</strong> script. Among the 5 districts, the situation is the worst in West Champaran<br />
and East Champaran, it is slightly better in Purnea and Katihar, and rather<br />
satisfactory is Bhagalpur. Residing as they do in a Hind-speaking state, such<br />
absence of knowledge about their mother tongue may not be an economic<br />
disadvantage for the <strong>Bengali</strong> population, but it certainly implies a cultural<br />
deprivation for them.<br />
Table 5 : Knowledge of <strong>Bengali</strong> among <strong>Bengali</strong> Population (Above 6 Years)<br />
Districts<br />
Can't<br />
Read<br />
Reading Writing<br />
Percentage of persons who Percentage of persons who<br />
Read<br />
with<br />
difficulty<br />
Read<br />
easily<br />
12<br />
All<br />
Can't<br />
write<br />
Write<br />
with<br />
difficulty<br />
Write<br />
easily<br />
Purnea 44.8 9.2 46.0 100.0 45.2 9.0 45.8 100.0<br />
Katihar 27.2 31.6 41.2 100.0 28.4 31.4 40.1 100.0<br />
West Champaran 81.5 8.8 9.6 100.0 81.8 8.0 9.4 100.0<br />
East Champaran 83.3 6.6 10.1 100.0 83.2 6.6 10.1 100.0<br />
Bhagalpur 11.0 6.4 82.6 100.0 15.1 10.5 74.5 100.0<br />
All Districts 64.7 11.2 24.1 100.0 65.1 11.3 23.6 100.0<br />
Employment Patterns<br />
Towards knowing the employment patterns of the <strong>Bengali</strong> population of <strong>Bihar</strong>, the<br />
present survey had collected two pieces of information — work participation ratio for<br />
All
the adult population, and occupational distribution of those who are employed. Two<br />
tables present this information, separately for males (Table 6) and females<br />
(Table 7).<br />
Table 6 : Percentage Distribution of <strong>Bengali</strong> Population (15 Years or above)<br />
by Occupation (Male)<br />
Districts<br />
Work<br />
Participation<br />
Ratio<br />
Selfemployment<br />
(Agr.)<br />
Percentage of Population having the occupation of<br />
Selfemployment<br />
(Non-<br />
Agr.)<br />
13<br />
Wage<br />
Labour<br />
(Irregular)<br />
Service<br />
(Informal<br />
Sector)<br />
Service<br />
(Formal<br />
Sector)<br />
Service<br />
(Formal<br />
Government<br />
Sector)<br />
Total<br />
Purnea 54.1 25.0 30.2 35.1 4.0 3.5 2.1 100.0<br />
Katihar 55.1 15.0 30.4 38.6 2.9 5.3 7.8 100.0<br />
West Champaran 45.6 36.7 10.9 50.1 0.7 0.4 1.2 100.0<br />
East Champaran 50.8 28.8 12.2 53.7 2.8 0.8 1.7 100.0<br />
Bhagalpur 62.1 0.4 49.0 1.3 6.1 23.6 32.4 100.0<br />
All Districts 49.9 28.6 19.4 43.7 2.3 2.7 3.3 100.0<br />
Table 7 : Percentage Distribution of <strong>Bengali</strong> Population (15 Years or above) by Occupation<br />
(Female)<br />
Districts<br />
Work<br />
Participation<br />
Ratio<br />
Selfemploy<br />
ment<br />
(Agr.)<br />
Percentage of Population having the occupation of<br />
Selfemployment<br />
(Non-<br />
Agr.)<br />
Wage<br />
Labour<br />
(Irregula<br />
r)<br />
Service<br />
(Informal<br />
Sector)<br />
Service<br />
(Formal<br />
Sector)<br />
Service<br />
(Formal<br />
Government<br />
Sector)<br />
Total<br />
Purnea 10.0 49.3 13.9 27.1 1.4 1.8 6.7 100.0<br />
Katihar 10.9 6.0 25.2 29.5 5.0 11.1 23.2 100.0<br />
West Champaran 5.2 30.6 10.8 49.2 2.5 1.7 6.3 100.0<br />
East Champaran 8.9 8.1 41.6 41.3 1.3 0.3 7.4 100.0<br />
Bhagalpur 12.8 1.0 35.3 3.8 9.5 19.0 32.4 100.0<br />
All Districts 7.7 26.3 20.0 35.9 2.8 4.0 10.9 100.0
The overall work participation rate for the male <strong>Bengali</strong> population is found to be<br />
49.9 percent, which is slightly lower than the rate for the general population in <strong>Bihar</strong><br />
(47.4 percent), as per the 2001 census (Table 6). The work participation rates,<br />
however, display wide variation across the districts, ranging from only 45.6 percent<br />
in West Champaran to 62.1 percent in Bhagalpur. These differences in the work<br />
participation rates are largely attributable to the educational achievements of the<br />
adult members of the population. However, the poor economic conditions of the<br />
<strong>Bengali</strong> population is indeed reflected by the next piece of information, viz., the<br />
distribution of workers by their occupational categories. Among the 6 categories<br />
presented in the table, the most disadvantageous category is the 'irregular wage<br />
labour' and this accounts for nearly half (43.7 percent) of the male workers. From<br />
the survey, it also emerges that the second most important occupational category is<br />
self-employment in agriculture (28.6 percent). However, in view of the limited<br />
endowment of land for the <strong>Bengali</strong> households (as discussed later), even this<br />
category of occupation is not an advantageous one. In other words, only a small<br />
portion of the male <strong>Bengali</strong> workers are engaged in occupations that ensures<br />
reasonable levels of income. It is, however, interesting to note that only 3.3 percent<br />
of the male <strong>Bengali</strong> workers are employed in the government sector, by far the most<br />
advantageous occupation category.<br />
In contrast to the pattern for men, the work participation ratio of adult women<br />
<strong>Bengali</strong> population (7.7 percent) is much lower than that for the general population<br />
(18.8 percent) (Table 7). Unlike for males, the female work participation rate in<br />
regions like <strong>Bihar</strong> is dependent on several factors including land endowment,<br />
educational standards, and caste background of the individuals. In case of <strong>Bengali</strong><br />
women, their educational standards were a little higher compared to that of general<br />
women population, but their land endowment was less, and they also belonged to<br />
such castes whose women folk do not generally join workforce. As such, it is not<br />
surprising that their work participation rate is lower than that of general women<br />
population of <strong>Bihar</strong>. Among the 5 districts, the work participation rate for women<br />
14
<strong>Bengali</strong>s was found to be the highest in Bhagalpur, where they were all from the<br />
urban areas. It was the lowest in West Champaran (5.2 percent).<br />
It is also interesting to note from Table 7 that, although the work participation rate<br />
was rather low for <strong>Bengali</strong> women, those who did join the workforce are spread<br />
across several sectors, including irregular wage labour which accounted for about<br />
one-third (35.9 percent) of the <strong>Bengali</strong> women workers. Secondly, one may also<br />
note from the table that no less than 10.9 percent of the <strong>Bengali</strong> women workers<br />
are employed in formal government sector. This, as mentioned before, is a<br />
preferred occupation category. These women workers in formal government sector<br />
are concentrated in the two districts of Katihar (23.2 percent) and Bhagalpur (32.4<br />
percent). This is a rather high share and it appears that they are employed mostly<br />
as teachers, or ASHA (Accredited Social Health Associates) workers or Anganwadi<br />
Sevikas. This is likely in view of the relatively higher literacy rates among the<br />
<strong>Bengali</strong> women.<br />
Economic Status<br />
It is true that a substantial number of <strong>Bengali</strong>s in <strong>Bihar</strong> live in urban areas and they<br />
are generally well educated and are engaged in activities that bring them decent<br />
income. But, this economic image of the <strong>Bengali</strong> population is rather misleading, as<br />
a large section of the <strong>Bengali</strong>s in <strong>Bihar</strong> reside in rural areas and many of them are<br />
economically disadvantaged.<br />
Since land is the most important source of livelihood in the rural areas, it is of<br />
interest to know the land endowment of the <strong>Bengali</strong> households (Table 8). For the<br />
overall sample, it is found that nearly half of the <strong>Bengali</strong> households (49.4 percent)<br />
are landless. This landlessness is a much wider phenomenon is Purnea (85.1<br />
percent) and Katihar (72.9 percent), although a majority of the <strong>Bengali</strong> population<br />
there are original residents of <strong>Bihar</strong>; one would have expected most of these<br />
households to posess some amount of land. In case of <strong>Bengali</strong> households in West<br />
15
Champaran and East Champaran, they are relatively better off in terms of land<br />
endowment since, as a part of the rehabilitation policy of the state government,<br />
most of the refugee households were provided with some land for their livelihood.<br />
However, over the years, there must have been fragmentation of the initial holdings<br />
and, as such, the proportion of households presently having at least 2 acres of land<br />
does not exceed 10 percent in either of the districts. In other words, even among<br />
the <strong>Bengali</strong> agricultural households with some land, the majority of them are either<br />
marginal or small farmers. In any case, it is obvious that the land endowment<br />
pattern of the <strong>Bengali</strong> households are quite different in two eastern districts of<br />
Purnea and Katihar at one hand, and two western districts of West Champaran and<br />
East Champaran on the other.<br />
Districts<br />
Table 8 : Percentage Distribution of Households by Their Landholding<br />
Landless 0.1-1.0<br />
acre<br />
Percentage of Households having land<br />
1.1-2.0<br />
acre<br />
16<br />
2.1-4.0<br />
acre<br />
4.1-6.0<br />
acre<br />
More<br />
than 6.0<br />
acre<br />
Purnea 85.1 8.6 3.6 1.6 0.2 0.9 100.0<br />
Katihar 72.9 15.9 2.8 5.8 0.8 1.8 100.0<br />
West Champaran 31.0 41.9 17.4 5.5 2.9 1.3 100.0<br />
East Champaran 27.6 49.7 16.1 3.8 2.6 0.1 100.0<br />
All Districts 49.4 31.5 11.9 4.3 1.9 1.1 100.0<br />
Note : Bhagalpur is excluded from the table, since it had all urban households<br />
The difference between the two regions, however, is not just restricted to land<br />
endowment; one can also observe certain difference between the two regions with<br />
respect to management of land as well by the households (Table 9). In Purnea and<br />
Katihar, because of limited land availability and long domicile status of the <strong>Bengali</strong><br />
households, the practice of leasing out land by the landowners is very limited (less<br />
All
than 3 percent) and so is their tendency to mortgage land for obtaining loans (less<br />
than 4 percent). In contrast, the practice of leasing out land is much wider in both<br />
West Champaran (19.4 percent) and East Champaran (38.0 percent). It was also<br />
found out during the field work that these leasing practices are generally within the<br />
<strong>Bengali</strong> population. It appears that <strong>Bengali</strong> households in these two districts with<br />
relatively more amount of land lease out part of their holdings to other <strong>Bengali</strong><br />
households which are either landless or have very limited amount of land for self-<br />
cultivation. It is not the usual type of tenancy where households with large account<br />
of land lease out part of their holdings to small or medium farmers. It also appears<br />
that, for various reasons, the income from agriculture for the <strong>Bengali</strong> households is<br />
rather limited and, consequently, they often have to mortgage their land for<br />
obtaining loans. The proportion of households mortgaging land was as high as 23.5<br />
percent in West Champaran; in East Champaran it was lower at 9.6 percent.<br />
Table 9 : Leasing Out and Mortgaging of Land by Landowning Households<br />
Districts<br />
Percentage of<br />
Landowning Households<br />
Leasing<br />
out land<br />
17<br />
Mortgaging<br />
land<br />
Purnea 1.2 3.7<br />
Katihar 2.7 0.1<br />
West Champaran 19.4 23.5<br />
East Champaran 38.0 9.6<br />
All Districts 21.8 17.5<br />
Note : Bhagalpur is excluded from the table, since it had all urban households<br />
Taking into account all the sources of income, either agricultural or non-agricultural,<br />
the overall economic status of the <strong>Bengali</strong> households seems to be rather low<br />
(Table 10). More than half (56.6 percent) of the <strong>Bengali</strong> households had reported
their monthly income to be Rs. 3000 or less, which undoubtedly puts them into the<br />
category of below poverty level (BPL) households. Unfortunately, the rehabilitated<br />
refugee <strong>Bengali</strong> population in West Champaran and East Champaran are worst off<br />
in terms of income levels, in spite of their relatively better land endowments. It<br />
appears that, because of their social disadvantages in terms of literacy or caste<br />
status, they are yet to acquire enough knowledge and skill, enabling them to<br />
undertake high income occupations outside the rural economy. In analysing these<br />
income figures for <strong>Bengali</strong> households, it is pertinent to remember that the poor<br />
households usually understate their income; as such, the actual economic<br />
conditions of many of these households may be a little better. But even after making<br />
some premium for the understated income figures, it will still be rational to maintain<br />
that the overall economic status of the <strong>Bengali</strong> population in <strong>Bihar</strong> is rather low.<br />
However, as mentioned before, this economic disadvantage is limited to those<br />
<strong>Bengali</strong> households who reside in rural areas. For those <strong>Bengali</strong>s living in urban<br />
areas, the income levels are often decent, as indicated by the income figures for the<br />
sample households in Bhagalpur.<br />
Table 10 : Percentage Distribution of <strong>Bengali</strong> Households by Monthly Income<br />
Districts<br />
Less<br />
than<br />
3000<br />
Percentage of Households with monthly income of (Rs.)<br />
3001 to<br />
5000<br />
18<br />
5000 to<br />
10000<br />
10000 to<br />
10000<br />
More<br />
than<br />
15000<br />
Total<br />
Purnea 48.9 31.1 16.6 2.7 0.8 100.0<br />
Katihar 50.6 26.7 18.0 3.2 1.5 100.0<br />
West Champaran 66.6 21.0 11.5 0.6 0.3 100.0<br />
East Champaran 52.6 33.1 13.0 0.6 0.5 100.0<br />
Bhagalpur 2.2 39.7 24.0 16.3 17.8 100.0<br />
All Districts 56.6 26.0 14.3 1.9 1.1 100.0
The most substantive welfare programme of the state government for helping the<br />
economically disadvantaged population is the Public Distribution System (PDS) for<br />
foodgrains and a few other essential items of consumption. Although it is a<br />
universal programme, the real beneficiaries are those who hold a ration card which<br />
is either red (BPL household), or white (annapurna programme) or yellow (antodaya<br />
programme). The households living above poverty line (APL) are given a blue card.<br />
The distribution of ration cards of various types by the administration is beset with a<br />
number of problems in <strong>Bihar</strong>, and the situation is no different for <strong>Bengali</strong><br />
households. In spite of wide prevalence of poverty, the proportion of <strong>Bengali</strong><br />
households holding a red, yellow or white card is less than 40 percent (Table 11).<br />
Since the poverty level among the <strong>Bengali</strong> population is relatively higher in West<br />
Champaran and East Champaran, one also finds relatively more red/white/yellow<br />
cards in those districts. Yet another problem for the <strong>Bengali</strong> households vis-à-vis<br />
public distribution system is that 30.4 percent of them do not have any ration card. It<br />
is quite possible that some of these excluded households probably did not care to<br />
19
obtain a ration card, as they are high income (above poverty line or APL)<br />
households, but it is almost certain that a majority of these excluded households<br />
could not obtain a ration card of proper kind due to administrative lapses. Leaving<br />
aside Bhagalpur where BPL households are very limited, the above administrative<br />
lapse was more prominent in West Champaran and East Champaran, the two<br />
districts where poverty levels are relatively higher.<br />
Table 11 : Percentage of <strong>Bengali</strong> Households by Type of Their Ration Cards<br />
Districts<br />
APL<br />
Card<br />
(Blue)<br />
BPL<br />
Card<br />
(Red)<br />
Percentage of Households with<br />
Annapurna<br />
Card<br />
(White)<br />
20<br />
Antodaya<br />
Card<br />
(Yellow)<br />
No Card Total<br />
Purnea 56.8 27.8 0.3 2.5 12.6 100.0<br />
Katihar 40.8 25.4 0.6 4.1 29.1 100.0<br />
West Champaran 23.6 34.7 0.1 5.9 35.7 100.0<br />
East Champaran 12.8 47.3 0.1 5.1 34.8 100.0<br />
Bhagalpur 46.2 0.6 0.0 0.1 52.9 100.0<br />
All Districts 31.8 33.0 0.2 4.7 30.4 100.0<br />
The state government runs a number of other welfare programmes for the poor<br />
households, besides the public distribution system for foodgrains. Four of these<br />
additional welfare programmes are — Indira Awas Yojana (IAY), Subsidy for Toilet,<br />
Old Age Pension, and Widow Pension. Unfortunately, the reach of all these welfare<br />
programmes among the <strong>Bengali</strong> households is very limited, as revealed by the<br />
figures in Table 12. Only under the IAY programme, a small proportion of <strong>Bengali</strong><br />
households (6.4 percent) has been benefited; for the remaining three welfare<br />
programmes, their reach among the <strong>Bengali</strong> population is abysmally low. And this<br />
phenomenon of exclusion is observed in all the districts.
Table 12 : Percentage of <strong>Bengali</strong> Households Benefited by Selected Government Welfare<br />
Programmes<br />
Districts<br />
Indira<br />
Awas<br />
Yojana<br />
Percentage of Households Benefited from<br />
Subsidy<br />
for Toilet<br />
21<br />
Old Age<br />
Pension<br />
Widow<br />
Pension<br />
Kisan<br />
Credit<br />
Card<br />
Purnea 6.2 0.6 1.3 0.1 32.6<br />
Katihar 9.9 0.1 0.0 0.5 0.0<br />
West Champaran 3.0 0.2 0.1 0.1 0.0<br />
East Champaran 15.4 0.1 0.3 0.0 0.0<br />
All Districts 6.4 0.2 0.3 0.1 6.8<br />
Since agriculture happens to be the livelihood of many <strong>Bengali</strong> households in rural<br />
areas, the availability of institutional credit for farm operations is very important for<br />
them. This is not a welfare programme of the kind mentioned above, but the welfare<br />
implication of institutional credit for agricultural households is obvious. The Kisan<br />
Credit Card (KCC) is meant for such institutional credit for agriculture.<br />
Unfortunately, the coverage of KCC is extremely limited for the <strong>Bengali</strong> agricultural<br />
households. It may, however, be noted here that such limited coverage of KCC is a<br />
general phenomenon in most districts of <strong>Bihar</strong>, and it may not be related to any<br />
social background of the agricultural households. The only exception to this overall<br />
trend is the district of Purnea where no less than 32.6 percent of the households<br />
had the benefit of institutional credit through KCC.<br />
Housing Conditions<br />
From the information on landholding, monthly income, and a few other related<br />
characteristics of the <strong>Bengali</strong> population in <strong>Bihar</strong>, as discussed before, it is quite<br />
apparent that their overall economic conditions is far from comfortable. This
conclusion gets further reiterated when one looks at the housing conditions of the<br />
<strong>Bengali</strong> households. It is true that most <strong>Bengali</strong> households (94.4 percent) own their<br />
own house across all the 5 districts (Table 13), but the condition of those houses<br />
are indeed poor in terms of type of roof material, type of floor material, sources of<br />
drinking water, toilet facilities, and availability of electricity.<br />
Table 13 : Percentage Distribution of <strong>Bengali</strong> Households by Type of Ownership of Their<br />
House<br />
Districts<br />
Own House<br />
Percentage of Households Living in<br />
Rented<br />
House<br />
22<br />
Government<br />
Quarters<br />
Other<br />
Types<br />
Total<br />
Purnea 94.9 4.2 0.3 0.6 100.0<br />
Katihar 75.2 13.8 8.0 3.0 100.0<br />
West Champaran 98.5 1.1 0.0 0.3 100.0<br />
East Champaran 99.2 0.5 0.1 0.2 100.0<br />
Bhagalpur 83.4 15.1 1.2 0.3 100.0<br />
All Districts 94.4 3.8 1.2 0.7 100.0<br />
<strong>Bihar</strong> 96.8 2.1 neg. 1.1 100.0
As regards type of roof material, about half the <strong>Bengali</strong> households (46.1 percent)<br />
live in houses with thatched roofs, a cemented roof being available for only 15.2<br />
percent of the households (Table 14). In contrast, as per the 2001 census data, for<br />
the general population of <strong>Bihar</strong>, the proportion of households living in houses with<br />
thatched roof is only one-third (32.2 percent), and those with cemented roofs<br />
account for no less than 38.1 percent of the households. This clearly indicates that<br />
the economic condition of the <strong>Bengali</strong> population is inferior to that a general<br />
population of <strong>Bihar</strong>. Among the <strong>Bengali</strong> households, the housing pattern varies<br />
considerably among the 5 districts. The pattern in Bhagalpur is different because it<br />
represents an urban area and, as such, housing conditions are better there. For the<br />
remaining 4 districts, the housing conditions are much worse in the districts of West<br />
Champaran and East Champaran, compared to that in Purnea and Katihar. In terms<br />
of material for the floor, the proportion of <strong>Bengali</strong> households living in houses with<br />
Katcha floor is 81.5 percent, nearly the same for the general population in <strong>Bihar</strong><br />
(81.5 percent).<br />
Table 14 : Percentage Distribution of <strong>Bengali</strong> Households by Type of Roof and Floor of<br />
Their Dwellings<br />
Districts<br />
Percentage of Households Having Roof<br />
Thatched<br />
Tiles/<br />
Iron<br />
Sheets<br />
23<br />
Percentage of Households<br />
Having Floor<br />
Cemented Total Katcha Pucca Total<br />
Purnea 31.6 55.3 13.1 100.0 71.8 28.2 100.0<br />
Katihar 24.4 46.6 29.0 100.0 54.9 45.1 100.0<br />
West Champaran 58.7 31.9 9.4 100.0 93.6 6.4 100.0<br />
East Champaran 53.8 35.7 10.5 100.0 94.0 6.0 100.0<br />
Bhagalpur 2.2 14.2 83.7 100.0 11.4 88.6 100.0<br />
All Districts 46.1 38.7 15.2 100.0 81.5 18.5 100.0<br />
<strong>Bihar</strong> 32.2 29.7 38.1 100.0 80.5 19.5 100.0
As regards the source of drinking water for the households, the pattern varies<br />
considerably across the districts; this is very expected due to the varying<br />
hydrological conditions prevailing in different districts. In the absence of supply of<br />
piped water (available generally in urban areas), the most preferred source of<br />
drinking water in rural areas is ‘own hand pump’ and this facility is available to 67.4<br />
percent of the <strong>Bengali</strong> households (Table 15). For the other three sources of<br />
drinking water, the coverages are — common hand pump (23.2 percent), well (6.7<br />
percent), and piped water (2.7 percent). For the general population of <strong>Bihar</strong>, the<br />
sources of drinking water display a similar pattern. It may be noted here that,<br />
compared to many other regions in India, the availability of safe drinking water is<br />
relatively wider in <strong>Bihar</strong>, because the state is part of the Gangetic plane where<br />
ground water is abundant and its level is also rather high.<br />
Table 15 : Percentage Distribution of <strong>Bengali</strong> Households by Source of Drinking Water<br />
Districts<br />
Percentage of Households getting drinking water from<br />
Well<br />
Common<br />
Hand<br />
Pump<br />
24<br />
Own<br />
Hand<br />
Pump<br />
Piped<br />
Water<br />
Total<br />
Purnea 2.7 11.9 83.9 1.5 100.0<br />
Katihar 11.3 35.9 48.1 4.7 100.0<br />
West Champaran 7.6 19.5 71.6 1.3 100.0<br />
East Champaran 1.4 41.8 56.2 0.6 100.0<br />
Bhagalpur 25.8 8.9 30.2 35.1 100.0<br />
All Districts 6.7 23.2 67.4 2.7 100.0<br />
<strong>Bihar</strong> 6.0 21.6 68.0 4.4 100.0<br />
The toilet facilities available to the members of a household is another important<br />
indicator of living conditions and, as is well known, this facility is largely lacking in
most areas of <strong>Bihar</strong>, including some of the urban areas. According to 2001 census,<br />
no less than 75.8 percent of the households in <strong>Bihar</strong> used open space for toilet<br />
purposes, a private toilet being available to only 22.6 percent of the households. For<br />
the <strong>Bengali</strong> households in <strong>Bihar</strong>, the situation is seen to be better, but only slightly<br />
so (Table 16). The proportion of <strong>Bengali</strong> households using open space for toilet<br />
purposes is 61.1 percent, a high figure by any standard; similarly, the proportion of<br />
<strong>Bengali</strong> households who are fortunate to have a private toilet is only 30.2 percent,<br />
again a low figure by any standard. Thus, one may conclude that, although the<br />
availability of private toilets among the <strong>Bengali</strong> households is a little higher<br />
compared to the general population in <strong>Bihar</strong>, the proportion of <strong>Bengali</strong> households<br />
without a private toilet is still very high, indicating their poor living conditions.<br />
Table 16 : Percentage Distribution of <strong>Bengali</strong> Households by Toilet Facilities at Their<br />
House<br />
Districts<br />
Open<br />
Space<br />
Common<br />
Toilet<br />
(Dry)<br />
Percentage of Households using<br />
25<br />
Common<br />
Toilet<br />
(Flush)<br />
Own<br />
Toilet<br />
(Dry)<br />
Own<br />
Toilet<br />
(Flush)<br />
Purnea 47.2 3.6 2.8 26.9 19.5 100.0<br />
Katihar 27.9 13.4 9.9 13.3 35.5 100.0<br />
West Champaran 79.3 3.5 1.1 11.8 4.2 100.0<br />
East Champaran 69.7 4.0 0.8 21.7 3.9 100.0<br />
Bhagalpur 3.4 6.8 4.6 19.4 64.3 100.0<br />
All Districts 61.1 5.0 2.7 16.9 13.3 100.0<br />
<strong>Bihar</strong> 75.8 1.1 0.5 2.5 20.1 100.0<br />
Finally, it also emerges from the present survey that only 28.7 percent of the<br />
<strong>Bengali</strong> households in <strong>Bihar</strong> are fortunate to have electric connection in their<br />
All
houses (Table 17). Among the remaining households, there are some who reside in<br />
areas where electricity has not reached at all (30.6 percent), and the rest reside is<br />
areas where electricity has reached, but distribution lines (poles) are not there to<br />
connect the households to the power supply (40.7 percent). According to 2001<br />
census, the proportion of households having electric connection was only 16.4<br />
percent for the general population in <strong>Bihar</strong> and it may, thus, appear that the <strong>Bengali</strong><br />
households are probably better off in terms availability of electricity at home; but it is<br />
quite possible that the present penetration of power distribution lines in <strong>Bihar</strong> is<br />
much deeper than what it was more than a decade ago. One can thus only<br />
conclude that the availability of electricity to the households is rather limited in <strong>Bihar</strong><br />
and it affects equally both the general and the <strong>Bengali</strong> population.<br />
Table 17 : Percentage Distribution of <strong>Bengali</strong> Households by Availability of Electricity at<br />
Their Houses<br />
Districts<br />
No electricity<br />
(No pole<br />
nearby)<br />
Percentage of households with<br />
No electricity<br />
(other<br />
reasons)<br />
26<br />
Electric<br />
connection<br />
Purnea 14.4 17.9 67.7 100.0<br />
Katihar 46.3 13.7 40.1 100.0<br />
West Champaran 48.8 43.1 8.1 100.0<br />
East Champaran 53.3 29.3 17.4 100.0<br />
Bhagalpur 4.9 4.0 91.1 100.0<br />
All Districts 40.7 30.6 28.7 100.0<br />
<strong>Bihar</strong> 83.6 16.4 100.0<br />
All
SECTION III<br />
BENGALI REFUGEES FROM EAST PAKISTAN (BANGLADESH)<br />
At the time of independence in 1947, India was divided into two countries, Pakistan<br />
being carved out of it. In the process, two provinces, Punjab and Bengal, were also<br />
divided, Hindu-dominated areas falling in India, and those dominated by Muslims<br />
forming part of Pakistan. The process was particularly painful, since it implied<br />
displacement of a large number of families in both Punjab and Bengal. For those<br />
Hindu <strong>Bengali</strong>s who had to leave East Pakistan (now Bangladesh), the government<br />
had to undertake a massive rehabilitation programme. Since not all of them could<br />
be accommodated in West Bengal, they were moved to areas like <strong>Bihar</strong>, Madhya<br />
Pradesh, Andaman-Nicobar Islands, etc. In <strong>Bihar</strong>, they were settled mostly in old<br />
Champaran district (now dividend into two districts), but some of them were also<br />
settled in north-eastern districts of Purnea and Katihar. Unaware as they were of<br />
local conditions and local language, the process of rehabilitation was a long one for<br />
many of them, and even now these refugee <strong>Bengali</strong> population face some serious<br />
problems. This section is focused on this refugee <strong>Bengali</strong> population settled in<br />
<strong>Bihar</strong>.<br />
Domicile Status<br />
Earlier, it was mentioned that the <strong>Bengali</strong> population in <strong>Bihar</strong> is largely a<br />
heterogeneous category, comprising several sub-categories, based largely on their<br />
mode and time of arrival in <strong>Bihar</strong>. Broadly speaking, these sub-categories are— (a)<br />
original domicile of <strong>Bihar</strong>, (b) those who came as refugees and were rehabilitated<br />
by the government, (c) those who came as refugees, but were not rehabilitated, and<br />
(d) those who migrated to Bihgar on their own, either before or after independence.<br />
The distribution of the sample households among these four important groups is<br />
presented in Table 18. Since the survey had a large sample from West Champaran,<br />
no less then two-thirds (67.7 percent) of the households are refugee <strong>Bengali</strong><br />
27
households, rehabilitated in <strong>Bihar</strong>. Indeed, in West Champaran and East<br />
Champaran, nearly the entire sample consists of such households. The next<br />
important sub-category of households comprise those who had migrated on their<br />
own (17.2 percent) and they are to be found mostly in Purnea and Katihar. The<br />
remaining two sub-categories — original domicile of <strong>Bihar</strong> and unrehabilitated<br />
refugee households — are of relatively smaller in size in the sample, but they are<br />
not altogether absent in <strong>Bihar</strong>. It is also noted from Table 18 that original resident<br />
<strong>Bengali</strong> households in <strong>Bihar</strong> are concentrated in Purnea, Katihar and Bhagalpur.<br />
The remaining tables in this section is restricted to only the refugee <strong>Bengali</strong><br />
households, whether rehabilitated or not.<br />
Table 18 : Percentage Distribution of <strong>Bengali</strong> Households by Their Domicile Status<br />
Districts<br />
Original<br />
Domicile<br />
of <strong>Bihar</strong><br />
Percentage of Households<br />
Came as<br />
Refugee,<br />
and<br />
Rehabilitated<br />
Came as<br />
Refugee,<br />
but not<br />
Rehabilitated<br />
28<br />
Migrated<br />
to <strong>Bihar</strong><br />
on Their<br />
Own<br />
All<br />
Households<br />
Percenta<br />
ge of<br />
persons<br />
(18+<br />
years)<br />
Listed as<br />
Voters<br />
Purnea 3.7 16.8 20.8 58.7 100.0 86.4<br />
Katihar 36.2 24.0 10.0 29.9 100.0 72.5<br />
West Champaran 0.4 96.3 1.4 1.9 100.0 82.0<br />
East Champaran 0.0 98.8 0.9 0.2 100.0 80.3<br />
Bhagalpur 95.7 0.6 0.0 3.7 100.0 90.5<br />
All Districts 8.6 67.7 6.4 17.2 100.0 81.8<br />
Displacement and Rehabilitation<br />
To begin with, Table 19 presents the distribution of refugee <strong>Bengali</strong> households by<br />
their year of displacement. It is observed from the table that the process of<br />
displacement was most intense during the years 1956-60, when no less than 69.6<br />
percent of the households were displaced. But it also emerges from the table that<br />
the process had started earlier, right after the partition in 1947, and had also
continued for some years after 1960. Among the districts, the refugee <strong>Bengali</strong><br />
households in West Champaran and East Champaran had largely arrived in late<br />
fifties; for similar households in Purnea and Katihar, however, their year of<br />
displacement had ranged from late forties to early sixties. Thanks to the sensitive<br />
response of the state government, these refugee <strong>Bengali</strong> households were<br />
rehabilied rather quickly. The official records indicate that about 3.5 lakh <strong>Bengali</strong>s<br />
from East Pakistan were rehabilitated in <strong>Bihar</strong> and, as shown by figures in Table 20,<br />
this huge task was completed within a period of barely 2-3 years.<br />
Table 19 : Percentage Distribution of Refugee <strong>Bengali</strong> Households by Their Year of<br />
Displacement<br />
Districts<br />
Year of Displacement<br />
Upto 1950 1951-1955 1956-1960 After 1960 Total<br />
Purnea 72.2 15.2 4.0 8.7 100.0<br />
Katihar 25.6 0.0 7.9 66.7 100.0<br />
West Champaran 10.0 3.6 78.2 8.2 100.0<br />
East Champaran 0.9 0.9 94.9 3.2 100.0<br />
Bhagalpur 100.0 0.0 0.0 0.0 100.0<br />
All Districts 15.6 4.1 69.6 10.8 100.0<br />
Table 20 : Percentage Distribution of Refugee <strong>Bengali</strong> Households by Their Year of<br />
Rehabilitation<br />
Districts<br />
Year of Rehabilitation<br />
Upto 1950 1951-1955 1956-1960 After 1960 Total<br />
Purnea 70.8 16.1 4.4 8.7 100.0<br />
Katihar 25.1 0.0 0.2 74.7 100.0<br />
West Champaran 9.6 0.3 75.3 14.9 100.0<br />
East Champaran 0.8 0.2 89.6 9.4 100.0<br />
Bhagalpur 100.0 0.0 0.0 0.0 100.0<br />
All Districts 14.1 1.9 69.3 14.7 100.0<br />
29
The process of rehabilitation of the refugee <strong>Bengali</strong> households had displayed two<br />
different patterns (Table 21). In West Champaran and East Champaran, nearly all<br />
the refugee households were provided with at least 3 acres of land, which is<br />
generally considered to be adequate for efficient agricultural operations. In Purnea<br />
and Katihar, however, only some refugee <strong>Bengali</strong> households had received land<br />
from the state government, and the average amount of allocated land was much<br />
smaller than in West Champaran and East Champaran. Unfortunately, due to<br />
several social disadvantages, the refugee <strong>Bengali</strong> population in West Champaran<br />
and East Champaran has not been able to make best use of their land endowments<br />
and their present socio-economic status, as discussed in the previous section, is<br />
rather poor.<br />
Table 21 : Percentage Distribution of Refugee <strong>Bengali</strong> Households by Land Allocated to<br />
Them<br />
Districts<br />
No<br />
Land<br />
Upto<br />
1.00<br />
Land Allocated (acres)<br />
1.01 –<br />
2.00<br />
30<br />
2.01 –<br />
3.00<br />
3.00 –<br />
5.00<br />
Above<br />
5.00<br />
Total<br />
Purnea 80.9 2.8 3.8 1.8 4.0 6.7 100.0<br />
Katihar 63.0 20.4 6.4 3.6 6.6 0.0 100.0<br />
West Champaran 10.6 6.7 3.1 0.9 71.6 7.1 100.0<br />
East Champaran 1.5 0.1 0.3 0.1 88.4 9.6 100.0<br />
Bhagalpur 100.0 0.0 0.0 0.0 0.0 0.0 100.0<br />
All Districts 19.3 5.7 2.8 1.0 64.1 7.2 100.0<br />
Caste Status<br />
One of the social disadvantage of the refugee <strong>Bengali</strong> population is that they are<br />
generally from among the lower caste categories, some of them belonging to<br />
scheduled castes. Table 22 presents the distribution of refugee <strong>Bengali</strong> households<br />
by their caste category, according to the caste list of the <strong>Bihar</strong> government. For the
overall sample, it is observed that most of them (64.8 percent) belong to the<br />
category of 'extremely backward castes'. If one adds to that other socially<br />
disadvantaged categories like backward castes (12.6 percent) and scheduled<br />
castes (4.4 percent), then one can hardly find households which are generally<br />
considered to be forward castes among the refugee <strong>Bengali</strong> households. The<br />
preponderance of extremely backward or scheduled caste households is even more<br />
in the two districts of West Champaran and East Champaran. It is only in Bhagalpur<br />
where the sample comprises only urban households that one notices wide presence<br />
of forward caste households.<br />
Table 22 : Percentage Distribution of Refugee <strong>Bengali</strong> Households by Their Caste<br />
Category According to the <strong>Bihar</strong> Caste List<br />
Caste Category<br />
Purnea Katihar<br />
31<br />
Percentage of Households<br />
West<br />
Champaran<br />
East<br />
Champaran Bhagalpur<br />
All<br />
Districts<br />
General Castes 15.1 36.9 7.5 6.2 97.7 16.7<br />
Backward Castes 48.0 17.6 4.4 2.0 1.7 12.8<br />
Extremely Back. Castes 34.0 44.0 82.2 86.6 0.3 66.0<br />
Scheduled Castes 2.9 1.5 5.9 5.2 0.3 4.5<br />
Total 100.0 100.0 100.0 100.0 100.0 100.0<br />
The distribution of the refugee <strong>Bengali</strong> population by their caste categories, as<br />
presented in Table 22, is according to the caste list of the <strong>Bihar</strong> government.<br />
Unfortunately, although there are a number castes whose names appear in the list<br />
of both <strong>Bihar</strong> government and West Bengal government, the two lists are not<br />
identical. This is evident from the official list of scheduled castes in <strong>Bihar</strong> and West<br />
Bengal (Appendix B). At one hand, there are castes in West Bengal which are not<br />
to be found in <strong>Bihar</strong>; similarly, there are also castes which are categorised as<br />
scheduled caste in West Bengal, but not in <strong>Bihar</strong>, and vice versa. In this<br />
background, it is not surprising that the caste classification of the refugee <strong>Bengali</strong>
households as per the <strong>Bihar</strong> government list is not accepted by them. From the<br />
survey, it was found that, only for 63.8 percent of the refugee <strong>Bengali</strong> households,<br />
their caste names appear in the <strong>Bihar</strong> government list (Table 23). This obviously<br />
meant that 36.2 percent of the households belonged to castes which are present in<br />
West Bengal, but not in <strong>Bihar</strong>. This problem of missing caste names was of serious<br />
proportion in 4 districts, Bhagalpur being the sole exception.<br />
Table 23 : Information on Mismatch between Caste Classification of <strong>Bengali</strong> Households<br />
Information on<br />
Mismatch<br />
Percentage of <strong>Bengali</strong><br />
Households whose<br />
caste name appears in<br />
the caste list of<br />
Government of <strong>Bihar</strong><br />
Percentage of <strong>Bengali</strong><br />
Households who do<br />
not agree to their caste<br />
classification by the<br />
officials<br />
Percentage share of<br />
scheduled caste<br />
households among<br />
those who do not<br />
agree to their caste<br />
classification by the<br />
officials<br />
Purnea Katihar<br />
West<br />
Champaran<br />
32<br />
East<br />
Champaran Bhagalpur<br />
All<br />
Districts<br />
52.6 72.1 64.1 65.5 89.2 63.8<br />
22.1 0.3 38.4 49.1 12.9 34.7<br />
99.4 25.0 100.0 93.8 0.0 97.1<br />
Due to the problems relating to varying caste lists in <strong>Bihar</strong> and West Bengal, it is<br />
very expected that many refugee <strong>Bengali</strong> households in <strong>Bihar</strong> will not be satisfied<br />
with their caste classification by the state government officials. From the survey, it<br />
emerged that the proportion of such unsatisfied household was 34.7 percent (Table<br />
23). The problem of was rather limited in Katihar and Bhagalpur, but elsewhere it<br />
was rather serious — Purnea (22.1 percent), West Champaran (38.4 percent) and<br />
East Champaran (49.1 percent).
Finally, the present survey had tried to find out the caste background of those<br />
households who were not agreeable to their caste classification by he caste list of<br />
the <strong>Bihar</strong> Government. As expected, it turned out that the majority of these<br />
unsatisfied households (97.1 percent) were from among the scheduled castes. It is<br />
thus almost certain that a large number of <strong>Bengali</strong> refugees who belong to<br />
scheduled castes as per the West Bengal government list are actually recorded as<br />
extremely backward castes as per the <strong>Bihar</strong> government list. In the resulting<br />
scenario, these households are not able to obtain a caste certificate from the local<br />
officials which designate them as scheduled castes. This is indeed a serious<br />
disadvantage for those refugee <strong>Bengali</strong> households.<br />
A.K. Biswas <strong>Report</strong><br />
On June 24, 1993, Shree Lalu Prasad, the then Chief Minister of <strong>Bihar</strong>, had gone to<br />
visit Areraj in East Champaran district. On behalf of the East Bengal Refugee<br />
<strong>Association</strong> of the district, a delegation had met the Chief Minister and appraised<br />
him about their serious problems. In response, the Chief Minister had requested<br />
Shree A K Biswas, the then Commissioner of Tirhut Division, to prepare a report on<br />
the refugee <strong>Bengali</strong> population of the area. This report (Appendix C) is a valuable<br />
document on the issue. While a copy of the <strong>Report</strong> is appended to this present<br />
survey report, the main observations of the <strong>Report</strong> are noted below with respect to<br />
the specific problems that the <strong>Bengali</strong> refugees had brought to the notice of the<br />
Chief Minister :<br />
(a) Nearly 90 percent of the refugee <strong>Bengali</strong> population in <strong>Bihar</strong> belong to the<br />
scheduled castes. Broadly speaking, about 60 percent of them were<br />
‘Namashudra’ and 25 percent ‘Kaibarta’. The remaining households<br />
belonged to other scheduled castes — Jalia, Mam Idu, Suri, Dabgar,<br />
Bhumali, Sutradhar, Pod, Mochi (Chamar) and a few others. None of these<br />
scheduled caste people are given proper caste certificate, since these<br />
scheduled caste names do not appear in the list of scheduled castes of the<br />
33
<strong>Bihar</strong> government. In contrast to the practice in <strong>Bihar</strong>, the scheduled caste<br />
<strong>Bengali</strong> refugees settled in other Indian states (Odisha, Assam, Meghalay,<br />
Mizoram or Tripura) have been awarded the proper caste certificate, taking<br />
into account the scheduled caste list in West Bengal.<br />
(b) Most of the refugee <strong>Bengali</strong> population were provided with land for their<br />
livelihood. But in spite of specific government order, many of these<br />
households have not been given the ‘parcha’ for their land. Consequently, in<br />
many villages, some of the local strongmen have illegally captured the land<br />
of the refugee <strong>Bengali</strong>s.<br />
(c) In spite of the fact that there is a large <strong>Bengali</strong>-speaking population in East<br />
Champaran, the schools in the district do not have <strong>Bengali</strong> teachers. The<br />
number of sanctioned pots for <strong>Bengali</strong> teachers is itself very inadequate and,<br />
secondly, even those sanctioned posts remain vacant.<br />
(d) The refugee <strong>Bengali</strong> population in Champaran, engaged in cultivation also<br />
face wide discrimination when it comes to receiving several state government<br />
benefits for fertilizer, seed, credit and irrigation. Such discrimination is indeed<br />
practiced by the local administration.<br />
(e) In case of other state government benefits like Old Age Pension, Social<br />
Security Benefits, assistance for flood-affected households, etc., the refugee<br />
<strong>Bengali</strong> population again faces wide discrimination. In some case, these<br />
households have not received any compensations (either land or cash) for<br />
the land acquired from them for Gandak canal or roads. Many of the colonies<br />
of the refugee <strong>Bengali</strong> population are in remote areas where the police<br />
presence is rather limited, resulting in wide prevalence of theft and dacoity.<br />
The reach of electricity is also very limited in the areas.<br />
34
This official report, at one hand, confirms the findings of the present survey<br />
regarding the problem of appropriate caste categorisation of the scheduled<br />
caste refugee <strong>Bengali</strong> population and, secondly, it also indicates that this<br />
problem has been brought to the notice of the state administration long ago<br />
and possibly repeatedly. In as early as 1991, the then Deputy Commissioner<br />
of East Champaran, had issued an office order directing the local officials<br />
(District Welfare Officer, Sub-Divisional Officer, Block Development Officers<br />
and Circle Officers) to provide ‘parcha’ to the refugee <strong>Bengali</strong> households<br />
and also issue them caste certificates, taking into consideration the official list<br />
of scheduled castes of the Government of West Bengal (Appendix D). The<br />
said order, however, has not been followed by the local administration). It<br />
appears that without an intervention from the highest echelons of the state<br />
government, it may not be possible for the local administration to redress this<br />
genuine grievance of the refugee <strong>Bengali</strong> population in <strong>Bihar</strong>.<br />
35
SECTION IV<br />
CONCLUSIONS<br />
The size of the <strong>Bengali</strong> population in <strong>Bihar</strong>, according to 2001 census, was 4.43<br />
lakhs, which is estimated to reach the figure of 5.30 lakhs in 2011. It is quite likely<br />
that this is an underestimate of the size of the <strong>Bengali</strong> population in <strong>Bihar</strong>, and<br />
some knowledgeable sources put the figure to be around 12 lakhs. The history of<br />
<strong>Bengali</strong> population in <strong>Bihar</strong> is very long and, because of their long stay in the state,<br />
a majority of them are as much a <strong>Bihar</strong>i as any other, except that their mother<br />
tongue is <strong>Bengali</strong>, not Hindi. Contrary to the general impression, a substantial<br />
portion of the <strong>Bengali</strong> population lives in rural areas of the state. These rural<br />
<strong>Bengali</strong> population includes those who are original residents of the state, as well as<br />
a substantial number of refugee or <strong>Bengali</strong> population, settled mostly in West<br />
Champaran and East Champaran.<br />
The <strong>Bengali</strong> population in <strong>Bihar</strong> constitutes a linguistic minority in the state and face<br />
a number of social and economic problems. In the past, the <strong>Bihar</strong> <strong>Bengali</strong><br />
<strong>Association</strong> had repeatedly approached the state government to redress various<br />
difficulties faced by them, and the state government have already taken some<br />
positive steps in that direction. However, to identify a comprehensive policy towards<br />
the <strong>Bengali</strong> population, particularly the refugee population, the Hon’ble Chief<br />
Minister had requested the <strong>Bihar</strong> <strong>Bengali</strong> <strong>Association</strong> to prepare a comprehensive<br />
document on their socio-economic status and the specific problems faced by them.<br />
The <strong>Bihar</strong> <strong>Bengali</strong> <strong>Association</strong> had then requested the <strong>Bihar</strong> State Minorities<br />
Commission to undertake the task. The Commission, in turn, had requested the<br />
Centre for Economic Policy and Public Finance (CEPPF) at the Asian Development<br />
Research Institute (ADRI) to prepare the required document, in view of their past<br />
experience for similar assignments. The purpose of the present study is just the<br />
36
same, viz., creation of an information base on <strong>Bengali</strong> population in <strong>Bihar</strong>, based on<br />
some primary data, collected from across the state.<br />
In this background, a sample survey was conducted in 5 districts of the state —<br />
Purnea, Katihar, West Champaran, East Champaran and Bhagalpur. In all, 10,536<br />
households were surveyed in those districts, using a questionnaire that included<br />
information on both households and individuals.<br />
From a comparison of the demographic profile of <strong>Bengali</strong> population and general<br />
population in <strong>Bihar</strong>, it emerges that the former enjoys certain advantages like<br />
smaller household size, better sex ratio and also higher literacy rates for both males<br />
and females. The literacy advantage of the <strong>Bengali</strong> population is, however, very<br />
marginal. If, instead of basic literacy, one takes into account a decent level of<br />
literacy achievement (say, matriculation or above) to be the criterion for literacy,<br />
only about one-third of the <strong>Bengali</strong> population is found to reach that level. Further,<br />
one should also note that the knowledge of their mother tongue <strong>Bengali</strong> (reading<br />
and writing) is rather limited for the <strong>Bengali</strong>s in <strong>Bihar</strong>. This is a serious cultural<br />
disadvantage for them.<br />
In spite of certain demographic advantages, the economic condition of the <strong>Bengali</strong><br />
population in <strong>Bihar</strong> is rather poor. Only a very small proportion of the male <strong>Bengali</strong><br />
workers is engaged in occupations that ensure reasonable levels of income. If one<br />
considers a monthly households income of Rs. 3000 to be the poverty line (this will<br />
be close to the Planning Commission definition), the percentage of <strong>Bengali</strong><br />
households living below the poverty line is found to be 57 percent. This is indeed a<br />
high figure. For the refugee <strong>Bengali</strong> population in West Champaran district, the<br />
poverty estimate stands at an even higher level of 67 percent. In view of such<br />
widespread poverty, it is not surprising that the overall health condition of the<br />
<strong>Bengali</strong> population in <strong>Bihar</strong> is inferior to that of the general population. It is also<br />
disturbing to find that, in spite o f a poverty estimate of about 57 percent, only about<br />
37
40 percent of the <strong>Bengali</strong> households in <strong>Bihar</strong> have a BPL or Annapurna or<br />
Antodaya card. As regards the housing conditions, the <strong>Bengali</strong> households were<br />
found to have inferior dwellings in terms of both roof and floor material; however, for<br />
other facilities like source of drinking water, type of toilet and availability of<br />
electricity, the conditions were nearly the same for the <strong>Bengali</strong> and general<br />
population in <strong>Bihar</strong>.<br />
A substantial portion of the <strong>Bengali</strong> population in <strong>Bihar</strong> are refugees from East<br />
Pakistan (now Bangladesh) who were rehabilitated here, thanks to a policy of the<br />
Indian government. They were rehabilitated mostly in the districts of East<br />
Champaran and West Champaran, during the late fifties. In addition, there were<br />
some households who were also refugees, but they were not officially rehabilitated<br />
and they had managed to rehabilitate themselves. Taking both these categories<br />
together, such households constituted about 70 percent of the respondents in the<br />
present survey.<br />
A large part of the refugee <strong>Bengali</strong> households were given about 3 acres of land as<br />
part of the rehabilitation package. This land endowment was reasonable, but due to<br />
several social and economic constraints, their present economic condition is very<br />
poor. A report by the then Commissioner of Tirhut Division had detailed some of<br />
these constraints which include non-receipt of ‘parcha’ for their land, discrimination<br />
by local level officials regarding government benefits, non-receipt of compensation<br />
amount for land acquired by the state government for canal/road construction,<br />
absence of <strong>Bengali</strong> teachers in schools, and problem related to caste certificates.<br />
The present survey had indeed substantiated most of the findings of that report<br />
through primary data. In particular, the present survey has established that, due to<br />
varying lists of Scheduled Castes in <strong>Bihar</strong> and West Bengal, many refugee <strong>Bengali</strong><br />
households in <strong>Bihar</strong> are not able to obtain a proper caste certificate for them. About<br />
two-thirds of the <strong>Bengali</strong> households do not agree to the caste classification, made<br />
38
y the local officials. More than 90 percent of such households belong to the<br />
Scheduled Caste group, as per the list of West Bengal.<br />
Towards identifying a proper policy for the <strong>Bengali</strong> population in general and the<br />
refugee <strong>Bengali</strong> population in particular<br />
(a) the state government should prepare a revised list of scheduled castes in <strong>Bihar</strong><br />
which includes the names of scheduled castes found in the adjacent state of<br />
West Bengal, so that the local officials can issue proper certificates to those<br />
refugee <strong>Bengali</strong> households. This will enable this socially unprivileged group to<br />
enjoy the facilities given by the government for the scheduled castes and Dalit<br />
of this state;<br />
(b) secondly, in view of the substantial number of <strong>Bengali</strong> population in many<br />
blocks/towns, the state government should ensure the facility of teaching of<br />
<strong>Bengali</strong> by appointing <strong>Bengali</strong> teachers, failing which this linguistic minority will<br />
loose their contact with their mother tongue, loose their culture, and ultimately<br />
loose their social identity;<br />
(c) finally, the local administration should be sensitised not to practice any<br />
discrimination against the <strong>Bengali</strong> population in implementation of various<br />
welfare programmes of the state government so that equal opportunities are<br />
available to every citizen of <strong>Bihar</strong>.<br />
39
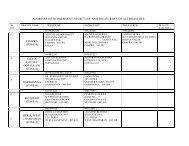
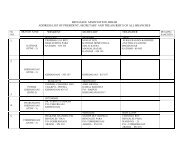
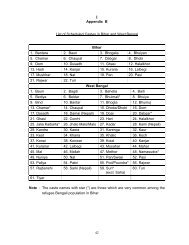
![nandan kanan[1] - Bengalee Association Bihar](https://img.yumpu.com/17028545/1/190x245/nandan-kanan1-bengalee-association-bihar.jpg?quality=85)