Bengali Report - Bengalee Association Bihar
Bengali Report - Bengalee Association Bihar
Bengali Report - Bengalee Association Bihar

You also want an ePaper? Increase the reach of your titles
YUMPU automatically turns print PDFs into web optimized ePapers that Google loves.
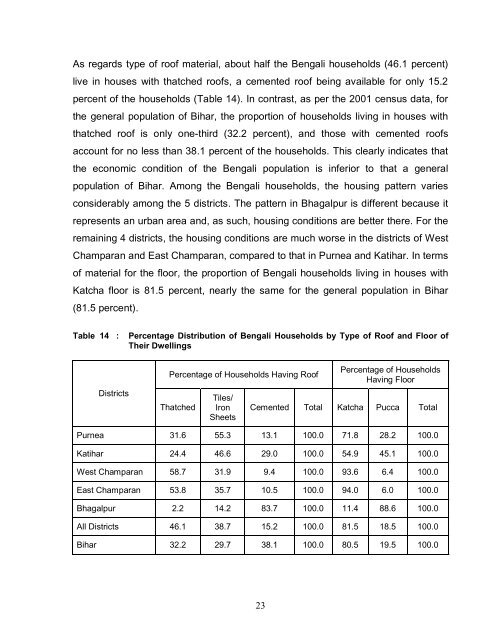
As regards type of roof material, about half the <strong>Bengali</strong> households (46.1 percent)<br />
live in houses with thatched roofs, a cemented roof being available for only 15.2<br />
percent of the households (Table 14). In contrast, as per the 2001 census data, for<br />
the general population of <strong>Bihar</strong>, the proportion of households living in houses with<br />
thatched roof is only one-third (32.2 percent), and those with cemented roofs<br />
account for no less than 38.1 percent of the households. This clearly indicates that<br />
the economic condition of the <strong>Bengali</strong> population is inferior to that a general<br />
population of <strong>Bihar</strong>. Among the <strong>Bengali</strong> households, the housing pattern varies<br />
considerably among the 5 districts. The pattern in Bhagalpur is different because it<br />
represents an urban area and, as such, housing conditions are better there. For the<br />
remaining 4 districts, the housing conditions are much worse in the districts of West<br />
Champaran and East Champaran, compared to that in Purnea and Katihar. In terms<br />
of material for the floor, the proportion of <strong>Bengali</strong> households living in houses with<br />
Katcha floor is 81.5 percent, nearly the same for the general population in <strong>Bihar</strong><br />
(81.5 percent).<br />
Table 14 : Percentage Distribution of <strong>Bengali</strong> Households by Type of Roof and Floor of<br />
Their Dwellings<br />
Districts<br />
Percentage of Households Having Roof<br />
Thatched<br />
Tiles/<br />
Iron<br />
Sheets<br />
23<br />
Percentage of Households<br />
Having Floor<br />
Cemented Total Katcha Pucca Total<br />
Purnea 31.6 55.3 13.1 100.0 71.8 28.2 100.0<br />
Katihar 24.4 46.6 29.0 100.0 54.9 45.1 100.0<br />
West Champaran 58.7 31.9 9.4 100.0 93.6 6.4 100.0<br />
East Champaran 53.8 35.7 10.5 100.0 94.0 6.0 100.0<br />
Bhagalpur 2.2 14.2 83.7 100.0 11.4 88.6 100.0<br />
All Districts 46.1 38.7 15.2 100.0 81.5 18.5 100.0<br />
<strong>Bihar</strong> 32.2 29.7 38.1 100.0 80.5 19.5 100.0
![nandan kanan[1] - Bengalee Association Bihar](https://img.yumpu.com/17028545/1/190x245/nandan-kanan1-bengalee-association-bihar.jpg?quality=85)