Bengali Report - Bengalee Association Bihar
Bengali Report - Bengalee Association Bihar
Bengali Report - Bengalee Association Bihar

Create successful ePaper yourself
Turn your PDF publications into a flip-book with our unique Google optimized e-Paper software.
happens because they do not have the opportunity of receiving their elementary<br />
education in <strong>Bengali</strong>; they attend schools imparting education either in Hindi, the<br />
local language, or in a limited number of cases, in English. The present survey had,<br />
therefore, tried to find out the percentage of <strong>Bengali</strong>s who can read and write<br />
<strong>Bengali</strong> language. It is obviously assumed that they all can at least speak <strong>Bengali</strong><br />
and it is a reasonable assumption. The pitiable condition of the <strong>Bengali</strong> population<br />
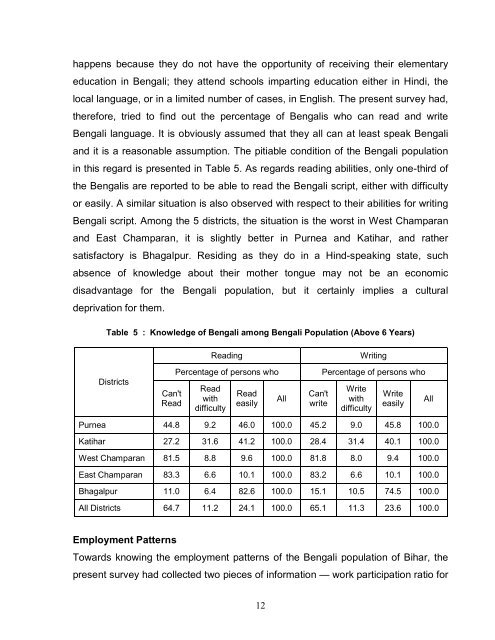
in this regard is presented in Table 5. As regards reading abilities, only one-third of<br />
the <strong>Bengali</strong>s are reported to be able to read the <strong>Bengali</strong> script, either with difficulty<br />
or easily. A similar situation is also observed with respect to their abilities for writing<br />
<strong>Bengali</strong> script. Among the 5 districts, the situation is the worst in West Champaran<br />
and East Champaran, it is slightly better in Purnea and Katihar, and rather<br />
satisfactory is Bhagalpur. Residing as they do in a Hind-speaking state, such<br />
absence of knowledge about their mother tongue may not be an economic<br />
disadvantage for the <strong>Bengali</strong> population, but it certainly implies a cultural<br />
deprivation for them.<br />
Table 5 : Knowledge of <strong>Bengali</strong> among <strong>Bengali</strong> Population (Above 6 Years)<br />
Districts<br />
Can't<br />
Read<br />
Reading Writing<br />
Percentage of persons who Percentage of persons who<br />
Read<br />
with<br />
difficulty<br />
Read<br />
easily<br />
12<br />
All<br />
Can't<br />
write<br />
Write<br />
with<br />
difficulty<br />
Write<br />
easily<br />
Purnea 44.8 9.2 46.0 100.0 45.2 9.0 45.8 100.0<br />
Katihar 27.2 31.6 41.2 100.0 28.4 31.4 40.1 100.0<br />
West Champaran 81.5 8.8 9.6 100.0 81.8 8.0 9.4 100.0<br />
East Champaran 83.3 6.6 10.1 100.0 83.2 6.6 10.1 100.0<br />
Bhagalpur 11.0 6.4 82.6 100.0 15.1 10.5 74.5 100.0<br />
All Districts 64.7 11.2 24.1 100.0 65.1 11.3 23.6 100.0<br />
Employment Patterns<br />
Towards knowing the employment patterns of the <strong>Bengali</strong> population of <strong>Bihar</strong>, the<br />
present survey had collected two pieces of information — work participation ratio for<br />
All
![nandan kanan[1] - Bengalee Association Bihar](https://img.yumpu.com/17028545/1/190x245/nandan-kanan1-bengalee-association-bihar.jpg?quality=85)