Bengali Report - Bengalee Association Bihar
Bengali Report - Bengalee Association Bihar
Bengali Report - Bengalee Association Bihar

You also want an ePaper? Increase the reach of your titles
YUMPU automatically turns print PDFs into web optimized ePapers that Google loves.
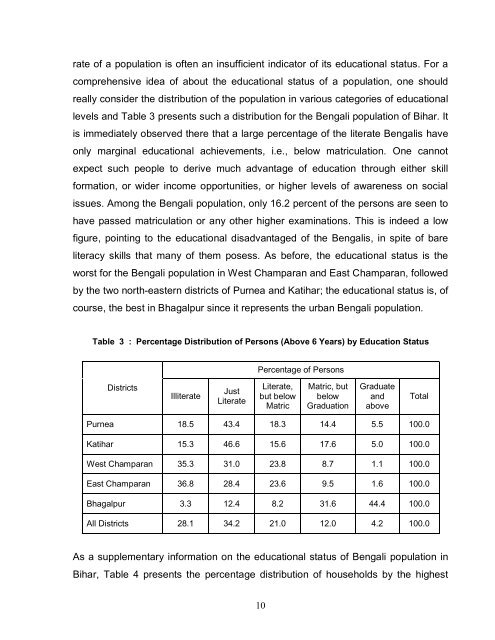
ate of a population is often an insufficient indicator of its educational status. For a<br />
comprehensive idea of about the educational status of a population, one should<br />
really consider the distribution of the population in various categories of educational<br />
levels and Table 3 presents such a distribution for the <strong>Bengali</strong> population of <strong>Bihar</strong>. It<br />
is immediately observed there that a large percentage of the literate <strong>Bengali</strong>s have<br />
only marginal educational achievements, i.e., below matriculation. One cannot<br />
expect such people to derive much advantage of education through either skill<br />
formation, or wider income opportunities, or higher levels of awareness on social<br />
issues. Among the <strong>Bengali</strong> population, only 16.2 percent of the persons are seen to<br />
have passed matriculation or any other higher examinations. This is indeed a low<br />
figure, pointing to the educational disadvantaged of the <strong>Bengali</strong>s, in spite of bare<br />
literacy skills that many of them posess. As before, the educational status is the<br />
worst for the <strong>Bengali</strong> population in West Champaran and East Champaran, followed<br />
by the two north-eastern districts of Purnea and Katihar; the educational status is, of<br />
course, the best in Bhagalpur since it represents the urban <strong>Bengali</strong> population.<br />
Table 3 : Percentage Distribution of Persons (Above 6 Years) by Education Status<br />
Districts<br />
Illiterate<br />
Just<br />
Literate<br />
Percentage of Persons<br />
Literate,<br />
but below<br />
Matric<br />
10<br />
Matric, but<br />
below<br />
Graduation<br />
Graduate<br />
and<br />
above<br />
Total<br />
Purnea 18.5 43.4 18.3 14.4 5.5 100.0<br />
Katihar 15.3 46.6 15.6 17.6 5.0 100.0<br />
West Champaran 35.3 31.0 23.8 8.7 1.1 100.0<br />
East Champaran 36.8 28.4 23.6 9.5 1.6 100.0<br />
Bhagalpur 3.3 12.4 8.2 31.6 44.4 100.0<br />
All Districts 28.1 34.2 21.0 12.0 4.2 100.0<br />
As a supplementary information on the educational status of <strong>Bengali</strong> population in<br />
<strong>Bihar</strong>, Table 4 presents the percentage distribution of households by the highest
![nandan kanan[1] - Bengalee Association Bihar](https://img.yumpu.com/17028545/1/190x245/nandan-kanan1-bengalee-association-bihar.jpg?quality=85)