Bengali Report - Bengalee Association Bihar
Bengali Report - Bengalee Association Bihar
Bengali Report - Bengalee Association Bihar

Create successful ePaper yourself
Turn your PDF publications into a flip-book with our unique Google optimized e-Paper software.
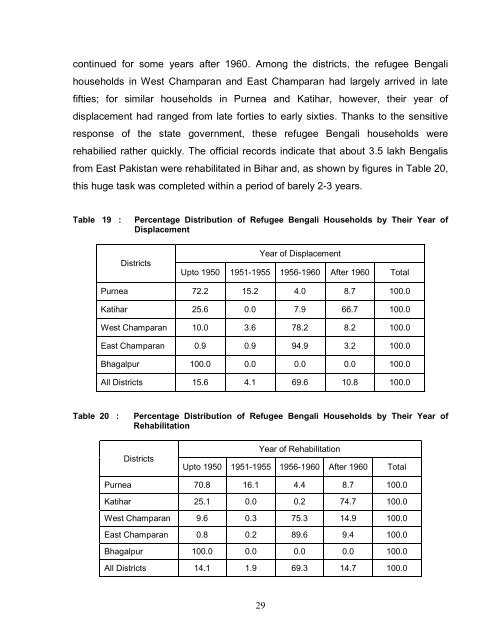
continued for some years after 1960. Among the districts, the refugee <strong>Bengali</strong><br />
households in West Champaran and East Champaran had largely arrived in late<br />
fifties; for similar households in Purnea and Katihar, however, their year of<br />
displacement had ranged from late forties to early sixties. Thanks to the sensitive<br />
response of the state government, these refugee <strong>Bengali</strong> households were<br />
rehabilied rather quickly. The official records indicate that about 3.5 lakh <strong>Bengali</strong>s<br />
from East Pakistan were rehabilitated in <strong>Bihar</strong> and, as shown by figures in Table 20,<br />
this huge task was completed within a period of barely 2-3 years.<br />
Table 19 : Percentage Distribution of Refugee <strong>Bengali</strong> Households by Their Year of<br />
Displacement<br />
Districts<br />
Year of Displacement<br />
Upto 1950 1951-1955 1956-1960 After 1960 Total<br />
Purnea 72.2 15.2 4.0 8.7 100.0<br />
Katihar 25.6 0.0 7.9 66.7 100.0<br />
West Champaran 10.0 3.6 78.2 8.2 100.0<br />
East Champaran 0.9 0.9 94.9 3.2 100.0<br />
Bhagalpur 100.0 0.0 0.0 0.0 100.0<br />
All Districts 15.6 4.1 69.6 10.8 100.0<br />
Table 20 : Percentage Distribution of Refugee <strong>Bengali</strong> Households by Their Year of<br />
Rehabilitation<br />
Districts<br />
Year of Rehabilitation<br />
Upto 1950 1951-1955 1956-1960 After 1960 Total<br />
Purnea 70.8 16.1 4.4 8.7 100.0<br />
Katihar 25.1 0.0 0.2 74.7 100.0<br />
West Champaran 9.6 0.3 75.3 14.9 100.0<br />
East Champaran 0.8 0.2 89.6 9.4 100.0<br />
Bhagalpur 100.0 0.0 0.0 0.0 100.0<br />
All Districts 14.1 1.9 69.3 14.7 100.0<br />
29
![nandan kanan[1] - Bengalee Association Bihar](https://img.yumpu.com/17028545/1/190x245/nandan-kanan1-bengalee-association-bihar.jpg?quality=85)