Laterite Leach Tests
Laterite Leach Tests
Laterite Leach Tests

You also want an ePaper? Increase the reach of your titles
YUMPU automatically turns print PDFs into web optimized ePapers that Google loves.
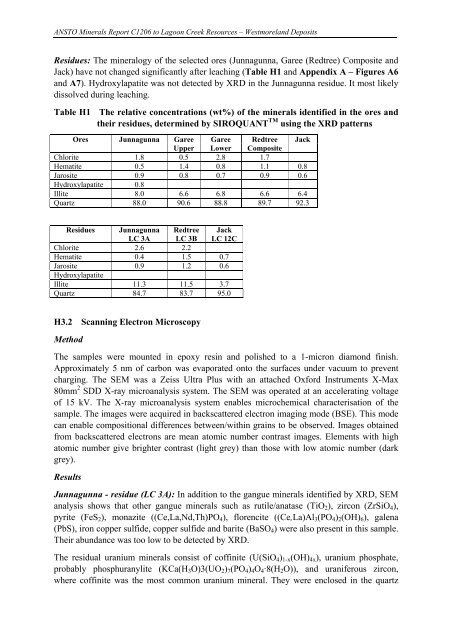
ANSTO Minerals Report C1206 to Lagoon Creek Resources – Westmoreland Deposits<br />
Residues: The mineralogy of the selected ores (Junnagunna, Garee (Redtree) Composite and<br />
Jack) have not changed significantly after leaching (Table H1 and Appendix A – Figures A6<br />
and A7). Hydroxylapatite was not detected by XRD in the Junnagunna residue. It most likely<br />
dissolved during leaching.<br />
Table H1 The relative concentrations (wt%) of the minerals identified in the ores and<br />
their residues, determined by SIROQUANT TM using the XRD patterns<br />
Ores Junnagunna Garee Garee Redtree Jack<br />
Upper Lower Composite<br />
Chlorite 1.8 0.5 2.8 1.7<br />
Hematite 0.5 1.4 0.8 1.1 0.8<br />
Jarosite 0.9 0.8 0.7 0.9 0.6<br />
Hydroxylapatite 0.8<br />
Illite 8.0 6.6 6.8 6.6 6.4<br />
Quartz 88.0 90.6 88.8 89.7 92.3<br />
Residues Junnagunna Redtree Jack<br />
LC 3A LC 3B LC 12C<br />
Chlorite 2.6 2.2<br />
Hematite 0.4 1.5 0.7<br />
Jarosite 0.9 1.2 0.6<br />
Hydroxylapatite<br />
Illite 11.3 11.5 3.7<br />
Quartz 84.7 83.7 95.0<br />
H3.2 Scanning Electron Microscopy<br />
Method<br />
The samples were mounted in epoxy resin and polished to a 1-micron diamond finish.<br />
Approximately 5 nm of carbon was evaporated onto the surfaces under vacuum to prevent<br />
charging. The SEM was a Zeiss Ultra Plus with an attached Oxford Instruments X-Max<br />
80mm 2 SDD X-ray microanalysis system. The SEM was operated at an accelerating voltage<br />
of 15 kV. The X-ray microanalysis system enables microchemical characterisation of the<br />
sample. The images were acquired in backscattered electron imaging mode (BSE). This mode<br />
can enable compositional differences between/within grains to be observed. Images obtained<br />
from backscattered electrons are mean atomic number contrast images. Elements with high<br />
atomic number give brighter contrast (light grey) than those with low atomic number (dark<br />
grey).<br />
Results<br />
Junnagunna - residue (LC 3A): In addition to the gangue minerals identified by XRD, SEM<br />
analysis shows that other gangue minerals such as rutile/anatase (TiO2), zircon (ZrSiO4),<br />
pyrite (FeS2), monazite ((Ce,La,Nd,Th)PO4), florencite ((Ce,La)Al3(PO4)2(OH)6), galena<br />
(PbS), iron copper sulfide, copper sulfide and barite (BaSO4) were also present in this sample.<br />
Their abundance was too low to be detected by XRD.<br />
The residual uranium minerals consist of coffinite (U(SiO4)1-x(OH)4x), uranium phosphate,<br />
probably phosphuranylite (KCa(H3O)3(UO2)7(PO4)4O4·8(H2O)), and uraniferous zircon,<br />
where coffinite was the most common uranium mineral. They were enclosed in the quartz