- Page 1:
AUSTRALIAN NUCLEAR SCIENCE AND TECH
- Page 4 and 5:
ANSTO Minerals Report C1206 to Lago
- Page 6 and 7:
ANSTO Minerals Report C1206 to Lago
- Page 8 and 9:
ANSTO Minerals Report C1206 to Lago
- Page 10 and 11:
ANSTO Minerals Report C1206 to Lago
- Page 13 and 14: ANSTO Minerals Report C1206 to Lago
- Page 15: ANSTO Minerals Report C1206 to Lago
- Page 18 and 19: ANSTO Minerals Report C1206 to Lago
- Page 20 and 21: ANSTO Minerals Report C1206 to Lago
- Page 22 and 23: ANSTO Minerals Report C1206 to Lago
- Page 24 and 25: ANSTO Minerals Report C1206 to Lago
- Page 26 and 27: ANSTO Minerals Report C1206 to Lago
- Page 28 and 29: ANSTO Minerals Report C1206 to Lago
- Page 30 and 31: ANSTO Minerals Report C1206 to Lago
- Page 32 and 33: ANSTO Minerals Report C1206 to Lago
- Page 34 and 35: ANSTO Minerals Report C1206 to Lago
- Page 36 and 37: ANSTO Minerals Report C1206 to Lago
- Page 38 and 39: ANSTO Minerals Report C1206 to Lago
- Page 40 and 41: ANSTO Minerals Report C1206 to Lago
- Page 42 and 43: ANSTO Minerals Report C1206 to Lago
- Page 44 and 45: ANSTO Minerals Report C1206 to Lago
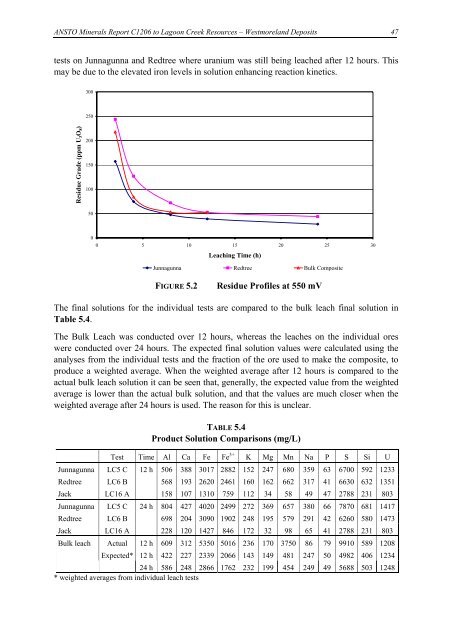
- Page 46 and 47: ANSTO Minerals Report C1206 to Lago
- Page 48 and 49: ANSTO Minerals Report C1206 to Lago
- Page 50 and 51: ANSTO Minerals Report C1206 to Lago
- Page 52 and 53: ANSTO Minerals Report C1206 to Lago
- Page 54 and 55: ANSTO Minerals Report C1206 to Lago
- Page 56 and 57: ANSTO Minerals Report C1206 to Lago
- Page 58 and 59: ANSTO Minerals Report C1206 to Lago
- Page 60 and 61: ANSTO Minerals Report C1206 to Lago
- Page 64 and 65: ANSTO Minerals Report C1206 to Lago
- Page 66 and 67: ANSTO Minerals Report C1206 to Lago
- Page 68 and 69: ANSTO Minerals Report C1206 to Lago
- Page 70 and 71: ANSTO Minerals Report C1206 to Lago
- Page 72 and 73: ANSTO Minerals Report C1206 to Lago
- Page 74 and 75: ANSTO Minerals Report C1206 to Lago
- Page 76 and 77: ANSTO Minerals Report C1206 to Lago
- Page 78 and 79: ANSTO Minerals Report C1206 to Lago
- Page 80 and 81: ANSTO Minerals Report C1206 to Lago
- Page 82 and 83: ANSTO Minerals Report C1206 to Lago
- Page 84 and 85: ANSTO Minerals Report C1206 to Lago
- Page 86 and 87: ANSTO Minerals Report C1206 to Lago
- Page 88 and 89: ANSTO Minerals Report C1206 to Lago
- Page 90 and 91: ANSTO Minerals Report C1206 to Lago
- Page 92 and 93: ANSTO Minerals Report C1206 to Lago
- Page 95 and 96: ANSTO Minerals Report C1206 to Lago
- Page 97 and 98: ANSTO Minerals Report C1206 to Lago
- Page 99: ANSTO Minerals Report C1206 to Lago
- Page 102 and 103: ANSTO Minerals Report C1206 to Lago
- Page 105 and 106: ANSTO Minerals Report C1206 to Lago
- Page 107 and 108: ANSTO Minerals Report C1206 to Lago
- Page 109 and 110: ANSTO Minerals Report C1206 to Lago
- Page 111 and 112: ANSTO Minerals Report C1206 to Lago
- Page 113 and 114:
ANSTO Minerals Report C1206 to Lago
- Page 115 and 116:
ANSTO Minerals Report C1206 to Lago
- Page 117 and 118:
ANSTO Minerals Report C1206 to Lago
- Page 119:
ANSTO Minerals Report C1206 to Lago
- Page 122 and 123:
ANSTO Minerals Report C1206 to Lago
- Page 124 and 125:
ANSTO Minerals Report C1206 to Lago
- Page 126 and 127:
ANSTO Minerals Report C1206 to Lago
- Page 128 and 129:
ANSTO Minerals Report C1206 to Lago
- Page 130 and 131:
ANSTO Minerals Report C1206 to Lago
- Page 132 and 133:
ANSTO Minerals Report C1206 to Lago
- Page 134 and 135:
ANSTO Minerals Report C1206 to Lago
- Page 136 and 137:
ANSTO Minerals Report C1206 to Lago
- Page 138 and 139:
ANSTO Minerals Report C1206 to Lago
- Page 140 and 141:
ANSTO Minerals Report C1206 to Lago
- Page 142 and 143:
ANSTO Minerals Report C1206 to Lago
- Page 144 and 145:
ANSTO Minerals Report C1206 to Lago
- Page 146 and 147:
ANSTO Minerals Report C1206 to Lago
- Page 148 and 149:
ANSTO Minerals Report C1206 to Lago
- Page 150 and 151:
ANSTO Minerals Report C1206 to Lago
- Page 152 and 153:
ANSTO Minerals Report C1206 to Lago
- Page 154 and 155:
ANSTO Minerals Report C1206 to Lago
- Page 156 and 157:
ANSTO Minerals Report C1206 to Lago
- Page 159 and 160:
ANSTO Minerals Report C1206 to Lago
- Page 161:
ANSTO Minerals Report C1206 to Lago
- Page 164 and 165:
ANSTO Minerals Report C1206 to Lago
- Page 166 and 167:
ANSTO Minerals Report C1206 to Lago
- Page 169 and 170:
ANSTO Minerals Report C1206 to Lago
- Page 171 and 172:
ANSTO Minerals Report C1206 to Lago
- Page 173 and 174:
ANSTO Minerals Report C1206 to Lago
- Page 175 and 176:
ANSTO Minerals Report C1206 to Lago
- Page 177 and 178:
ANSTO Minerals Report C1206 to Lago
- Page 179 and 180:
ANSTO Minerals Report C1206 to Lago
- Page 181 and 182:
ANSTO Minerals Report C1206 to Lago
- Page 183 and 184:
ANSTO Minerals Report C1206 to Lago
- Page 185 and 186:
ANSTO Minerals Report C1206 to Lago
- Page 187 and 188:
ANSTO Minerals Report C1206 to Lago
- Page 189 and 190:
ANSTO Minerals Report C1206 to Lago
- Page 191 and 192:
ANSTO Minerals Report C1206 to Lago
- Page 193 and 194:
ANSTO Minerals Report C1206 to Lago
- Page 195 and 196:
ANSTO Minerals Report C1206 to Lago
- Page 197 and 198:
ANSTO Minerals Report C1206 to Lago
- Page 199 and 200:
ANSTO Minerals Report C1206 to Lago
- Page 201 and 202:
ANSTO Minerals Report C1206 to Lago
- Page 203 and 204:
ANSTO Minerals Report C1206 to Lago
- Page 205 and 206:
ANSTO Minerals Report C1206 to Lago
- Page 207 and 208:
ANSTO Minerals Report C1206 to Lago
- Page 209 and 210:
ANSTO Minerals Report C1206 to Lago
- Page 211:
ANSTO Minerals Report C1206 to Lago
- Page 214 and 215:
Thickening and Vacuum Filtration Ev
- Page 216 and 217:
Thickening and Vacuum Filtration Ev
- Page 218 and 219:
Thickening and Vacuum Filtration Ev
- Page 220 and 221:
Thickening and Vacuum Filtration Ev
- Page 222 and 223:
Thickening and Vacuum Filtration Ev
- Page 224 and 225:
Thickening and Vacuum Filtration Ev
- Page 226 and 227:
Thickening and Vacuum Filtration Ev
- Page 228 and 229:
Thickening and Vacuum Filtration Ev
- Page 230 and 231:
Thickening and Vacuum Filtration Ev
- Page 232 and 233:
Thickening and Vacuum Filtration Ev
- Page 234 and 235:
Thickening and Vacuum Filtration Ev
- Page 236 and 237:
Thickening and Vacuum Filtration Ev
- Page 238 and 239:
Thickener Test Summary for Laramide
- Page 240 and 241:
Thickener Test Summary for Laramide
- Page 243 and 244:
ANSTO Minerals Report C1206 to Lago
- Page 245 and 246:
ANSTO Minerals Report C1206 to Lago
- Page 247 and 248:
ANSTO Minerals Report C1206 to Lago
- Page 249 and 250:
ANSTO Minerals Report C1206 to Lago
- Page 251 and 252:
ANSTO Minerals Report C1206 to Lago
- Page 253 and 254:
ANSTO Minerals Report C1206 to Lago
- Page 255 and 256:
ANSTO Minerals Report C1206 to Lago
- Page 257 and 258:
ANSTO Minerals Report C1206 to Lago
- Page 259 and 260:
ANSTO Minerals Report C1206 to Lago
- Page 261:
ANSTO Minerals Report C1206 to Lago
- Page 264 and 265:
ANSTO Minerals Report C1206 to Lago
- Page 266 and 267:
ANSTO Minerals Report C1206 to Lago
- Page 268:
ANSTO Minerals Report C1206 to Lago


