rezumat final - USAMV Cluj-Napoca
rezumat final - USAMV Cluj-Napoca
rezumat final - USAMV Cluj-Napoca

You also want an ePaper? Increase the reach of your titles
YUMPU automatically turns print PDFs into web optimized ePapers that Google loves.
Cryptosporidiosis in calves and goat kids: research concerning diagnosis, epidemiology, and etiopathogenesis<br />
Group No. 1 was made of 10 calves presenting symptoms of catarrhal enteritis<br />
Group No. 2 was made of 9 calves presenting symptoms of hemorrhagic enteritis<br />
Results<br />
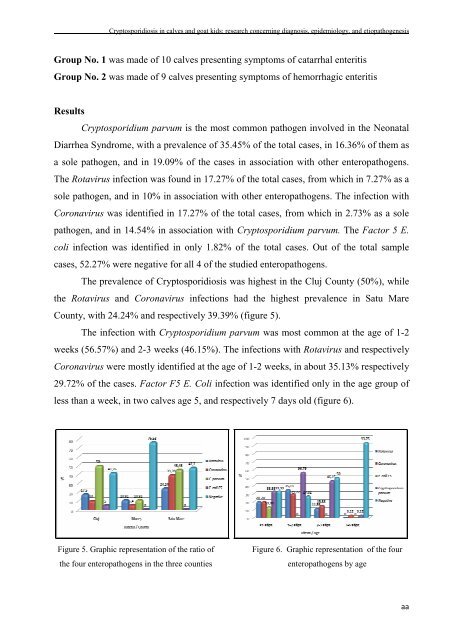
Cryptosporidium parvum is the most common pathogen involved in the Neonatal<br />
Diarrhea Syndrome, with a prevalence of 35.45% of the total cases, in 16.36% of them as<br />
a sole pathogen, and in 19.09% of the cases in association with other enteropathogens.<br />
The Rotavirus infection was found in 17.27% of the total cases, from which in 7.27% as a<br />
sole pathogen, and in 10% in association with other enteropathogens. The infection with<br />
Coronavirus was identified in 17.27% of the total cases, from which in 2.73% as a sole<br />
pathogen, and in 14.54% in association with Cryptosporidium parvum. The Factor 5 E.<br />
coli infection was identified in only 1.82% of the total cases. Out of the total sample<br />
cases, 52.27% were negative for all 4 of the studied enteropathogens.<br />
The prevalence of Cryptosporidiosis was highest in the <strong>Cluj</strong> County (50%), while<br />
the Rotavirus and Coronavirus infections had the highest prevalence in Satu Mare<br />
County, with 24.24% and respectively 39.39% (figure 5).<br />
The infection with Cryptosporidium parvum was most common at the age of 1-2<br />
weeks (56.57%) and 2-3 weeks (46.15%). The infections with Rotavirus and respectively<br />
Coronavirus were mostly identified at the age of 1-2 weeks, in about 35.13% respectively<br />
29.72% of the cases. Factor F5 E. Coli infection was identified only in the age group of<br />
less than a week, in two calves age 5, and respectively 7 days old (figure 6).<br />
Figure 5. Graphic representation of the ratio of<br />
the four enteropathogens in the three counties<br />
Figure 6. Graphic representation of the four<br />
enteropathogens by age<br />
aa