- Page 1 and 2:
BOARD OF COUNTY COMMISSIONERS LEON
- Page 3 and 4:
Board of County Commissioners Regul
- Page 5 and 6:
Board of County Commissioners Regul
- Page 7 and 8:
Board of County Commissioners Regul
- Page 9 and 10:
Board of County Commissioners Regul
- Page 11 and 12:
Board of County Commissioners Regul
- Page 13 and 14:
Leon County Board of County Commiss
- Page 15 and 16:
Attachment #1 Page 2 of 12 2. Autho
- Page 17 and 18:
15. Acceptance of Status Report on
- Page 19 and 20:
Commissioner Desloge commented that
- Page 21 and 22:
Chairman Maddox confirmed there wer
- Page 23 and 24:
County Administrator Long: Offered
- Page 25 and 26:
Adjourn: There being no further bus
- Page 27 and 28:
To: Leon County Board of County Com
- Page 29 and 30:
Board of County Commissioners Leon
- Page 31 and 32:
Attachment #1 Page 3 of 11 Travel P
- Page 33 and 34:
Attachment #1 Page 5 of 11 Travel P
- Page 35 and 36:
Attachment #1 Page 7 of 11 Travel P
- Page 37 and 38:
Attachment #1 Page 9 of 11 Travel P
- Page 39 and 40:
Attachment #1 Page 11 of 11 Travel
- Page 41 and 42:
Leon County Board of County Commiss
- Page 43:
Title: Authorization to Amend the 2
- Page 48 and 49:
CHURCH OFFICE 8501222·8440 FAX 850
- Page 50 and 51:
To: Leon County Board of County Com
- Page 52 and 53:
Leon County Board of County Commiss
- Page 54 and 55:
Title: Acceptance of the FY 2012/20
- Page 56 and 57:
Leon County, Florida Board of Count
- Page 58 and 59:
To: Leon County Board of County Com
- Page 60 and 61:
Comparative Data This section provi
- Page 62 and 63:
Leon County Government Fiscal Year
- Page 64 and 65:
GENERAL FUND /FINE AND FORFEITURE-
- Page 66 and 67:
Fiscal Year Actuals & Projections M
- Page 68 and 69:
Fiscal Year Actuals & Projections $
- Page 70 and 71:
Fiscal Year Actuals & Projections $
- Page 72 and 73:
Fiscal Year Actuals & Projections 5
- Page 74 and 75:
Fiscal Year Actuals & Projections M
- Page 76 and 77:
Fiscal Year Actuals & Projections $
- Page 78 and 79:
Fiscal Year Actuals & Projections $
- Page 80 and 81:
Leon County Government Fiscal Year
- Page 82 and 83:
Leon County Government FY 2013 Mid-
- Page 84 and 85:
Leon County Government Fiscal Year
- Page 86 and 87:
Leon County Government Fiscal Year
- Page 88 and 89:
Leon County Government Fiscal Year
- Page 90 and 91:
Leon County Government FY 2013 Mid-
- Page 92 and 93:
Leon County Government FY 2013 Mid-
- Page 94 and 95:
Leon County Government FY 2013 Mid-
- Page 96 and 97:
Population Thousands 300 225 150 75
- Page 98 and 99:
Total County Labor Force Thousands
- Page 100 and 101:
Name Smith Interest General Partner
- Page 102 and 103:
Violent Crime Rate Per 100,000 Resi
- Page 104 and 105:
Intergovernmental Revenues Percent
- Page 106 and 107:
Revenues Per Capita $900 $825 $750
- Page 108 and 109:
Debt Service Percentage of Total Op
- Page 110 and 111:
Countywide Population (2012) Thousa
- Page 112 and 113:
Total Net Budget (FY13) Millions $3
- Page 114 and 115:
2,000 1,600 1,200 800 400 18.0 16.0
- Page 116 and 117:
Percent of Exempt Property County %
- Page 118 and 119:
Leon County, Florida Board of Count
- Page 120 and 121:
To: Leon County Board of County Com
- Page 122 and 123:
Comparative Data This section provi
- Page 124 and 125:
Leon County Government Fiscal Year
- Page 126 and 127:
GENERAL FUND /FINE AND FORFEITURE-
- Page 128 and 129:
Fiscal Year Actuals & Projections M
- Page 130 and 131:
Fiscal Year Actuals & Projections $
- Page 132 and 133:
Fiscal Year Actuals & Projections $
- Page 134 and 135:
Fiscal Year Actuals & Projections 5
- Page 136 and 137:
Fiscal Year Actuals & Projections M
- Page 138 and 139:
Fiscal Year Actuals & Projections $
- Page 140 and 141:
Fiscal Year Actuals & Projections $
- Page 142 and 143:
Leon County Government Fiscal Year
- Page 144 and 145:
Leon County Government FY 2013 Mid-
- Page 146 and 147:
Leon County Government Fiscal Year
- Page 148 and 149:
Leon County Government Fiscal Year
- Page 150 and 151:
Leon County Government Fiscal Year
- Page 152 and 153:
Leon County Government FY 2013 Mid-
- Page 154 and 155:
Leon County Government FY 2013 Mid-
- Page 156 and 157:
Leon County Government FY 2013 Mid-
- Page 158 and 159:
Population Thousands 300 225 150 75
- Page 160 and 161:
Total County Labor Force Thousands
- Page 162 and 163:
Name Smith Interest General Partner
- Page 164 and 165:
Violent Crime Rate Per 100,000 Resi
- Page 166 and 167:
Intergovernmental Revenues Percent
- Page 168 and 169:
Revenues Per Capita $900 $825 $750
- Page 170 and 171:
Debt Service Percentage of Total Op
- Page 172 and 173:
Countywide Population (2012) Thousa
- Page 174 and 175:
Total Net Budget (FY13) Millions $3
- Page 176 and 177:
2,000 1,600 1,200 800 400 18.0 16.0
- Page 178 and 179:
Percent of Exempt Property County %
- Page 180 and 181:
Leon County Board of County Commiss
- Page 182 and 183:
Title: Request to Schedule a First
- Page 184 and 185:
Title: Request to Schedule a First
- Page 186 and 187:
Title: Request to Schedule a First
- Page 188 and 189:
Title: Request to Schedule a First
- Page 190 and 191:
1 2 3 4 5 6 7 8 9 10 11 12 13 14 15
- Page 192 and 193:
1 2 3 4 5 6 7 8 9 10 11 12 13 14 15
- Page 194 and 195:
1 2 3 4 5 6 7 8 9 10 11 12 13 14 15
- Page 196 and 197:
1 2 3 4 5 6 7 8 9 10 11 12 13 14 15
- Page 198 and 199:
Leon County Board of County Commiss
- Page 200 and 201:
Title: Approval of Utility Easement
- Page 202 and 203:
Rev/01-15-2013 Water and Sewer Util
- Page 208 and 209:
Leon County Board of County Commiss
- Page 210 and 211:
Title: Request to Schedule a First
- Page 212:
Affordable Housing Property List #
- Page 216 and 217:
Leon County Board of County Commiss
- Page 218 and 219:
Title: Request to Schedule a First
- Page 220 and 221:
To: Leon County Board of County Com
- Page 222 and 223:
Title: Approval of a Proposed Lease
- Page 224 and 225:
Attachment #1 Page 2 of 6 3. PAYMEN
- Page 226 and 227:
Attachment #1 Page 4 of 6 19. HOLDI
- Page 228 and 229:
Attachment #1 Page 6 of 6 TENANT no
- Page 230 and 231:
Development (Visit Tallahassee), in
- Page 232 and 233:
To: Leon County Board of County Com
- Page 234 and 235:
Title: Acceptance of the Lake Jacks
- Page 237 and 238:
2 Lake Jackson Town Center at Hunti
- Page 239 and 240:
TABLE OF CONTENTS I. ‘Sense of Pl
- Page 241 and 242:
6 Lake Jackson Town Center at Hunti
- Page 243 and 244:
8 Lake Jackson Town Center at Hunti
- Page 245 and 246:
---- - Attachment #1 Page 10 of 30
- Page 248 and 249:
CREATING A COHESIVE DISTRICT Lake J
- Page 250 and 251:
Please see page 24 for an explanati
- Page 252 and 253:
Many local residents utilize non-au
- Page 254 and 255:
Vacant property immediately west of
- Page 256 and 257:
Lake Jackson Town Center at Hunting
- Page 258 and 259:
SOURCES Lake Jackson Town Center at
- Page 260 and 261:
• Wooded/ ravine areas are homele
- Page 262 and 263:
• Street lighting • Improve str
- Page 264 and 265:
Lake Jackson Town Center at Hunting
- Page 266 and 267:
Leon County Board of County Commiss
- Page 268 and 269:
Title: Approval of Detailed Work Pl
- Page 270 and 271:
ADAM H. PUTNAM Florida Department o
- Page 272 and 273:
To: Leon County Board of County Com
- Page 274 and 275:
Title: Approval of Agreements Perta
- Page 276 and 277:
2. Conditions Precedent. a. The fol
- Page 278 and 279:
6. Dispute Resolution. a. The Parti
- Page 280 and 281:
f. Entire Agreement. This Agreement
- Page 282 and 283:
Diesel Gallon Equivalent (DGE) per
- Page 284 and 285:
COMPRESSED NATURAL GAS FUELING AND
- Page 286 and 287:
“Royalty Payment” means the mon
- Page 288 and 289:
(iii) If any of the Conditions Prec
- Page 290 and 291:
(c) purchase Fuel and pay the Fuel
- Page 292 and 293:
thereof, Nopetro shall reduce the F
- Page 294 and 295:
Section 9. Notice. Notices required
- Page 296 and 297:
terms and conditions of the Waste C
- Page 298 and 299:
confidential and not subject to dis
- Page 300 and 301:
performed by or on behalf of Nopetr
- Page 302 and 303:
communications, representations, or
- Page 304 and 305:
Florida. Venue for all actions aris
- Page 306 and 307:
EXHIBIT A RATES, PRICE AND STATION
- Page 308 and 309:
Leon County Board of County Commiss
- Page 310 and 311:
Title: Approval of the Agreement Ex
- Page 312 and 313:
FIRST AMENDMENT TO THE DESANTIS PRO
- Page 314 and 315:
DeSANTIS PROPORTIONATE SHARE TRAFFI
- Page 316 and 317:
Attachment #1 Page 5 of 17 WHEREAS,
- Page 319 and 320:
Attachment #1 Page 8 of 17 would ot
- Page 321:
Attachment #1 Page 10 of 17 16. Thi
- Page 327 and 328:
,_. N ExhibitC ITE Trip Generation
- Page 329 and 330:
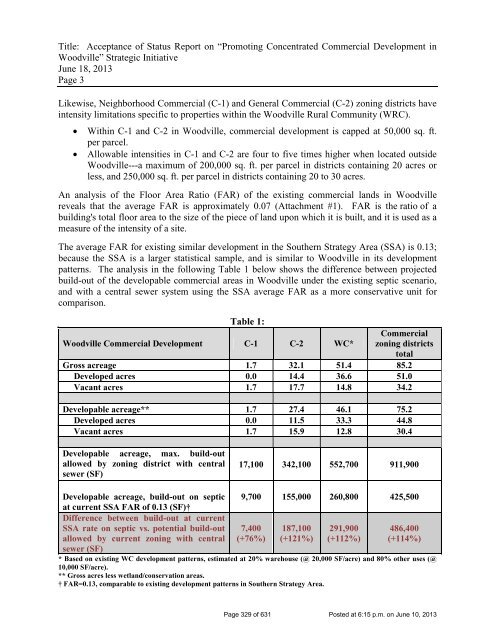
Leon County Board of County Commiss
- Page 331 and 332:
Title: Request to Schedule a First
- Page 333 and 334:
Title: Request to Schedule a First
- Page 335 and 336:
1 2 3 4 5 6 7 8 9 10 11 12 13 14 15
- Page 337 and 338:
1 2 3 4 5 6 7 8 9 10 11 12 13 14 15
- Page 339 and 340: 1 2 3 4 5 6 7 8 9 10 11 12 13 14 15
- Page 341 and 342: 1 2 3 4 5 6 7 8 9 10 11 12 13 14 15
- Page 343 and 344: 1 2 3 4 5 6 7 8 9 10 11 12 13 14 15
- Page 345 and 346: 1 2 3 4 5 6 7 8 9 10 11 12 13 F98-0
- Page 347 and 348: 3. Winching capacity ..... 50,000 L
- Page 349 and 350: 3. Wheel lift extended rating 2,500
- Page 351 and 352: 1 2 3 4 5 6 7 8 9 10 11 12 13 14 15
- Page 353 and 354: 1 2 3 4 5 6 7 8 9 10 11 12 13 14 15
- Page 355 and 356: 1 2 3 4 5 6 7 8 9 10 11 12 13 14 15
- Page 357 and 358: 1 2 3 4 5 6 7 8 9 10 11 12 13 14 15
- Page 359 and 360: 1 2 3 4 5 6 7 8 9 10 11 12 13 14 15
- Page 361 and 362: 1 2 3 4 5 6 7 8 9 10 11 12 13 14 15
- Page 363 and 364: (a) It shall be unlawful for any pe
- Page 365 and 366: c. Within the previous five years,
- Page 367 and 368: Sec. 20-165 164. - Authorization. (
- Page 369 and 370: equest to remove the specific vehic
- Page 371 and 372: operation of a business is impeded
- Page 373 and 374: towing company owners by October 31
- Page 375 and 376: (1) Garage liability insurance in a
- Page 377 and 378: Monday Mileage rate per-mile charge
- Page 379 and 380: (2) Effective July 1, 2009, the max
- Page 381 and 382: e charged three days after the tow
- Page 383 and 384: Leon County Board of County Commiss
- Page 385 and 386: Title: Acceptance of Status Report
- Page 387 and 388: Title: Acceptance of Status Report
- Page 389: To: Leon County Board of County Com
- Page 393: ART LN PAGE RD BISMARK RD 1.9 OL D
- Page 402 and 403: To: Leon County Board of County Com
- Page 404 and 405: Title: Acceptance of Cultural Plan
- Page 406 and 407: EDUCATION Attachment #1 Page 2 of 7
- Page 408 and 409: Attachment #1 Page 4 of 7 additiona
- Page 410 and 411: levels of the organization. Priorit
- Page 412 and 413: Summary of Cultural Contract Fundin
- Page 414 and 415: To: Leon County Board of County Com
- Page 416 and 417: Title: Acceptance of a Status Repor
- Page 418 and 419: DELICIOUS TASTES Dinner Prix Fixe M
- Page 420 and 421: DELICIOUS TASTES Dinner Prix Fixe M
- Page 422 and 423: Leon County Board of County Commiss
- Page 424 and 425: Title: Acceptance of the 2013 Flori
- Page 426 and 427: Title: Acceptance of the 2013 Flori
- Page 428 and 429: Title: Acceptance of the 2013 Flori
- Page 430 and 431: Title: Acceptance of the 2013 Flori
- Page 432 and 433: Title: Acceptance of the 2013 Flori
- Page 434 and 435: Title: Acceptance of the 2013 Flori
- Page 436 and 437: Title: Acceptance of the 2013 Flori
- Page 438 and 439: Title: Acceptance of the 2013 Flori
- Page 440 and 441:
Title: Acceptance of the 2013 Flori
- Page 442 and 443:
Title: Acceptance of the 2013 Flori
- Page 444 and 445:
Title: Acceptance of the 2013 Flori
- Page 446 and 447:
Title: Acceptance of the 2013 Flori
- Page 448 and 449:
Title: Acceptance of the 2013 Flori
- Page 450 and 451:
Fiscal Impact: This item does not h
- Page 452 and 453:
Attachment #1 Page 4 of 13 State Lo
- Page 454 and 455:
PROPOSED LEON COUNTY 2013 STATE LEG
- Page 456 and 457:
Attachment #1 Page 8 of 13 Action:
- Page 458 and 459:
Attachment #1 Page 10 of 13 The ser
- Page 460 and 461:
Attachment #1 Page 12 of 13 Staff h
- Page 462 and 463:
BOARD OF COUNTY COMMISSIONERS INTER
- Page 464 and 465:
May 16,2013 Page 3 agricultural by
- Page 466 and 467:
May 16,2013 Page 5 Attachment #2 Pa
- Page 468 and 469:
May 16,2013 Page 7 House Bill 437-
- Page 470 and 471:
May 16,2013 Page 9 Attachment #2 Pa
- Page 472 and 473:
May 16,2013 Page 11 Attachment #2 P
- Page 474 and 475:
May 16,2013 Page 13 The Florida Sma
- Page 476 and 477:
May 16,2013 Page 15 Attachment #2 P
- Page 478 and 479:
May 16,2013 Page 17 Attachment #2 P
- Page 480 and 481:
May 16,2013 Page 19 House Bill537-
- Page 482 and 483:
May 16,2013 Page 21 Attachment #2 P
- Page 484 and 485:
CAPITOL NEWS FOR 2013 LEGISLATIVE S
- Page 486 and 487:
Attachment #3 Page 4 of 21 addition
- Page 488 and 489:
Attachment #3 Page 6 of 21 economic
- Page 490 and 491:
Schedule for Bill Signings - The Go
- Page 492 and 493:
Attachment #3 Page 10 of 21 • Gen
- Page 494 and 495:
Attachment #3 Page 12 of 21 • Gen
- Page 496 and 497:
comprehensive plan or map amendment
- Page 498 and 499:
public purpose, to exempt such use
- Page 500 and 501:
Attachment #3 Page 18 of 21 SB 518
- Page 502 and 503:
_______________ HB 1193 - Relating
- Page 504 and 505:
Commissioners BILL PROCfOR District
- Page 506:
Attachment #4 Page 3 of 3 Now, Ther
- Page 509 and 510:
Attachment #6 Page 2 of 11 Rules of
- Page 511 and 512:
Attachment #6 Page 4 of 11 Rules of
- Page 513 and 514:
Attachment #6 Page 6 of 11 Rules of
- Page 515 and 516:
Attachment #6 Page 8 of 11 Rules of
- Page 517 and 518:
Attachment #6 Page 10 of 11 Rules o
- Page 519 and 520:
MEMORANDUM To: Leon County Board of
- Page 521 and 522:
Memorandum Page 3 collect the tax b
- Page 523 and 524:
-2- Attachment #7 Page 5 of 7 Patto
- Page 525:
AGREEMENT BETWEEN LEON COUNTY AND P
- Page 531 and 532:
AGREEMENT BETWEEN LEON COUNTY AND C
- Page 535 and 536:
AGREEMENT BETWEEN LEON COUNTY AND C
- Page 537 and 538:
To: Leon County Board of County Com
- Page 539 and 540:
Title: Approval to Award a Bid to S
- Page 543:
Albert Sessions - Approved applicat
- Page 547 and 548:
To: Leon County Board of County Com
- Page 549:
Title: Approval to Award Bid to Thy
- Page 553 and 554:
To: Leon County Board of County Com
- Page 555 and 556:
Title: Approval of Agreement Awardi
- Page 557 and 558:
AGREEMENT BETWEEN LEON COUNTY AND A
- Page 559 and 560:
AGREEMENT BETWEEN LEON COUNTY AND A
- Page 561 and 562:
AGREEMENT BETWEEN LEON COUNTY AND A
- Page 564 and 565:
AGREEMENT BETWEEN LEON COUNTY AND A
- Page 566 and 567:
Bid Title: Sidewalk and Associated
- Page 568:
Bid Title: Sidewalk and Associated
- Page 571 and 572:
Bid Title: Sidewalk and Associated
- Page 573 and 574:
Bid Title: Sidewalk and Associated
- Page 575 and 576:
Bid Title: Sidewalk and Associated
- Page 577 and 578:
Bid Title: Sidewalk and Associated
- Page 579 and 580:
Bid Title: Sidewalk and Associated
- Page 581 and 582:
Bid Title: Sidewalk and Associated
- Page 583 and 584:
Bid Title: Sidewalk and Associated
- Page 586:
Bid Title: Sidewalk and Associated
- Page 589 and 590:
Bid Title: Sidewalk and Associated
- Page 591 and 592:
Bid Title: Sidewalk and Associated
- Page 593 and 594:
Bid Title: Sidewalk and Associated
- Page 595 and 596:
Bid Title: Sidewalk and Associated
- Page 602:
·Bid Title: Sidewalk and Associate
- Page 605:
'Bid Title: Sidewalk and Associated
- Page 618 and 619:
BID PRICING SHEET SIDEWALK CONTINUI
- Page 620 and 621:
Hale Contracting, Inc. met the M/WB
- Page 622 and 623:
RJP Enterprises, Inc. did not meet
- Page 624 and 625:
To: Leon County Board of County Com
- Page 626 and 627:
Title: Authorization to Negotiate a
- Page 628 and 629:
REQUEST FOR PROPOSALS FOR COMMERCIA
- Page 630 and 631:
Commercial Property Assessment Clea
- Page 632 and 633:
Commercial Property Assessment Clea
- Page 634 and 635:
Commercial Property Assessment Clea
- Page 636 and 637:
Commercial Property Assessment Clea
- Page 638 and 639:
Commercial Property Assessment Clea
- Page 640 and 641:
Commercial Property Assessment Clea
- Page 642 and 643:
Commercial Property Assessment Clea
- Page 644 and 645:
Commercial Property Assessment Clea
- Page 646 and 647:
Commercial Property Assessment Clea
- Page 648 and 649:
Commercial Property Assessment Clea
- Page 650 and 651:
Commercial Property Assessment Clea
- Page 652 and 653:
Commercial Property Assessment Clea
- Page 654 and 655:
Commercial Property Assessment Clea
- Page 656 and 657:
Commercial Property Assessment Clea
- Page 658:
RFP Title: Request for Proposals fo
- Page 661 and 662:
To: Leon County Board of County Com
- Page 663 and 664:
Title: Consideration of Full Board
- Page 665 and 666:
Contact Person/Staff: County: Ryan
- Page 667 and 668:
Yarbrough, J. Cameron Begin Term: 3
- Page 669 and 670:
Enterprise Zone Development Agency
- Page 671 and 672:
Members: Bowers, Keith Small Busine
- Page 673 and 674:
January 6, 2012 To Whom It May Conc
- Page 675 and 676:
RESOLUTION: 13 -___ RESOLUTION OF B
- Page 677 and 678:
MEMBERS Proctor, Stewart Structure
- Page 679 and 680:
From: "Snyder, Russell" To: "Coble
- Page 681 and 682:
Members: Shipman, Martin Seamons, F
- Page 683 and 684:
WQRKF,QRCE Your Employment Solution
- Page 685 and 686:
To: Leon County Board of County Com
- Page 687 and 688:
Title: First and Only Public Hearin
- Page 689 and 690:
1 2 3 4 5 6 7 8 9 10 11 12 13 14 15
- Page 691 and 692:
1 2 3 4 5 6 7 8 9 10 11 12 13 14 15