Diffusion Reaction Interaction for a Pair of Spheres - ETD ...
Diffusion Reaction Interaction for a Pair of Spheres - ETD ...
Diffusion Reaction Interaction for a Pair of Spheres - ETD ...
Create successful ePaper yourself
Turn your PDF publications into a flip-book with our unique Google optimized e-Paper software.
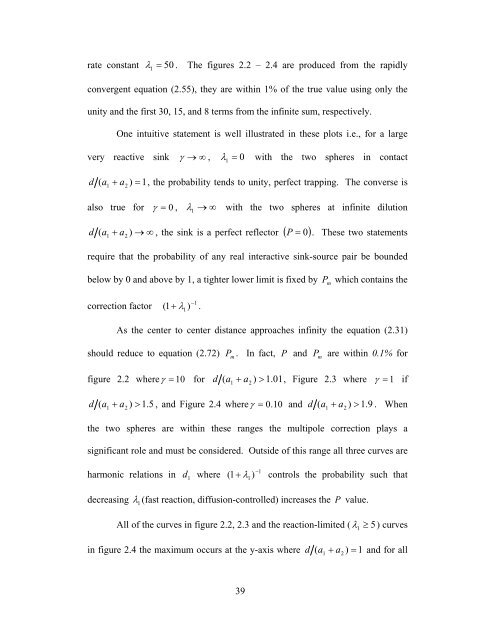
ate constant λ 50 . The figures 2.2 – 2.4 are produced from the rapidly<br />
1 =<br />
convergent equation (2.55), they are within 1% <strong>of</strong> the true value using only the<br />
unity and the first 30, 15, and 8 terms from the infinite sum, respectively.<br />
One intuitive statement is well illustrated in these plots i.e., <strong>for</strong> a large<br />
very reactive sink γ → ∞ , λ 0 with the two spheres in contact<br />
1 =<br />
d a + a ) = 1,<br />
the probability tends to unity, perfect trapping. The converse is<br />
( 1 2<br />
also true <strong>for</strong> γ = 0 , λ → ∞ with the two spheres at infinite dilution<br />
1<br />
d a + a ) → ∞ , the sink is a perfect reflector ( P = 0)<br />
. These two statements<br />
( 1 2<br />
require that the probability <strong>of</strong> any real interactive sink-source pair be bounded<br />
below by 0 and above by 1, a tighter lower limit is fixed by P which contains the<br />
−1<br />
correction factor ( 1+<br />
λ1)<br />
.<br />
As the center to center distance approaches infinity the equation (2.31)<br />
should reduce to equation (2.72) Pm . In fact, P and Pm<br />
are within 0.1% <strong>for</strong><br />
figure 2.2 whereγ<br />
= 10 <strong>for</strong> d a + a ) > 1.<br />
01,<br />
Figure 2.3 where γ = 1 if<br />
( 1 2<br />
d a + a ) > 1.<br />
5 , and Figure 2.4 whereγ = 0.<br />
10 and d a + a ) > 1.<br />
9 . When<br />
( 1 2<br />
m<br />
( 1 2<br />
the two spheres are within these ranges the multipole correction plays a<br />
significant role and must be considered. Outside <strong>of</strong> this range all three curves are<br />
−1<br />
harmonic relations in d1<br />
where ( 1+<br />
λ1)<br />
controls the probability such that<br />
decreasing<br />
λ 1 (fast reaction, diffusion-controlled) increases the P value.<br />
All <strong>of</strong> the curves in figure 2.2, 2.3 and the reaction-limited ( λ 5)<br />
curves<br />
in figure 2.4 the maximum occurs at the y-axis where d a + a ) = 1 and <strong>for</strong> all<br />
39<br />
( 1 2<br />
1 ≥


