EECE 480 Assignment 1 - Courses
EECE 480 Assignment 1 - Courses
EECE 480 Assignment 1 - Courses

You also want an ePaper? Increase the reach of your titles
YUMPU automatically turns print PDFs into web optimized ePapers that Google loves.
<strong>EECE</strong> <strong>480</strong> <strong>Assignment</strong> 1<br />
Due date: September 27; hand-in at the beginning of the class.<br />
Objective: To gain familiarity with the concepts of primitive unit cells, energy bands, energy bandgaps,<br />
and holes.<br />
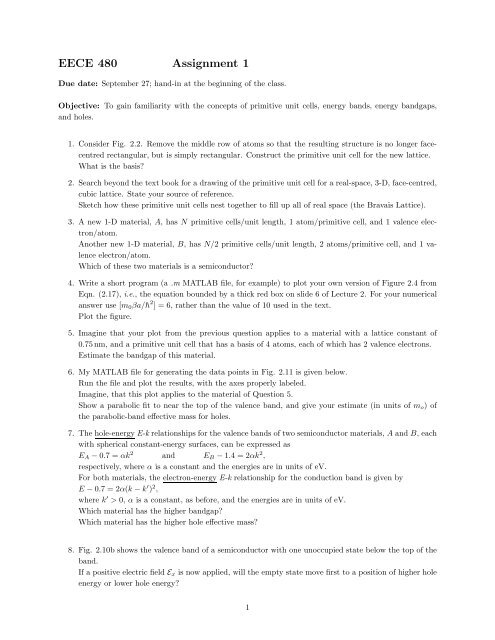
1. Consider Fig. 2.2. Remove the middle row of atoms so that the resulting structure is no longer facecentred<br />
rectangular, but is simply rectangular. Construct the primitive unit cell for the new lattice.<br />
What is the basis?<br />
2. Search beyond the text book for a drawing of the primitive unit cell for a real-space, 3-D, face-centred,<br />
cubic lattice. State your source of reference.<br />
Sketch how these primitive unit cells nest together to fill up all of real space (the Bravais Lattice).<br />
3. A new 1-D material, A, hasN primitive cells/unit length, 1 atom/primitive cell, and 1 valence electron/atom.<br />
Another new 1-D material, B, hasN/2 primitive cells/unit length, 2 atoms/primitive cell, and 1 valence<br />
electron/atom.<br />
Which of these two materials is a semiconductor?<br />
4. Write a short program (a .m MATLAB file, for example) to plot your own version of Figure 2.4 from<br />
Eqn. (2.17), i.e., the equation bounded by a thick red box on slide 6 of Lecture 2. For your numerical<br />
answer use [m0βa/¯h 2 ] = 6, rather than the value of 10 used in the text.<br />
Plot the figure.<br />
5. Imagine that your plot from the previous question applies to a material with a lattice constant of<br />
0.75 nm, and a primitive unit cell that has a basis of 4 atoms, each of which has 2 valence electrons.<br />
Estimate the bandgap of this material.<br />
6. My MATLAB file for generating the data points in Fig. 2.11 is given below.<br />
Run the file and plot the results, with the axes properly labeled.<br />
Imagine, that this plot applies to the material of Question 5.<br />
Show a parabolic fit to near the top of the valence band, and give your estimate (in units of mo) of<br />
the parabolic-band effective mass for holes.<br />
7. The hole-energy E-k relationships for the valence bands of two semiconductor materials, A and B, each<br />
with spherical constant-energy surfaces, can be expressed as<br />
EA − 0.7 =αk 2 and EB − 1.4 =2αk 2 ,<br />
respectively, where α is a constant and the energies are in units of eV.<br />
For both materials, the electron-energy E-k relationship for the conduction band is given by<br />
E − 0.7 =2α(k − k ′ ) 2 ,<br />
where k ′ > 0, α is a constant, as before, and the energies are in units of eV.<br />
Which material has the higher bandgap?<br />
Which material has the higher hole effective mass?<br />
8. Fig. 2.10b shows the valence band of a semiconductor with one unoccupied state below the top of the<br />
band.<br />
If a positive electric field Ex is now applied, will the empty state move first to a position of higher hole<br />
energy or lower hole energy?<br />
1
Advice:<br />
Make sure that all numerical answers are accompanied by their units.<br />
Matlab code for Fig. 2.11:<br />
% bandplot for delta-function results<br />
%uses fbands to get ga for a particular ka<br />
%24APR06<br />
%ka=ka/pi and ga=ga/pi<br />
ka=[0 0.2 0.4 0.6 0.8 1.0];<br />
ga1=[0.8364 0.8500 0.8871 0.9367 0.9814 1.0000];<br />
ga2=[2.0000 1.9637 1.8804 1.7887 1.7171 1.6984];<br />
ga3=[2.5678 2.6099 2.7112 2.8343 2.9475 3.0000];<br />
ga4=[4.0000 3.9331 3.7981 3.6533 3.5285 3.4723];<br />
ga5=[4.3988 4.4681 4.6105 4.7701 4.9205 5.0000];<br />
plot(ka,ga1.^2,’o’,-ka,ga1.^2,’o’, ka,ga2.^2,’o’,-ka,ga2.^2,’o’, ...<br />
ka,ga3.^2,’o’,-ka,ga3.^2,’o’, ka,ga4.^2,’o’,-ka,ga4.^2,’o’, ...<br />
ka,ga5.^2,’o’,-ka,ga5.^2,’o’)<br />
hold on;<br />
%fitting parabola to valence band<br />
Evb= ....... (fill in your expression);<br />
plot(ka,Evb, -ka,Evb)<br />
000 111<br />
000 111<br />
000 111<br />
000 111<br />
000 111<br />
000 111<br />
000 111<br />
000 111<br />
000 111<br />
000 111<br />
Figure 1: (Fig. 2.2 of text book) Example of a 2-D crystal comprising simple face-centred rectangular arrays of unshaded and<br />
shaded atoms. The Wigner-Seitz primitive unit cell is shown by the solid lines. These lines connect the perpendicular bisectors<br />
of the lines joining one unshaded atom to each neighbouring unshaded atom. One atom from the shaded array falls within the<br />
primitive unit cell; thus, this crystal structure has a basis of two atoms.<br />
2<br />
00 11<br />
00 11<br />
00 11<br />
00 11<br />
00 11<br />
00 11<br />
00 11<br />
00 11<br />
00 11<br />
00 11<br />
00 11<br />
00 11<br />
00 11<br />
00 11
cos(ga)+ 10sin(ga)/ga<br />
12<br />
10<br />
8<br />
6<br />
4<br />
2<br />
0<br />
−2<br />
−4<br />
−6 −4 −2 0 2 4 6<br />
Figure 2: (Fig. 2.4 of text book) Plot of Eqn. 2.17 for m0βa<br />
¯h 2<br />
<br />
= 10, showing the allowed values of ga, i.e., those within the<br />
dashed lines. The forbidden values of ga lie in the areas outside the dashed lines.<br />
Electron energy<br />
(a)<br />
Figure 3: (Fig. 2.10 of text book) Hole energy. (a) Excitation of an electron to a higher energy state in the valence band. (b)<br />
After the excitation, the hole can be viewed as having gained energy, i.e., the hole energy increases downwards.<br />
3<br />
ga/π<br />
(b)<br />
Hole energy
E / (h 2 /8ma 2 )<br />
35<br />
30<br />
25<br />
20<br />
15<br />
10<br />
5<br />
−1 −0.5 0<br />
ka/π<br />
0.5 1<br />
Figure 4: (Fig. 2.11 of text book) Fitting of parabolae to the 4th and 5th bands of Fig. 2.6.<br />
4