Download Full Paper - Sathyabama University
Download Full Paper - Sathyabama University
Download Full Paper - Sathyabama University

Create successful ePaper yourself
Turn your PDF publications into a flip-book with our unique Google optimized e-Paper software.
International Journal on Applied Bioengineering, Vol.2, No.1, July 2008<br />
BIOSORPTION OF ACID RED 88 ONTO AZOLLA PINNATA: EQUILIBRIUM AND<br />
KINETIC STUDIES<br />
1 2<br />
Vijayaraghavan K. and Padmesh T.V.N.<br />
1<br />
Division of Environmental and Chemical Engineering,<br />
Research Institute of Industrial Technology, Chonbuk National <strong>University</strong>, Chonju, South Korea.<br />
2<br />
Department of Chemical Engineering, Sathaybama <strong>University</strong>, Chennai, India<br />
1<br />
E-mail: padmeshtvn@yahoo.com<br />
ABSTRACT<br />
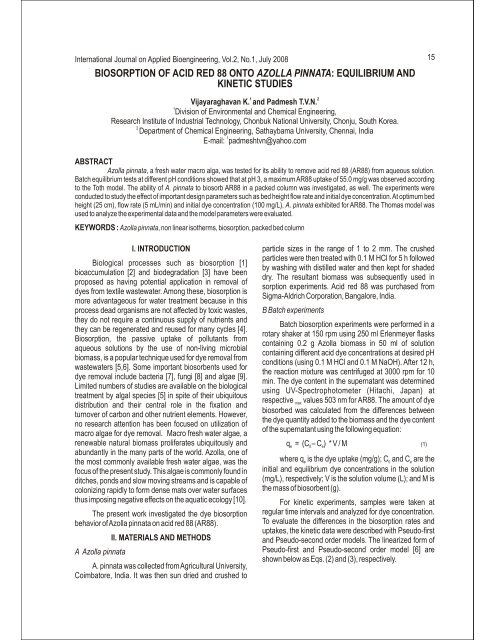
Azolla pinnata, a fresh water macro alga, was tested for its ability to remove acid red 88 (AR88) from aqueous solution.<br />
Batch equilibrium tests at different pH conditions showed that at pH 3, a maximum AR88 uptake of 55.0 mg/g was observed according<br />
to the Toth model. The ability of A. pinnata to biosorb AR88 in a packed column was investigated, as well. The experiments were<br />
conducted to study the effect of important design parameters such as bed height flow rate and initial dye concentration.At optimum bed<br />
height (25 cm), flow rate (5 mL/min) and initial dye concentration (100 mg/L), A. pinnata exhibited for AR88. The Thomas model was<br />
used to analyze the experimental data and the model parameters were evaluated.<br />
KEYWORDS : Azolla pinnata, non linear isotherms, biosorption, packed bed column<br />
I. INTRODUCTION<br />
Biological processes such as biosorption [1]<br />
bioaccumulation [2] and biodegradation [3] have been<br />
proposed as having potential application in removal of<br />
dyes from textile wastewater. Among these, biosorption is<br />
more advantageous for water treatment because in this<br />
process dead organisms are not affected by toxic wastes,<br />
they do not require a continuous supply of nutrients and<br />
they can be regenerated and reused for many cycles [4].<br />
Biosorption, the passive uptake of pollutants from<br />
aqueous solutions by the use of non-living microbial<br />
biomass, is a popular technique used for dye removal from<br />
wastewaters [5,6]. Some important biosorbents used for<br />
dye removal include bacteria [7], fungi [8] and algae [9].<br />
Limited numbers of studies are available on the biological<br />
treatment by algal species [5] in spite of their ubiquitous<br />
distribution and their central role in the fixation and<br />
turnover of carbon and other nutrient elements. However,<br />
no research attention has been focused on utilization of<br />
macro algae for dye removal. Macro fresh water algae, a<br />
renewable natural biomass proliferates ubiquitously and<br />
abundantly in the many parts of the world. Azolla, one of<br />
the most commonly available fresh water algae, was the<br />
focus of the present study. This algae is commonly found in<br />
ditches, ponds and slow moving streams and is capable of<br />
colonizing rapidly to form dense mats over water surfaces<br />
thus imposing negative effects on the aquatic ecology [10].<br />
The present work investigated the dye biosorption<br />
behavior ofAzolla pinnata on acid red 88 (AR88).<br />
II. MATERIALS AND METHODS<br />
A Azolla pinnata<br />
A. pinnata was collected fromAgricultural <strong>University</strong>,<br />
Coimbatore, India. It was then sun dried and crushed to<br />
particle sizes in the range of 1 to 2 mm. The crushed<br />
particles were then treated with 0.1 M HCl for 5 h followed<br />
by washing with distilled water and then kept for shaded<br />
dry. The resultant biomass was subsequently used in<br />
sorption experiments. Acid red 88 was purchased from<br />
Sigma-Aldrich Corporation, Bangalore, India.<br />
B Batch experiments<br />
Batch biosorption experiments were performed in a<br />
rotary shaker at 150 rpm using 250 ml Erlenmeyer flasks<br />
containing 0.2 g Azolla biomass in 50 ml of solution<br />
containing different acid dye concentrations at desired pH<br />
conditions (using 0.1 M HCl and 0.1 M NaOH). After 12 h,<br />
the reaction mixture was centrifuged at 3000 rpm for 10<br />
min. The dye content in the supernatant was determined<br />
using UV-Spectrophotometer (Hitachi, Japan) at<br />
respective max values 503 nm for AR88. The amount of dye<br />
biosorbed was calculated from the differences between<br />
the dye quantity added to the biomass and the dye content<br />
of the supernatant using the following equation:<br />
q e = (C 0–C) e *V/M (1)<br />
where qeis the dye uptake (mg/g); C0and Ceare the<br />
initial and equilibrium dye concentrations in the solution<br />
(mg/L), respectively; V is the solution volume (L); and M is<br />
the mass of biosorbent (g).<br />
For kinetic experiments, samples were taken at<br />
regular time intervals and analyzed for dye concentration.<br />
To evaluate the differences in the biosorption rates and<br />
uptakes, the kinetic data were described with Pseudo-first<br />
and Pseudo-second order models. The linearized form of<br />
Pseudo-first and Pseudo-second order model [6] are<br />
shown below as Eqs. (2) and (3), respectively.<br />
15
16 Vijayaraghavan et al : Biosorption of Acid red 88 onto Azolla pinnata: ....<br />
(2)<br />
where qt is the amount of dye sorbed at time t (mg/g)<br />
and k1 is the first order rate constant (1/min); k2 is the<br />
second order rate constant (g/mg min).<br />
C Biosorption isotherm models<br />
Four equilibrium isotherm models were used to fit<br />
the experimental data. These isotherms are the following:<br />
Langmuir: (4)<br />
Freundlich : (5)<br />
Toth : (6)<br />
Khan : (7)<br />
where q is the maximum dye uptake (mg/g), b is<br />
max<br />
the Langmuir equilibrium constant (L/mg), K is the<br />
F<br />
Freundlich constant (L/g), n is the Freundlich constant, b T<br />
is the Toth model constant and n the Toth model exponent;<br />
T<br />
b is the Khan model constant and a the Khan model<br />
K K<br />
exponent. All the model parameters were evaluated by<br />
®<br />
non-linear regression using MATLAB software.<br />
D Column experiments<br />
Continuous flow sorption experiments were<br />
conducted in a glass column (2 cm internal diameter and<br />
35 cm height). At the top of the column; an adjustable<br />
plunger was attached with a 0.5 mm stainless sieve. At the<br />
bottom of the column, a 0.5 mm stainless sieve was<br />
attached followed by glass wool. A 2 cm high layer of glass<br />
beads (1.5 mm in diameter) was placed at the column base<br />
in order to provide a uniform inlet flow of the solution into<br />
the column.<br />
(3)<br />
A known quantity of A. pinnata was packed in the<br />
column to yield the desired bed height of the sorbent. Dye<br />
solution of known concentration was pumped upward<br />
through the column at a desired flow rate by a peristaltic<br />
pump (Miclins). The concentration of dye at the vent of the<br />
column was collected at regular time intervals.<br />
The breakthrough time (t , the time at which dye<br />
b<br />
concentration in the effluent reached 1 mg/L) and bed<br />
exhaustion time (t , the time at which dye concentration in<br />
e<br />
the effluent reached the inlet condition) were used to<br />
evaluate the breakthrough curves. The slope of the<br />
breakthrough curve (dc/dt) was determined from t to t .<br />
b e<br />
The total quantity of dye mass biosorbed in the column<br />
(m ) is calculated from the area above the breakthrough<br />
ad<br />
curve (outlet dye concentration (C) vs. time (t)) multiplied<br />
by the flow rate. Dividing the dye mass (m ) by the sorbent<br />
ad<br />
mass (M) leads to the uptake capacity (q) of the alga [11].<br />
Effluent volume (V ) can be calculated as follows [12]:<br />
eff<br />
where F is the volumetric flow rate (mL/min).<br />
Total amount dye sent to column (m total)<br />
can be calculated<br />
as follows [12]:<br />
where C is the inlet dye concentration (mg/L).<br />
0<br />
Total dye removal percent with respect to flow volume<br />
can be calculated as follows [12]:<br />
All continuous experiments were conducted at room<br />
0<br />
temperature (30 C).<br />
E. Modeling of column data<br />
The column biosorption data obtained at different<br />
bed heights, flow rates and dye concentrations were fitted<br />
using the Thomas model. The linearized form of Thomas<br />
model can be expressed as follows (13) :<br />
(10)<br />
(8)<br />
(9)<br />
(11)
International Journal on Applied Bioengineering, Vol.2, No.1, July 2008<br />
where kTh is the Thomas model constant (L/mgh), Q0 is the<br />
maximum solid-phase concentration of solute (mg/g), V is<br />
the throughput volume (L). The model constants kTh and Q0<br />
can be determined from a plot of ln[(C/C)-1] 0 against t [12].<br />
III. RESULTS AND DISCUSSION<br />
A. Batch Kinetic studies<br />
The experimental results of acid red 88 biosorption<br />
as a function of time on A. pinnata at various initial<br />
concentrations have been shown in Fig. 1. For AR 88,<br />
biosorption rate was slow and also the equilibrium time<br />
attainment increased with increasing dye concentration.<br />
On increasing the initial dye concentrations, the total dye<br />
uptake increased and the total percent removal<br />
decreased. On changing initial AR88 concentrations from<br />
10 to 1000 mg/L, the amount sorbed increased from 1.17<br />
to 45.6 mg/g at pH 3. But the removal efficiency decreased<br />
from 46.8 to 18.2% as the AR88 concentration increases<br />
from 10 to 1000 mg/L.<br />
This is because at lower concentration, the ratio of<br />
the initial moles of dye molecules to the available surface<br />
area is low and subsequently the fractional sorption<br />
becomes independent of initial concentration.<br />
Fig .1 Effect of initial dye concentration on uptake capacity of A. pinnata.<br />
Initial dye concentration: (?) 100 mg/L; ( ) 300 mg/L; ( ) 500 mg/L;<br />
( ) 700 mg/L; ( ) 1000 mg/L.<br />
However, at higher concentration the available sites<br />
of sorption becomes fewer compared to the moles of dye<br />
present and hence the percentage dye removal is<br />
dependent upon the initial dye concentration. It can be<br />
concluded that the rate of AR88 binding with alga biomass<br />
is more at initial stages, which gradually decreases and<br />
remains almost constant after an optimum period of 6-7 h.<br />
The rate constants, predicted equilibrium uptakes<br />
and the corresponding correlation coefficients for all<br />
concentrations tested have been calculated and<br />
summarized in Table 1. For AR88, correlation coefficients<br />
were found to be above 0.959, but the calculated q is not<br />
e<br />
equal to experimental q , suggesting the insufficiency of<br />
e<br />
Pseudo-first-order model to fit the kinetic data for the initial<br />
17<br />
concentrations examined. The reason for these<br />
differences in the qe values is that there is a time lag,<br />
possibly due to a boundary layer or external resistance<br />
controlling at the beginning of the sorption process.<br />
The Pseudo-second order model is based on the<br />
sorption capacity on the solid phase. Contrary to other<br />
well-established models, it predicts the behavior over the<br />
whole range of studies and it is in agreement with the<br />
binding mechanism being the rate-controlling step.<br />
Table-1. Pseudo-first Order Model Constants<br />
This was consistent with the better results obtained<br />
with the Pseudo-second order model (Table 2). Correlation<br />
coefficients were always greater than 0.992 and the lowest<br />
correlation coefficient in this case was better than the first<br />
order model correlation coefficients. The values of<br />
predicted equilibrium sorption capacities showed good<br />
agreement with the experimental equilibrium uptake<br />
values.<br />
B. Batch studies<br />
Experimental AR88 biosorption isotherms for A.<br />
pinnata at different pH conditions (2-5) and temperature<br />
0<br />
(25-35 C) are presented in Fig. 2. Initial solution pH played<br />
a relatively significant role in dye biosorption, with<br />
maximum AR88 biosorption observed at pH 3. A slightly<br />
decreased AR88 biosorption at other pH values may be<br />
due to nature of binding groups present in the alga.
18 Vijayaraghavan et al : Biosorption of Acid red 88 onto Azolla pinnata: ....<br />
Table-2. Pseudo-second Order Model Constants<br />
The temperature affected the AR88 biosorption<br />
capacity of A. pinnata. Among the temperature conditions<br />
0<br />
examined, room temperature (30 C) favored biosorption.<br />
0<br />
Changing the temperature by ±5 C from the room<br />
temperature resulted in decreased AR88 biosorption<br />
capacity.<br />
Fig .2 Biosorption isotherms of AR88 for A. pinnata at different conditions<br />
(biomass dosage = 4 g/l and agitation rate = 150 rpm). pH and temperature:<br />
0 0 0 0 0<br />
() 2 and 30 C; ( ) 3 and 30 C; ( ) 4 and 30 C; () 5 and 30 C; (+) 3 and 25 C;<br />
0 0<br />
( ) 3 and 35 C; ( ) 3 and 40 C; respectively<br />
Langmuir, Freundlich, Toth and Khan models were<br />
used to describe the non-linear equilibrium between the<br />
sorbed AR88 on the alga (q) and AR88 in the solution (C).<br />
f<br />
The main reason for extended use of these isotherm<br />
models is that they incorporate constants that are easily<br />
interpretable. Langmuir sorption model served to estimate<br />
the maximum dye uptake values where they could not be<br />
reached in the experiments. Table 3. - shows maximum<br />
AR88 uptake of 53.76 mg/g was obtained at optimum pH<br />
0<br />
(3) and temperature (30 C)<br />
Table-3. Langmuir Model Parameters At<br />
Different pH Conditions<br />
To a lesser extent, the Freundlich model also described the<br />
equilibrium data. Both Freundlich constants (K and 1/n)<br />
also reached their maximum values at pH = 3.0 and<br />
0<br />
temperature = 30 C (Table 4).<br />
Table-4. Freundlich Model Parameters At<br />
Different pH Conditions<br />
In the case of Toth model, the maximum uptake was<br />
0<br />
obtained in pH 3 and 30 C. The other two constants bT and<br />
nT were also maximum at pH 3 and at temperature 30C.<br />
The correlation coefficients in the range of 0.995 to 0.999<br />
were obtained and the model parameters varied with the
International Journal on Applied Bioengineering, Vol.2, No.1, July 2008<br />
conditions examined. The model reasonably fits the<br />
equilibrium data at all conditions examined. According to<br />
the Khan model constant, q , observed were maximum at<br />
max<br />
0<br />
the optimum condition (pH 3.0 and 30 C), whereas other<br />
two constants (b and a ) lowest at this condition (Table 6).<br />
K K<br />
A typical example of batch sorption isotherm fitted using<br />
four examined models is shown in Fig .3.<br />
D. Column studies<br />
Biosorption of AR88 by A. pinnata was presented in the<br />
form of breakthrough curves.<br />
Table-5. Toth model parameters at<br />
different pH conditions<br />
Fig .4 shows the breakthrough profile of AR88 biosorption for different bed<br />
heights (15, 20 and 25 cm). In order to yield different bed heights, 4.52, 6.14<br />
and 7.89 g of biomass were added to produce 15, 20 and<br />
25 cm, respectively<br />
Table-6. Khan model parameters at<br />
different pH conditions<br />
Fig .3. Application of isotherm models to experimental isotherm data obtained<br />
0<br />
during AR88 biosorption by A. pinnata (pH = 3, tempera ture = 30 C, agitation<br />
rate = 150 rpm, biosorbent dosage = 4 g/l).<br />
Fig .4. Breakthrough curves for AR88 biosorption onto A. pinnata biomass at<br />
different bed heights (flow rate = 5 mL/min, initial AR88 concentration = 100<br />
mg/L, pH = 3). Bed heights: ( ) 15 cm; ( ) 20 cm; (?) 25 cm. (------)<br />
Predicted from Thomas model.<br />
19<br />
Fig .5 shows the influence of flow rate on biosorption ofAR88<br />
by A. pinnata by keeping initial dye concentration (100 mg/L) and<br />
bed height (25 cm) constant and varying the flow rate from 5 to<br />
15 mL/min. In contrast to bed height results, the column<br />
performed well at lowest flow rate. Earlier breakthrough time<br />
appeared for highest flow rate, resulting in low uptake and least<br />
% removal. This behavior may be due to insufficient time for the<br />
solute inside the column and the diffusion limitations of the<br />
solute into the pores of the sorbent at higher flow rates [14].<br />
Fig .5. Breakthrough curves for AR88 biosorption onto A. pinnata biomass at<br />
different flow rates (bed height = 25 cm, initial AR88 concentration = 100<br />
mg/L, pH = 3). Flow rates: (?) 5 mL/min; ( ) 10 mL/min; ( ) 15 mL/min. (------)<br />
Predicted from Thomas model.<br />
The breakthrough curves obtained by changing AR88<br />
concentration from 50 to 100 mg/L at 5 mL/min flow rate<br />
and 25 cm bed height are shown in Fig .6. At the highest<br />
AR88 concentration (100 mg/L) the Azolla bed saturated<br />
quickly leading to earlier breakthrough and exhaustion
20 Vijayaraghavan et al : Biosorption of Acid red 88 onto Azolla pinnata: ....<br />
time. Fig .6, shows that highest uptake and high<br />
percentage dye removal are obtained at the highest dye<br />
concentration. Also more positive and steep breakthrough<br />
curve was obtained for 100 mg dye/L. The driving force for<br />
biosorption is the concentration difference between the<br />
dye on the biosorbent and the dye in the solution [22]. Thus<br />
the high driving force due to the high AR88 concentration<br />
resulted in better column performance. Comparison of<br />
experimentally determined and Thomas model predicted<br />
breakthrough curves are shown in Figs. 4, 5 and 6. As bed<br />
height increased, the values of Q increased and the<br />
0<br />
values of k decreased. The bed capacity Q decreased<br />
Th 0<br />
and Thomas constant k increased with increasing flow<br />
Th<br />
rate. In general, good fits were obtained in all cases with<br />
correlationcoefficientsrangingfrom0.992to0.999forAR88.<br />
C/C0<br />
1<br />
0.75<br />
0.5<br />
0.25<br />
0<br />
Initial Dye Concentration<br />
0 20 40 60 80<br />
Time (h)<br />
Fig .6 Breakthrough curves for AR88 biosorption onto A. pinnata biomass at<br />
different dye concentrations (bed height = 25cm, flow rate = 5mL/min, pH =<br />
3). Initial AR88 concentrations: ( ) 50 mg/L; ( ) 75 mg/L; (?) 100 mg/L. (------)<br />
Predicted from Thomas model.<br />
IV. SUMMARY AND CONCLUSION<br />
The present study investigated the following<br />
features of dye biosorption on deactivated macro blue<br />
green fresh water alga A. pinnata in a batch reactor and in<br />
a packed bed column. Batch experiments provided<br />
fundamental information regarding optimum pH and<br />
maximum dye uptake. Langmuir and Toth model<br />
isotherms fit well with experimental data. Column<br />
experiments were performed in a packed column, as it<br />
makes the best use of the concentration difference known<br />
to be a driving force for adsorption. Thus, A. pinnata<br />
possesses all intrinsic characteristics to be employed for<br />
the treatment ofAcid red 88 bearing industrial effluents.<br />
REFERENCES<br />
[1] K.R. Ramakrishna and T. Viraraghavan, Dye removal<br />
using low cost adsorbents. Wat. Sci. Tech., 36 (1997)<br />
189-196.<br />
[2] Z. Aksu, Reactive dye bioaccumulation by<br />
Saccharomyces cerevisiae. Proc. Biochem., 38<br />
(2003) 1437-1444.<br />
[3] W.L. Chao and S.L. Lee, Decolorization of azo dyes<br />
by three white rot fungi: influence of carbon source.<br />
World J. Microbial. Biotechnol., 10 (1994) 556-559.<br />
[4] R.H.S.F. Vieira, B. Volesky, Biosorption: a solution to<br />
pollution?, Int. Microbial., 3 (2000) 17-24.<br />
[5] S. Venkatamohan, N. chandrasekhar Rao Y, K.<br />
Krishna prasad and J. Karthikeyan, Treatment of<br />
stimulated reactive yellow 22 (azo) dye effluents<br />
using spirogyra species. Waste management, 22<br />
(2002) 575-582.<br />
[6] Z. Aksu, Application of biosorption for the removal of<br />
organic pollutants a review. Proc. Biochem., 40<br />
(2004) 997-1026.<br />
[7] T.L. Hu, Removal of reactive dyes from aqueous<br />
solution by different bacterial genera. Wat. Sci.<br />
Technol., 34 (1996) 89-95.<br />
[8] Y. Fu and T. Viraraghavan, Removal of C.I. acid blue<br />
29 from an aqueous solution by Aspergillus niger.<br />
AATCC Mag., 1 (2001) 36-40.<br />
[9] Z. Aksu, and S. Tezer, Biosorption of reactive dyes on<br />
the green alga Chlorella vulgaris. Proc. Biochem., 40<br />
(2005) 1347-1361.<br />
[10] T.V.N. Padmesh, K. Vijayaraghavan, G. Sekaran and<br />
M. Velan, Batch and column studies on biosorption of<br />
acid dyes on fresh water macro alga Azolla<br />
filiculoides. J. Hazard. Mat., 125 (2005) 121-129.<br />
[11] B. Volesky, J. Weber, J.M. Park, Continuous-flow<br />
metal biosorption in a regenerable Sargassum<br />
column, Wat. Res., 37 (2003) 297-306.<br />
[12] Z. Aksu, F. Gönen, Biosorption of phenol by<br />
immobilized activated sludge in a continuous packed<br />
bed: prediction of breakthrough curves, Proc.<br />
Biochem., 39 (2003) 599-613.<br />
[13] G. Yan and T. Viraraghavan, Heavy metal removal in<br />
a biosorption column by immobilized M. rouxii<br />
biomass. Biores. Technol., 78 (2001) 243-249.<br />
[14] DCK. Ko, JF. Porter and G. McKay, Optimised<br />
correlations for the fixed-bed adsorption of metal ions<br />
on bone char. Chem. Eng.<br />
5829.<br />
Sci., 55 (2000) 5819-<br />
Dr K Vijayaragavan is Post<br />
Doctorate in Environmental<br />
Biotechnology from Chonbuk<br />
National <strong>University</strong>, South Korea. He<br />
is currently working for National<br />
<strong>University</strong> of Singapore in the<br />
Department of Environmental<br />
Science and Engineering. His<br />
contributions in the field of<br />
Environmental Biotechnology is immense.