Download PDF - Springer
Download PDF - Springer
Download PDF - Springer

You also want an ePaper? Increase the reach of your titles
YUMPU automatically turns print PDFs into web optimized ePapers that Google loves.
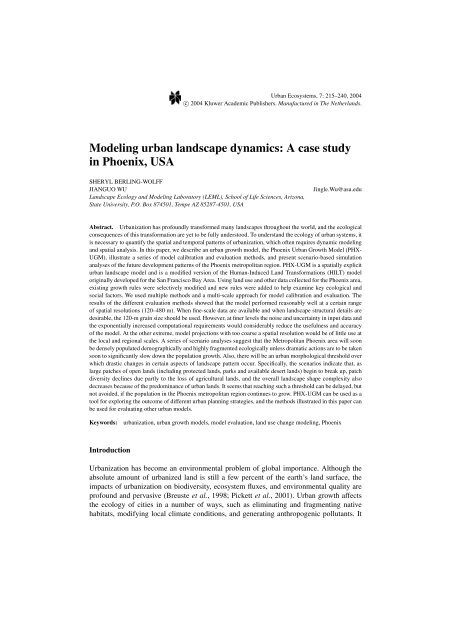
Urban Ecosystems, 7: 215–240, 2004<br />
c○ 2004 Kluwer Academic Publishers. Manufactured in The Netherlands.<br />
Modeling urban landscape dynamics: A case study<br />
in Phoenix, USA<br />
SHERYL BERLING-WOLFF<br />
JIANGUO WU Jingle.Wu@asu.edu<br />
Landscape Ecology and Modeling Laboratory (LEML), School of Life Sciences, Arizona,<br />
State University, P.O. Box 874501, Tempe AZ 85287-4501, USA<br />
Abstract. Urbanization has profoundly transformed many landscapes throughout the world, and the ecological<br />
consequences of this transformation are yet to be fully understood. To understand the ecology of urban systems, it<br />
is necessary to quantify the spatial and temporal patterns of urbanization, which often requires dynamic modeling<br />
and spatial analysis. In this paper, we describe an urban growth model, the Phoenix Urban Growth Model (PHX-<br />
UGM), illustrate a series of model calibration and evaluation methods, and present scenario-based simulation<br />
analyses of the future development patterns of the Phoenix metropolitan region. PHX-UGM is a spatially explicit<br />
urban landscape model and is a modified version of the Human-Induced Land Transformations (HILT) model<br />
originally developed for the San Francisco Bay Area. Using land use and other data collected for the Phoenix area,<br />
existing growth rules were selectively modified and new rules were added to help examine key ecological and<br />
social factors. We used multiple methods and a multi-scale approach for model calibration and evaluation. The<br />
results of the different evaluation methods showed that the model performed reasonably well at a certain range<br />
of spatial resolutions (120–480 m). When fine-scale data are available and when landscape structural details are<br />
desirable, the 120-m grain size should be used. However, at finer levels the noise and uncertainty in input data and<br />
the exponentially increased computational requirements would considerably reduce the usefulness and accuracy<br />
of the model. At the other extreme, model projections with too coarse a spatial resolution would be of little use at<br />
the local and regional scales. A series of scenario analyses suggest that the Metropolitan Phoenix area will soon<br />
be densely populated demographically and highly fragmented ecologically unless dramatic actions are to be taken<br />
soon to significantly slow down the population growth. Also, there will be an urban morphological threshold over<br />
which drastic changes in certain aspects of landscape pattern occur. Specifically, the scenarios indicate that, as<br />
large patches of open lands (including protected lands, parks and available desert lands) begin to break up, patch<br />
diversity declines due partly to the loss of agricultural lands, and the overall landscape shape complexity also<br />
decreases because of the predominance of urban lands. It seems that reaching such a threshold can be delayed, but<br />
not avoided, if the population in the Phoenix metropolitan region continues to grow. PHX-UGM can be used as a<br />
tool for exploring the outcome of different urban planning strategies, and the methods illustrated in this paper can<br />
be used for evaluating other urban models.<br />
Keywords: urbanization, urban growth models, model evaluation, land use change modeling, Phoenix<br />
Introduction<br />
Urbanization has become an environmental problem of global importance. Although the<br />
absolute amount of urbanized land is still a few percent of the earth’s land surface, the<br />
impacts of urbanization on biodiversity, ecosystem fluxes, and environmental quality are<br />
profound and pervasive (Breuste et al., 1998; Pickett et al., 2001). Urban growth affects<br />
the ecology of cities in a number of ways, such as eliminating and fragmenting native<br />
habitats, modifying local climate conditions, and generating anthropogenic pollutants. It
216 BERLING-WOLFF AND WU<br />
is widely recognized that the spatial pattern of a landscape affects ecological processes<br />
(Turner, 1989; Wu and Loucks, 1995). Understanding the reciprocal relationship between<br />
spatial pattern and ecological processes is at the heart of landscape ecology (Pickett and<br />
Cadenasso, 1995; Wu and Hobbs, 2002). Urban landscapes exhibit the most conspicuous<br />
spatial heterogeneity of all landscapes, and the spatial form a city takes affects physical,<br />
ecological and sociological processes within (Pickett et al., 1997; Zipperer et al., 2000;<br />
Wu and David, 2002). A landscape ecological perspective for urban ecosystems is not only<br />
appropriate, but imperative as well. The study of urban ecosystems needs to be considered<br />
in a landscape context, and the patterns and processes of urbanization should be integrated<br />
if the ecology of cities is to be fully understood (Foresman et al., 1997; Wu and David,<br />
2002).<br />
An important first step to understanding the ecology of cities is to adequately quantify<br />
the urban landscape pattern and project its spatiotemporal dynamics. Urban growth models<br />
play an instrumental role in this process. Urban modeling started in the 1950s and has<br />
experienced ups and downs in the past several decades (Lee, 1973, 1994; Harris, 1994).<br />
Several approaches to modeling urban growth have been developed by urban planners,<br />
geographers, and ecologists, and have been periodically reviewed (e.g., Batty, 1979, 1994;<br />
Harris, 1985; Wegener, 1994; Berling-Wolff and Wu, 2004; Guhathakurta, 2003). Since<br />
the 1980s, one of the most widely used modeling approaches in urban studies involves<br />
cellular automata (CA). Cellular automata are systems of cells interacting in simple ways<br />
but generating complex overall behavior. A cellular automaton (A) is defined by a lattice (L),<br />
a state space (Q), a neighborhood template (l) and a local transition function (f) expressed<br />
in set notation as<br />
A =〈L, Q, l, f〉 (1)<br />
A cell may be in any one of several discrete states defined by Q, and a set of transition<br />
rules, f, determines the future state of each cell as a function of the states of the neighboring<br />
cells. Time is discrete and all cells are updated at each time interval. Cellular automata are<br />
well suited to investigations of urban morphology due to their spatially explicit nature and<br />
capability of generating complex patterns. Indeed, many contemporary urban growth models<br />
in the literature are based on a CA framework. In general, CA is a powerful approach to<br />
modeling open, complex, self-organizing systems that emphasizes the way in which locally<br />
made decisions give rise to global patterns (Wu, 1998; Wu and David, 2002). Couclelis<br />
(1985) suggested that the classic cell-space models are not appropriate for studying specific<br />
urban systems, but rather should only be used to understand the driving forces that shape<br />
urban form. However, CA-based models have recently been applied to specific cities (e.g.,<br />
Batty et al., 1989; White and Engelen, 1993, 1994; Batty and Xie, 1994).<br />
To simulate the urban growth of the Phoenix metropolitan area, we have adapted an<br />
existing urban growth model, the Human-Induced Land Transformations (HILT) model,<br />
which was originally developed for the San Francisco Bay Area (Clarke et al., 1997; Kirtland<br />
et al., 1994). To make HILT applicable to Phoenix, a number of substantial changes had<br />
to be made. To distinguish the significantly modified version of HILT tailored for Phoenix<br />
from the original, we have named it PHX-UGM (Phoenix Urban Growth Model). In this
MODELING URBAN LANDSCAPE DYNAMICS 217<br />
paper, we discuss the structure and evaluation of PHX-UGM, and present the results of a<br />
scenario-based analysis of the future development of the Phoenix metropolitan region.<br />
The Phoenix metropolitan area<br />
The Phoenix metropolitan area is located in the State of Arizona, U.S.A., the northern<br />
part of the Sonoran desert in the American southwest. Phoenix has recently become the<br />
fastest growing major city in the United States, and this rapid urban expansion has substantially<br />
altered the composition and spatial structure of the landscape (Wu et al., 2000,<br />
2002; Jenerette and Wu, 2001; Luck and Wu, 2002). Habitation in the central Arizona area<br />
began several thousands of years ago with the Hohokam native people. That civilization<br />
disappeared long ago, but eventually others (typically ranchers and farmers) came and resettled<br />
the area. The rapid growth of the region began after World War II when agricultural<br />
interests tapped into ground and canal water so that continuous year-round farming could be<br />
supported (Gammage, 1998) and when air conditioners became readily available to make<br />
life comfortable. In the intervening years, the area has shifted from a mostly agricultural<br />
community to an industrial and commercial center. In 1985, farmers used 89% of Arizona<br />
water and produced 2% of the area’s income. Cities used 7% of the water and produced<br />
95% of the income.<br />
Certain characteristics are apparent in the spatial development of the Phoenix metropolitan<br />
area that distinguishe it from other cities (Morrison Institute for Public Policy, 2000).<br />
First, the population density has been increasing even as the urban extent increases. Second,<br />
the region’s center is holding; both population and employment rose in the regional center,<br />
avoiding the decay many cities have experienced. Third, the Phoenix metropolitan area<br />
has managed to maintain a balance among its major cities with respect to housing values,<br />
jobs and retail activity. Fourth, people and businesses keep coming; the Phoenix area has<br />
shown exponential growth over the last 50 years. Some urban morphological features of<br />
the Phoenix metropolitan area are also noteworthy. For example, new developments tend<br />
to be found only close to the urban fringe; expanding urbanization has left numerous nonurban/agricultural<br />
remnants scattered within the growing core area; there is mostly flat, open<br />
land available in all directions from the urban core with old, unpaved farm roads providing<br />
access to these areas. While there are large Native American reservations located to the east<br />
and south, these are some distance from the urban core and thus have exerted little influence<br />
on the direction of expansion.<br />
Model structure<br />
The HILT model<br />
PHX-UGM is a modified version of the Human-Induced Land Transformations (HILT)<br />
model which was originally developed by Clarke et al. (1997) to simulate regional urbanization<br />
patterns in the San Francisco Bay Area. The model has since been applied in different<br />
urban areas, including the Washington DC/Baltimore area and Albuquerque, New Mexico.
218 BERLING-WOLFF AND WU<br />
HILT is a self-modifying cellular automaton urban growth model that simulates a one-way<br />
transition from a non-urban category to an urban category. It involves (1) converting space<br />
to a grid, (2) establishing an initial set of conditions, (3) establishing a set of transition<br />
rules that are applied for each iteration, and (4) recursively applying the rules (figure 1).<br />
Four different types of urban growth are distinguished in HILT: spontaneous, diffusive,<br />
organic and road influenced (Clarke et al., 1997). For spontaneous neighborhood growth,<br />
Figure 1. Flowchart of the HILT model, showing the five phases through which urbanization is simulated (based<br />
on the descriptions in Clarke et al. (1997)).
MODELING URBAN LANDSCAPE DYNAMICS 219<br />
a randomly selected cell may become a new urban center, simulating the development<br />
of urban settlements in undeveloped areas. This growth type reflects the number of new<br />
centers that will be created—new center startups. For diffusive growth, a spontaneously<br />
urbanized cell (above) may develop into a spreading urban center even though it may not lie<br />
near an already established urban area—new center growth. For organic growth, a random<br />
cell may become urbanized if some of its neighbors are already urbanized—expansion of<br />
existing urban areas. Finally, for road influenced growth, urbanization may expand along<br />
road corridors, simulating the development seen in newly accessible areas.<br />
The urban growth rules in HILT involve selecting a location, investigating the spatial<br />
properties of the neighboring cells, and urbanizing the cell under consideration based on a<br />
set of weighted probabilities. A neighborhood in this model is determined by the 8-neighbor<br />
rule. There are five factors that control the behavior of the system: (1) a Diffusion Coefficient<br />
that determines the overall dispersiveness of the distribution both of single grid cells and in<br />
the movement of new settlements outward through the road system, (2) a Breed Coefficient<br />
that determines how likely a newly generated detached settlement is to begin its own growth<br />
cycle, (3) a Spread Coefficient that controls how much normal outward “organic” expansion<br />
takes place within the system, (4) a Slope Resistance factor that influences the likelihood of<br />
settlement extending up steeper slopes, and (5) a Road Gravity factor that has the effect of<br />
attracting new settlements onto the existing road system if they fall within a given distance of<br />
a road (Clarke et al., 1997). HILT is a self-modifying CA because the rules and parameters<br />
themselves are allowed to change to different, prescribed settings when the urban growth<br />
rate exceeds or drops below some critical value (Clarke et al., 1997). Self-modification of<br />
the parameters is allowed through an additional set of rules. These rules are designed to fit<br />
the form of urban growth such as those observed in the San Francisco Bay Area. If growth<br />
in a year exceeds the critical high value, the Diffusion, Spread and Breed Coefficients are<br />
increased, encouraging diffusive, organic and road influenced growth, respectively. As the<br />
urban areas enlarge to cover more of the cellular grid space, these factors are decreased<br />
to prevent exponential growth. If the growth rate falls below the critical low value, these<br />
variables are decreased to cause a tapering off of growth. As the road network is enlarged,<br />
the Road Gravity factor is increased to create a wider band of development around the<br />
roads. Finally, as available land decreases, the Slope Resistance factor decreases to allow<br />
development higher on hillsides.<br />
The four types of growth are implemented in the model through five sequential phases<br />
(figure 1). After initialization of the cellular grid, execution begins. During each subsequent<br />
time step (one year), each phase of the model is executed once. At completion of the run,<br />
output statistics and resulting images are recorded. Self-modification of the variables occurs<br />
before beginning the next cycle. Phase 1 models a simple diffusive process where a random<br />
cell on the map is selected and converted to urban, representing the possibility of occasional<br />
new small development springing up (extent of development limited to grain size) outside<br />
the urban core area. Once a random point has been selected, the slope at that location is<br />
used to determine either that it will not be urbanized or may yet be considered. If it is still<br />
under consideration, a random number (1–100) is selected; if that number is less than the<br />
Diffusion Coefficient, the cell becomes urbanized. Generally, the slighter the cell’s slope,<br />
the less likely it will be rejected outright, and the higher the Diffusion Coefficient, the
220 BERLING-WOLFF AND WU<br />
more likely it will be urbanized. Phases 2 and 3 are combined to represent random new<br />
developments spreading into several cells from booming development—a representative of<br />
a large development springing up. Again, a location is randomly selected and a random<br />
number (1–100) is generated. If the random number is less than the Breed Coefficient, the<br />
cell is being considered for urbanization. As in Phase 1, the slope at that location is used<br />
to determine whether to reject it outright, and if not, the cell is urbanized. Thus, the Breed<br />
Coefficient limits the number of cells to be considered and the slope limits the cells actually<br />
selected.<br />
Phase 3 is applied only to those cells urbanized in phase 2. Once the cell has been<br />
urbanized, a random neighbor (8-neighbor rule) is selected. If the cell is not rejected outright<br />
based on the slope at that location, that cell is urbanized also. This spread is repeated 3<br />
times, urbanizing up to 4 cells in one pass. Phase 4 represents the spread of existing urban<br />
areas into adjacent non-urbanized land. For a randomly selected cell neighboring an existing<br />
urban area, if a random number (1–100) is less than the Spread Coefficient, if at least 4 of its<br />
neighbors are also urban, and if the slope is allowable, it is urbanized. Phase 5 represents the<br />
spread of urbanization along transportation corridors. Some of the cells that were urbanized<br />
in the last time step are selected randomly based on the Diffusion Coefficient. One of these<br />
cells is selected at random, and if a cell of type “road” exists nearby, a walk is taken along<br />
the road (a cell to cell traverse, staying on the road cells) for the distance of 2 * Diffusion<br />
Coefficient. Once traveling has stopped, if the endpoint cell is not rejected outright based<br />
on the slope, the cell is urbanized. The Diffusion Coefficient limits the number of cells to<br />
be considered as starting points for road traversal as well as the distance traveled along the<br />
road. The Road Gravity parameter limits the distance for which a neighboring road will be<br />
searched. Again, the flatter the slope, the more likely a cell is urbanized.<br />
There are four major types of data used within the HILT model: (1) land-use data, (2)<br />
slope, (3) transportation and (4) protected lands. Land-use data and protected lands are used<br />
to determine the initial cell values at the start of simulation. The slope associated with each<br />
grid cell is used to determine the likelihood of urban growth development along hillsides,<br />
and the road information is used to influence the urbanization along transportation corridors<br />
(which in Phoenix tends to parallel the water distribution system).<br />
Major modifications to HILT<br />
We tested the applicability of HILT for the Phoenix region without any modification to the<br />
model structure by running the model from 1975 to 1995 with mid-range default parameter<br />
values. Land use data of 1975 and 1995 were used for model initialization, calibration<br />
and evaluation (see the following sections for more detail on running such simulations).<br />
These simulations produced only a fraction of the actual urban growth in the region. Then,<br />
we increased the parameters to their maximum values, but the model still significantly<br />
underestimated the urban growth. Our error analysis showed that 88% of the cells predicted<br />
as urban (this includes both seed and converted cells) were correct (user’s accuracy), but that<br />
only 33% of the urban growth was actually generated by the model (producer’s accuracy).<br />
Clearly, the model, without modification, was not able to adequately simulate the urban<br />
growth in the Phoenix metropolitan area. We realized that some new components needed
MODELING URBAN LANDSCAPE DYNAMICS 221<br />
to be added, and several aspects of the model must be substantially changed before HILT<br />
could be used for our research purposes.<br />
HILT includes only 3 cell types: urban, non-urban and exclusions. We added one new<br />
cell state, agriculture. The agriculture-to-urban transition has been an important part of the<br />
urbanization in the Phoenix area, and it was necessary to be modeled explicitly for many<br />
research purposes. Cells may change from non-urbanized or agriculture to urbanized, but<br />
urban and excluded cells never change to any other type. We combined recreation and<br />
non-privately owned lands that are restricted from development into one single category,<br />
excluded lands.<br />
One notable characteristic of the Phoenix area is the leapfrog type of development, leaving<br />
remnant patches around and within neighborhoods and increasing landscape fragmentation.<br />
To capture this phenomenon, we modified HILT to allow for neighborhoods to be defined<br />
as wider bands of cells around a central cell rather than just the traditional 8-neighbor<br />
rule. Another striking characteristic of the Phoenix area is that urban growth has been<br />
taking place at an exponential rate. HILT used self-modifying rules to prevent just such<br />
behavior. We replaced the growth controlling variables with a human population growth<br />
model derived by empirical data (figure 2), so that the total area of new urbanized cells<br />
each year is directly influenced by population growth. To improve the prediction accuracy,<br />
the exponential population model was applied over relatively short periods (1912–1934–<br />
1955–1975–1995) for which both population size and density data existed. During program<br />
execution, once the population is estimated, the number of cells that needed to be urbanized<br />
in the current year is computed. Based on current density statistics, the model repeatedly<br />
runs through the five phases of growth until all the new urban cells have been allocated.<br />
To allow greater flexibility in experimenting with the growth rules and to simplify the<br />
procedures for changing runtime options, numerous code modifications were made to allow<br />
command line input and to utilize conditional compilation options. These changes eased the<br />
Figure 2. Population growth in the Phoenix metropolitan area. Dots are census data, and the line is the prediction<br />
from the exponential human population model, P = P0e rt . Note that the model was applied separately for four<br />
time periods (1912–1934–1955–1975–1995).
222 BERLING-WOLFF AND WU<br />
effort of experimentation with different grain sizes (for multi-scale analysis), simulation start<br />
dates, and rule modifications. Several supporting utilities were also developed to facilitate<br />
data preparation and the new methods of calibration and analysis (see below). Grid images<br />
for input were created by ArcView and results were written out and stored in an ArcView<br />
compatible format for ease of display.<br />
Model parameterization and calibration<br />
The extent of the study area is delimited by a 68.5 km × 88.75 km boundary centered on<br />
the Phoenix metropolitan area, as defined by CAP-LTER. The major data input used for<br />
parameterizing PHX-UGM included land-use maps for 1975 and 1995 with four classes: undeveloped<br />
desert, urbanized areas, recreation areas, and agriculture (Knowles-Yanez et al.,<br />
1999), maps of land ownership and 1978 road data layers obtained from the CAP-LTER<br />
database, and topographic information derived from the United States Geological Survey<br />
(USGS) digital elevation models (DEMs). All vector-based data files were converted into<br />
raster format using ArcView. An important reason for choosing the land use data of 1975 and<br />
1995 was that the rate of urbanization during this time period was extraordinary: urban land<br />
use increased from 7% in 1975 to 18% of the total area in 1995 (Knowles-Yanez et al., 1999).<br />
It is impossible to directly validate the model projections of future growth because we<br />
simply do not have the data. However, we can calibrate the model so that it describes,<br />
as accurately as possible, what has already happened. Then, based on past trends, we<br />
can project likely future patterns. This retrospective approach has inherent problems for<br />
studying complex self-organizing systems whose future, by definition, can not be predicted<br />
by its past (Wu and Marceau, 2002). However, we believe that this traditional modeling<br />
approach in combination with scenario-based analysis can still provide valuable insights<br />
about how urban landscapes may develop. Before such exploratory attempts, however,<br />
the model must be able to reproduce the known system behavior reasonably well. This<br />
often involves model calibration (or tuning), the process in which certain model parameters<br />
and constants are adjusted so that the agreement between model output and observations<br />
is improved. As described above, several variables control the probability for a cell to<br />
be urbanized (e.g. Diffusion Coefficient, Breed Coefficient, Spread Coefficient and Slope<br />
Resistance) and the distance along a road that urban development may take place (e.g. Road<br />
Gravity). Additionally, PHX-UGM has two new variables NEI HOOD and NEI RQMT<br />
that define the “neighborhood” and the number of neighbors that must be urbanized to<br />
consider urbanizing a new cell. The goal of calibrating the model is to find the combination<br />
of settings that yield the most satisfactory results.<br />
We followed the two calibration phases built in HILT: a visual version for general pattern<br />
comparison and a more computationally efficient batch version for quantitative evaluation.<br />
The visual phase is used to establish meaningful ranges of values as well as to verify that<br />
growth is proceeding within reasonable bounds, while the second phase involves a variety of<br />
statistical measures. Based on preliminary sensitivity analysis, we selected only a small set<br />
of parameters for model calibration, including Diffusion, Breed, Spread, and Road Gravity.<br />
There were 1024 different combinations run in total. The performance was evaluated using<br />
the Lee-Sallee value as described in Clarke et al. (1997).
MODELING URBAN LANDSCAPE DYNAMICS 223<br />
Model evaluation<br />
Model evaluation is an important part of the modeling process although model “validation”<br />
for complex systems is extremely difficult or impossible (Oreskes et al., 1994; Rykiel,<br />
1996; Wu and Marceau, 2002). We based our model evaluation on the empirical land use<br />
map compiled using remote sensing and survey data for 1995, although we understood that<br />
the empirical map itself inevitably had errors. To facilitate model evaluation, we used two<br />
different versions of PHX-UGM, one for visual inspection with graphic output, and the<br />
other for quantitative evaluation. The visual inspection produced a qualitative comparison<br />
of the general growth pattern between the simulated and empirical maps. For quantitative<br />
evaluation, we used several methods to determine the accuracy of model projections. To<br />
examine possible scale effects (Jelinski and Wu, 1996; Wu et al., 2002; Wu, 2004), we ran<br />
the model at five different grain sizes, most of which are multiples of the TM resolution (60,<br />
120, 240, 480, and 1000 m), with input data also corresponding to those grain sizes. The<br />
rasterization of the land use maps at these different specified resolutions was implemented<br />
following the majority rule using the ArcView GIS (geographic information systems). We<br />
were not able to conduct the same simulations at the resolution of 30 m because of excessive<br />
computational demands. Figure 3 is a visual comparison between the 1995 empirical land<br />
use map and a simulated land use map for the same year. In the following, we shall focus<br />
on the results of three quantitative model evaluation methods: (1) error matrix, (2) multiple<br />
resolution goodness-of-fit, and (3) landscape metrics.<br />
Error matrix<br />
A commonly used method to evaluate mapping accuracy is to construct an error matrix. The<br />
error matrix is a table that counts both the number of correctly identified and misidentified<br />
cells. From the error matrix, one can compute the user’s accuracy—the percentage of cells<br />
identified as urban on the model output map that were actually urban on the empirical map—<br />
and the producer’s accuracy—the percentage of urban cells on the empirical map that were<br />
correctly projected on the model output map (Congalton and Green, 1999). For the 5 grain<br />
sizes of 1000, 480, 240, 120, and 60 m 2 , the user’s accuracy for the urban class was 77, 74,<br />
72, 72, and 66%, and the producer’s accuracy for the urban class was 77, 72, 72, 74, and<br />
77%. The overall average accuracy, the ratio of the correctly identified cells of all classes to<br />
the total number of cells, was 79, 78, 76, 77, and 75% at the 5 grain sizes. Thus, the overall<br />
and user’s accuracy declined at coarser spatial resolutions. Based on visual comparison<br />
of the error maps that were produced by overlaying the simulated with empirical maps<br />
(not shown here), we found that, as grain size decreased, more spontaneous development<br />
occurred outside the core urban area, producing many scattered small patches. Additionally,<br />
more development occurred along the roads than is observed in the empirical data.<br />
Multiple resolution goodness-of-fit<br />
The error matrix method is based on a single-scale, cell-to-cell comparison, and may<br />
produce biased estimates of mapping accuracy (Shao et al., 2003). Turner et al. (1989)
224 BERLING-WOLFF AND WU<br />
Figure 3. The land use maps of the Phoenix metropolitan area in 1975 and 1995: (A) empirical map of 1975<br />
compiled from survey data, (B) empirical map of 1995 compiled from remote sensing and survey data, and (C)<br />
simulated map from PHX-UGM with a grain size of 120 m.
MODELING URBAN LANDSCAPE DYNAMICS 225<br />
indicated that comparison at one single resolution was not adequate for evaluating spatial<br />
models and thus suggested a multiple-resolution measure, or a multi-scale goodnessof-fit.<br />
This method requires intensive resampling with a moving window whose size is<br />
increased progressively. The average goodness-of-fit is repetitively calculated at each window<br />
size. The formula for the fit at a particular sampling window size, Fw,is(Turner et al.,<br />
1989):<br />
Fw =<br />
P tw<br />
s=1 1 −<br />
tw<br />
i=1 [a1i −a2i ]<br />
2w 2<br />
s<br />
where w is the linear dimension of the (square) sampling window, aki (k = 1, 2; referring<br />
to the two maps to be compared) is the number of cells of category i in scene k<br />
in the sampling window, P is the number of different categories in the sampling window,<br />
s denotes the moving window that slides through the map one cell at a time, and<br />
tw is the total number of sampling windows in the map for window size w. Iftwo maps<br />
are identical, Fw = 1, and it remains 1 for all sampling window sizes (w); if two maps<br />
have the same proportions of cover types, but very different spatial pattern, Fw will increase<br />
gradually with the window size; if the spatial patterns of the two maps are slightly<br />
different, Fw will increase rapidly at first and soon start to approach 1 (Turner et al.,<br />
1989).<br />
We selected seven window sizes (1 × 1, 2 × 2, 4 × 4, 8 × 8, 16 × 16, 32 × 32, and<br />
64 × 64 pixels), and a multi-scale goodness-of-fit plot was accordingly constructed<br />
(figure 4). In all cases, Fw increased rapidly first and then tended to approach the maximum<br />
value of 1 (figure 4a). While the overall goodness-of-fit was quite high for all window<br />
sizes (due partly to the large proportion of desert area), the mean value of Fw (averaged<br />
over all window sizes) varied among the five different grain sizes (figure 4b). To quantify<br />
the differences, we had 30 simulation runs at each grain size and then computed the mean<br />
goodness-of-fit over all sampling window sizes for each grain size. This result suggested<br />
the existence of a limited range of grain sizes (i.e., 120–480 meters) for which the overall<br />
fit of the model was higher.<br />
Landscape indices<br />
Error matrix and multiple resolution goodness-of-fit are valuable for assessing the accuracy<br />
of spatial models, but it is difficult to determine how well the spatial patterns<br />
of the modeled and empirical maps match each other. However, the model accuracy in<br />
terms of spatial patterns may be important ecologically and technically, and can be assessed<br />
using landscape indices (Turner et al., 1989). Landscape ecologists have developed<br />
and applied a suite of indices to quantify spatial patterns in the past two decades<br />
(O’Neill et al., 1988; Turner et al., 1991; Gustafson, 1998; Wu et al., 2002). We used<br />
FRAGSTATS, a landscape analysis package developed by McGarigal and Marks (1995),<br />
to compute the values of 18 selected metrics at different grain sizes (Wu et al., 2002; Wu,<br />
2004). However, to reduce redundancy we report the results of only 6 metrics: number of<br />
patches (NP), edge density (ED), mean patch size (MPS), patch size coefficient of variation<br />
(2)
226 BERLING-WOLFF AND WU<br />
Figure 4. Multiple-scale goodness-of-fit, the Fw − w plot (A), and the means of Fw (B) for the PHX-UGM<br />
model at five different grain sizes. Each model projection shown here was the best performer of 30 sample runs<br />
for each grain size.
MODELING URBAN LANDSCAPE DYNAMICS 227<br />
Table 1. List of landscape metrics used for the evaluation of PHX-UGM (modified from Wu et al., 2002)<br />
Landscape metric Abbreviation Description<br />
Number of patches NP The total number of patches in the landscape.<br />
Edge density ED The total length of all edge segments per hectare for the class or<br />
landscape of consideration (unit: m/ha).<br />
Mean patch size MPS The average area of all patches in the landscape (unit: ha).<br />
Patch size coefficient PSCV The standard deviation of patch size divided by mean patch size<br />
of variation<br />
for the entire landscape (unit: percentage).<br />
Area-weighted mean<br />
patch shape index<br />
AWMSI Mean patch shape index weighted by relative patch size:<br />
AWMSI = m <br />
nj=1<br />
i=1<br />
Double-log fractal<br />
dimension<br />
0.25Pij<br />
√ aij<br />
aij<br />
A<br />
where Pij and aij are the perimeter and area of patch ij,<br />
respectively, A is the total area of the landscape, m is thenumber<br />
of patch types, and n is the total number of patches of type i<br />
(unitless).<br />
DLFD The fractal dimension for the entire landscape which is equal to<br />
2divided by the slope of the regression line between the<br />
logarithm of patch area and the logarithm of patch perimeter:<br />
2<br />
DLFD = mi=1 <br />
nj=1<br />
N (ln(Pij) ln(aij)) −<br />
mi=1 nj=1 N (ln(P 2<br />
ij ))<br />
<br />
−<br />
mi=1 nj=1 ln(aij)<br />
mi=1 <br />
nj=1<br />
2<br />
(ln(Pij))<br />
where Pij and aij are the perimeter and area of patch ij,<br />
respectively, m is the number of patch types, n is the total<br />
number of patches of type i, and N is the total number of<br />
patches in the landscape (unitless).<br />
(PSCV), area-weighted mean patch shape index (AWMSI), and double-log fractal dimension<br />
(DLFD). Detailed definitions of these 6 metrics are given in Table 1. These metrics<br />
can be computed at both the landscape level (i.e., considering all land use types in the<br />
landscape) and the class level (i.e., considering only one individual land use type each<br />
time). We compared the simulated with empirical maps at both levels, but focused only<br />
on the urban land use type at the class level because of our particular interest in urban<br />
growth.<br />
Due to the stochastic nature of the model, the spatial patterns of different simulation<br />
runs with the same parameter set differed in certain ways. Thus, to make a meaningful<br />
comparison between the model output and the empirical map, we needed to determine the<br />
minimum number of runs for computing the means of the selected metrics for each of the<br />
five grain sizes at which the model was run. This was done using the formula recommended<br />
by Grant et al. (1997):<br />
n ≥ 2(σ/δ) 2 2 tα,γ + t2(1−P),γ<br />
(3)<br />
where n is the number of runs, σ is the estimated standard deviation of model runs, δ is the<br />
smallest difference between the predicted and observed values of a variable of interest that
228 BERLING-WOLFF AND WU<br />
we desire to detect, γ is the degrees of freedom of the sample standard deviation with b<br />
groups of samples and n samples per group (or γ = b(n − 1)), α is the significance level,<br />
P is the desired probability that a difference will be found to be significant if it is as small<br />
as δ and tα,γ and t2(1−P),γ are values from a two-tailed t-table with γ degrees of freedom<br />
corresponding to probabilities of α and 2(1 − P), respectively. One cannot solve for n<br />
directly because γ is a function of n. Instead, one guesses a value of n, calculates γ , then<br />
solves the equation for n.Ifthe calculated n is not equal to the guessed n,adifferent value<br />
of n is guessed accordingly and the procedure repeats. Here, an estimate of the variability<br />
of selected sampling items (in this case landscape indices) needs to be obtained by running<br />
30 baseline simulations and calculating the sample variance. The minimum number of runs<br />
required to compute the mean of each of the 6 selected metrics is listed in Table 2. At<br />
the landscape level, the minimum number of runs tended to increase with increasing grain<br />
size (i.e., decreasing resolution), but such a trend was absent at the class level (Table 2).<br />
Instead, the finest and coarsest grain sizes required the largest number of runs for deriving<br />
meaningful means of the metrics. To simplify the simulation procedures, we derived the<br />
means of all the metrics based on 30 simulation runs, which was larger than the minimum<br />
number of runs for most landscape metrics (except NP and MPS) at all grain sizes based<br />
on Eq. 3.<br />
Figure 5 shows the results of the six landscape metrics computed for both the whole<br />
landscape including all land use types and the urban class only. The relative differences<br />
between the model and data at each grain size are listed in Table 3. In general, two kinds<br />
of scale effects were apparent: (1) the values of the landscape metrics changed with grain<br />
size (Wu, 2004), and (2) the agreement between the model and the empirical data also<br />
varied with grain size. For a given metric, these scale effects showed similar patterns at<br />
the urban class and the whole landscape levels, but model accuracy measured by these<br />
metrics was consistently higher at the landscape level than the class level (Table 3). Specifically,<br />
the values of the number of patches, edge density, and patch size coefficient of<br />
variation decreased with grain size, and the discrepancy between the model and data measured<br />
by these metrics was greatest at the 60 m grain size, smallest at the 120 m grain<br />
size, and moderate to small for larger grain sizes (figures 5a–d, g–h; Table 3). The average<br />
shape of individual patches (AWMSI) showed a similar pattern without the dramatically<br />
large discrepancy at the finest grain size (figures 5i–j). In contrast, the mean size<br />
of individual patches (MPS) and the shape complexity of the whole landscape (DLFD)<br />
tended to increase with grain size, and so did the model errors represented by these metrics<br />
(figures 5e–f, k–l).<br />
Projecting future urban growth of Phoenix<br />
A major goal of this study was to explore how the Phoenix urban landscape would change<br />
in the future. To achieve this goal, we designed three development scenarios based on<br />
the current political climate and the desires of the residents, and then ran simulations to<br />
examine how these scenarios led to different future development patterns. The sources of<br />
information for developing these scenarios include the Maricopa County Comprehensive
MODELING URBAN LANDSCAPE DYNAMICS 229<br />
Table 2. The minimum number of runs for computing the means of the six landscape metrics, at both the<br />
landscape and class (urban) levels, for the five grain sizes at which the model was run. A value of >30<br />
indicates that we ran the model up to 30 times, and still could not determine the minimum number of runs<br />
for computing the means of the selected metrics<br />
Minimum number of runs needed<br />
for computing the mean<br />
Landscape metric Model grain size Whole landscape Urban class only<br />
Number of patches (NP) 1000 m 10 >30<br />
480 m 5 >30<br />
240 m 5 >30<br />
120 m 5 >30<br />
60 m 10 15<br />
Edge density (ED) 1000 m 5 20<br />
480 m 5 10<br />
240 m 5 5<br />
120 m 5 5<br />
60 m 5 5<br />
Mean patch size (MPS) 1000 m 10 >30<br />
480 m 5 >30<br />
240 m 5 >30<br />
120 m 5 >30<br />
60 m 10 15<br />
Patch size coefficient 1000 m 10 20<br />
of variation (PSCV) 480 m 5 20<br />
240 m 5 15<br />
120 m 5 15<br />
60 m 10 10<br />
Area-weighted mean patch 1000 m 5 25<br />
shape index (AWMSI) 480 m 5 20<br />
240 m 5 15<br />
120 m 5 15<br />
60 m 10 15<br />
Double-log fractal 1000 m 5 10<br />
dimension (DLFD) 480 m 5 5<br />
240 m 5 5<br />
120 m 5 5<br />
60 m 5 5<br />
Plan (Maricopa, 1997), an analysis of a recent local growth limitation initiative (Gordon<br />
et al., 2000), and other studies (Lee et al., 1998; Landis et al., 1998; Ellfman, 1997). A<br />
grain size of 480 meters was selected for the scenarios because of the reasonable balance<br />
between overall model accuracy and computational demands.
230 BERLING-WOLFF AND WU<br />
Three scenarios<br />
Scenario 1 represented the continuation of development status quo. Developers continued<br />
to provide large, single-family dwellings as the market demands, and the density and growth<br />
rates remained at the 1995 rates. Recreation areas , particularly parks, are an important part<br />
of urban development. Using 2002 statistics of the current population, number of parks and<br />
average park size for Peoria (one city in the Phoenix metropolitan area), we derived parameters<br />
for modeling park creation in a fast developing city in this region. Specifically, the model<br />
Figure 5. Comparison of the spatial patterns between the empirical and simulated maps using landscape metrics<br />
at the whole landscape level (A, C, E, G, I, K) and the urban class level (B, D, F, H, J, L).<br />
(Continued on next page).
MODELING URBAN LANDSCAPE DYNAMICS 231<br />
Figure 5. (Continued).<br />
created parks at an average rate of one new park cell for every 74 new urban cells. The new<br />
park was placed next to a newly urbanized cell if there was not already a park within a radius<br />
of 7 cells (approximately 2 miles). Another important issue for future urban development in<br />
the Phoenix area is the disposition of state trust land. Current Arizona legislation requires<br />
that state trust land be sold to the highest bidder, effectively encouraging developers to<br />
buy the lands for development. There is a movement locally to turn some state trust lands<br />
into parks, but this would require an amendment of the state law. In this scenario, all<br />
state trust lands were assumed to be sold to developers and opened to development in<br />
2007.
232 BERLING-WOLFF AND WU<br />
Table 3. Comparison of the simulated and empirical maps using landscape metrics at both the landscape<br />
and class (urban) levels. Numbers in bold in each row represents the smallest difference among the five grain<br />
sizes<br />
% Difference between the simulated<br />
and empirical maps [Grain sSize (meters)]<br />
Landscape metric 60 120 240 480 1000<br />
Number of patches (NP) Landscape 87 −3 −11 −16 −24<br />
Class 320 −14 −34 −34 −48<br />
Edge density (ED) Landscape 17 −3 −6 −8 −12<br />
Class 40 −10 −18 −27 −37<br />
Mean patch size (MPS) Landscape −46 4 13 19 32<br />
Class −72 21 53 46 93<br />
Patch size coefficient Landscape 36 −2 −6 −7 −11<br />
of Variation (PSCV) Class 82 −10 −20 −13 −17<br />
Area-weighted mean patch Landscape 6 −1 −4 −2 0.04<br />
shape index (AWMSI) Class −14 −14 −16 −14 −13<br />
Double-log fractal Landscape 1 1 0 −1 −3<br />
dimension (DLFD) Class −0.1 −1 −1 −2 −5<br />
The comprehensive plan for Maricopa County encourages infill within existing development,<br />
the incorporation of more multi-family dwellings, and the preservation of lands with<br />
slope greater than 15%. To simulate this situation, Scenario 2 represented a more managed<br />
approach to urban growth. Population density was increased by 10% over 10 years (starting<br />
in 2002) to represent infill and the decrease in proportion of single-family dwellings, and<br />
population growth rate was decreased by 5% over 10 years (starting in 2002) to represent<br />
the decreased desirability of the crowded area. Parks were created as in Scenario 1, and<br />
only 50% of state trust lands were opened to development in 2007, with the other 50% left<br />
as protected open spaces.<br />
Scenario 3 represented a hard-line approach to growth management, similar to that proposed<br />
in 1997 by the Sierra Club and others in one of the local growth initiative propositions.<br />
In this scenario, population density was increased by 25% over 10 years (starting in 2002)<br />
to represent infill and the decrease in proportion of single-family dwellings, and the population<br />
growth rate was decreased by 15% over 10 years (starting in 2002) to represent the<br />
decreased desirability of the increasingly crowded area. Parks were created from 50% of<br />
the state trust lands according to the method described in Scenario 1, and the rest opened<br />
to development in 2007.<br />
Projections<br />
We ran the three scenarios from 1995 until the available open desert lands were all developed.<br />
(Technically, the simulation stopped when there was no longer enough land for another full<br />
year’s development, rather than when every available cell was urbanized.) Table 4 lists
MODELING URBAN LANDSCAPE DYNAMICS 233<br />
Table 4. Comparison of the results among 3 scenarios at the end year<br />
Final population Final population Final population density<br />
Scenario End year (million) growth rate (%) (per cell)<br />
Status quo 2029 8.2 3.5 296<br />
Managed 2028 7.8 3.3 325<br />
Ultra-managed 2033 9.0 2.9 370<br />
some of the model output at the ending year, final population size, population growth<br />
rate, and population density per grid cell for each of the three scenarios. The available<br />
lands were projected to be filled up by 2029 with a population size of 8.18 million for<br />
Scenario 1 (continuing development status quo), by 2028 with a population size of 7.76<br />
million for Scenario 2 (managed development), and by 2033 with a population size of 9.03<br />
million for Scenario 3 (heavily managed development). By comparing the three different<br />
scenarios, it became evident that small increases in population density or small decreases<br />
in population growth rate would not have a significant impact on the time needed to “fill<br />
up” the Phoenix metropolitan area. The status quo scenario took one more year than the<br />
moderately managed development scenario because the latter converted 50% of the state<br />
trust lands to parks while the status quo scenario opened all trust lands for development.<br />
On the other hand, quite significant decreases in population growth rate and increases in<br />
population density prolonged the filling-up process only by 4 years, although they did allow<br />
for a significantly larger population.<br />
Visual comparison of the urban landscape patterns generated by Scenarios 1 and 3 at<br />
an arbitrarily chosen year, 2014 (figure 6a, c) and the ending year (figure 6b, d) did not<br />
show dramatic differences in urban morphology although a closer scrutiny seemed to reveal<br />
that the heavily managed scenario created more and larger undeveloped patches in the<br />
landscape. This was due partly to the assumption that all state trust lands were opened to<br />
development in the status quo scenario, but half of them were reserved for open space in<br />
the ultra-managed scenario.<br />
To further examine how the urbanization trajectories of the three scenarios might differ,<br />
we quantified each landscape time series using six landscape metrics: Patch Density (PD),<br />
Largest Patch Index (LPI), Mean Patch Size (MPS), Shannon’s Diversity Index (SHDI),<br />
Contagion (CONT), and Double Log Landscape Fractal Dimension (DLFD). While the<br />
six landscape metrics, reflecting different aspects of landscape pattern, exhibited various<br />
patterns of temporal change, the three scenarios showed a similar trend for a given landscape<br />
metric (figure 7). The end results for all scenarios were: increases in patch density and<br />
contagion and decreases in the largest patch, mean patch size, patch diversity, and landscape<br />
fractal dimension. However, the numerical discrepancy among the three scenarios seemed to<br />
increase as urban development unfolded. It was evident from figure 7 that, over much of the<br />
simulation time, the heavily managed development scenario had the lowest values in Patch<br />
Density and Contagion and the highest values in Largest Patch Index, Mean Patch Size,<br />
Shannon Diversity Index, and Landscape Fractal Dimension. As expected, the status quo<br />
scenario showed the opposite, and the behavior of the moderately managed development
234 BERLING-WOLFF AND WU<br />
Figure 6. Model projected urban development patterns in the Phoenix metropolitan region: the status quo scenario<br />
in 2014 and 2029 (A–B), and the heavily managed development scenario in 2014 and 2033 (C–D). All simulations<br />
were conducted at the grain size of 480 m. See text for the details of the scenarios.<br />
scenario was somewhere in between. Collectively, these changes indicated that the most<br />
intensely managed development would lead to a less fragmented landscape with more large<br />
patches and higher overall shape complexity.<br />
An interesting and potentially important finding of the scenario analysis was that there<br />
would be an urban morphological threshold over which drastic changes in certain aspects<br />
of landscape pattern would occur. This threshold was indicated by the abrupt changes in<br />
the values of some landscape metrics (figures 7b, d, f). Specifically, large patches of open<br />
lands (including protected lands, parks and available desert lands) began to break up, patch<br />
diversity dropped due partly to the loss of agricultural lands, and the overall landscape shape<br />
complexity also decreased because of the predominance of urban lands. It seemed that none<br />
of the scenarios could avoid this threshold, but the heavily managed development scenario<br />
was able to postpone the onset of the threshold. This seems a plausible future for the Phoenix<br />
metropolitan area, and the empirical explanation may be as follows. During the early years<br />
of the simulation, much land available for development existed around current urban areas,<br />
particularly agricultural fields. As urbanization proceeded, new growth extended out from<br />
existing development, fragmenting lands near the core area but leaving the largest patches<br />
away from the center untouched. As the available lands began to fill up, growth began to<br />
spread outwards and break up the large patches of open lands. This threshold phenomenon<br />
may have significant ecological implications because open lands within and around cities
MODELING URBAN LANDSCAPE DYNAMICS 235<br />
Figure 7. Comparison of the projected landscape patterns of the Phoenix metropolitan area among the three<br />
urban development scenarios: quo = status quo, man = managed development, and ultra = heavily managed<br />
development.
236 BERLING-WOLFF AND WU<br />
provide habitat and corridors for many of the native species and a range of ecosystem<br />
services.<br />
Discussion and conclusions<br />
Limitations of the model<br />
The current version of the PHX-UGM model has several limitations. It includes only a<br />
few land use types and insufficient social and economic factors necessary to understand<br />
the biophysical and socioeconomic interactions in urban dynamics. The model assumes a<br />
constant population density within grid cells, and does not allow for a decreasing population<br />
density that would indicate a decaying urban core. Also, as urban development takes place,<br />
more new roads need to be created, but the current model does not project new road development.<br />
In addition, there are general limitations to the cellular automata (CA) modeling<br />
approach. CA models generally assume that large-scale patterns emerge from local-scale<br />
(or cell-level) interactions. In reality, local interactions do play an important role in urban<br />
development, but high-level constraints imposed by planners, developers and governmental<br />
agencies can also significantly shape the developed landscapes. This problem was alleviated<br />
to some extent in our model by adding some high-level constraints (e.g., land ownership,<br />
development restrictions).<br />
It is also important to note that our model evaluation, although quite comprehensive, is<br />
not a complete “validation” of PHX-UGM. In principle, a rigorous evaluation of a model<br />
requires empirical data that were not used in model calibration. However, as with many<br />
existing land use change models, the validation data for PHX-UGM were also used for<br />
its calibration. Thus, the model evaluation was essentially to assess how successful the<br />
calibration process was, not how accurate the model prediction was. This approach has<br />
long been practiced in land use modeling, probably because of three reasons. The first is<br />
the general shortage of methodologically comparable and high quality data sets of land use<br />
change for multiple time periods. The second is the need for temporal downscaling (i.e.,<br />
temporal interpolation). Land use models in many cases use as input a few maps representing<br />
the same landscape at different points of time, and one of the objectives may be to simulate<br />
the dynamics of the landscape for time periods that were not represented by the input maps<br />
(e.g., Turner, 1987; Jenerette and Wu, 2001). The third reason is the need for projections<br />
and scenario analysis. Because projections into the future can not be validated at present,<br />
a model tested on recent historical change may provide confidence for projecting into the<br />
future.<br />
Evaluation of urban models using multiple methods<br />
The evaluation of spatially explicit urban models like PHX-UGM is challenging in terms<br />
of both methodology and data demands. Because of the nature of spatial models, multiple<br />
methods and multiple-scale analyses should be used in the validation process of urban<br />
models. This has generally not been the case in urban modeling. In this study, we used error<br />
matrix, multiple-resolution goodness-of-fit and landscape metrics together to evaluate the
MODELING URBAN LANDSCAPE DYNAMICS 237<br />
model projections against empirical data. The results of the error matrix method showed that<br />
model accuracy decreased with increasing spatial resolution (i.e., decreasing grain size).<br />
This is apparently consistent with the findings in Costanza and Maxwell (1994). However,<br />
the results of multiple-resolution goodness-of-fit suggest that there is a limited range of<br />
grain sizes (i.e., 120–480 meters) within which the model performed best as measured by<br />
overall fit. The pattern analysis using landscape metrics illustrated the following findings:<br />
(1) model accuracy varied with landscape metrics under consideration, suggesting that<br />
the model simulated certain landscape atributes better than others; (2) model accuracy<br />
was dependent on the scale of analysis (grain size), suggesting landscape metrics must be<br />
analyzed at multiple scales (Wu et al., 2002; Wu, 2004); and (3) there was an optimal grain<br />
size (120 m) or an optimal range of grain sizes (120–480 m) at which the model produced<br />
more accurate landscape patterns.<br />
The different evaluation methods provided useful information on different aspects of the<br />
performance of the model. Because each method focused on different aspects, discrepancies<br />
among these methods should be expected. To answer questions such as whether the model<br />
is good enough for a specific purpose or what is the best spatial resolution of the model, one<br />
must consider the balance between overall model fit and landscape pattern accuracy, and the<br />
tradeoff between projection accuracy and structural details. Considering these factors and<br />
given the purpose of the study, we conclude that PHX-UGM would be best used at the grain<br />
size of 120–480 m. When fine-scale data are available and when landscape structural details<br />
are desirable, the 120-m grain size may be preferred. When the model grain size is too small,<br />
noise and uncertainty in input data and computational requirements significantly reduce the<br />
usefulness and accuracy of the model. When the grain size is too large, model projections<br />
would be of little use to addressing research questions at the local and regional scales. Note<br />
that several improved methods for evaluating land use models have been proposed recently<br />
(Pontius, 2002; Pontius and Batchu, 2003; Pontius et al., 2003; Shao et al., 2003), which<br />
should help resolve one of the most challenging problems in spatial modeling—model<br />
evaluation.<br />
Future development of the Phoenix urban landscape<br />
The historical development pattern in the Phoenix metropolitan area is that, as the urban<br />
fringe expanded outwards rapidly, the population density in the urban core density also<br />
increased (Morrison Institute for Public Policy, 2000). Farms have been converted to housing<br />
developments and retail super-centers, and inner city neighborhoods of single family homes<br />
have been converted to more densely populated residential areas. Our modeling results<br />
indicate that as the cities and towns in the region continue to grow, urban clusters will begin<br />
to merge into fewer and larger aggregates. Our scenario analyses suggested that, unless<br />
dramatic actions were taken to slow down the population growth, the Metropolitan Phoenix<br />
area would soon be densely populated demographically and highly fragmented ecologically.<br />
The projected time for the geographic region to be “filled up” with urban development was<br />
around 2030. An important factor to consider in future urban development planning is the<br />
urban morphological threshold as indicated in the scenario analysis. For the purpose of<br />
conserving native species and ecosystems, future development must allow for enough city
238 BERLING-WOLFF AND WU<br />
parks and inner-city open lands so that a minimum habitat connectivity can be maintained.<br />
In addition, the location and spatial arrangement of parks and open spaces are also critically<br />
important. For example, these habitat patches should be situated in such a way as to create<br />
corridors in the increasingly fragmented landscape. An important value of PHX-UGM<br />
lies in its ability to incorporate different protection schemes, population growth rates and<br />
population density measures. Decision makers and land use planners may design an open<br />
space network, incorporate it into a model scenario, and then quantitatively assess habitat<br />
connectivity using landscape metrics. This may provide useful information for land-swap<br />
deals, such as trading specific state land tracts for desirable inner-city tracts to create parks.<br />
If an ecologically healthy Phoenix urban environment is to be maintained, time is running<br />
out on many of the options still available to city planners. The residents of the Phoenix<br />
Metro area have demonstrated repeatedly that they are opposed to further increasing population<br />
density or rapid urban sprawl. Growth management initiatives have been repeatedly<br />
voted down and developers have thwarted the legislature in their efforts to create growth<br />
management legislation. These facts indicate that if the area is to continue growing and if<br />
a reasonable quality of life is to be maintained, a new mindset will need to be adopted. As<br />
our model results suggest, this would require the strict regulation and careful planning of<br />
open spaces, as well as significantly increasing population densities in the developed areas.<br />
Acknowledgments<br />
We would like to thank Matt Luck, Darrel Jenerette, and John David at the Landscape<br />
Ecology and Modeling Laboratory (LEML) of Arizona State University for their assistance<br />
during the project. Suggestions and comments from Charles Wolff, G. Pontius, Jr., R.<br />
Quay, C. Redman, and N. Grimm are also greatly appreciated. This research was supported<br />
in part by grants from the U.S. Environmental Protection Agency’s Science to Achieve<br />
Results program (R827676-01-0), and US National Science Foundation (DEB 97-14833,<br />
CAP-LTER).<br />
References<br />
Batty, M. (1979) Progress, success, and failure in urban modelling. Environment and Planning A 2, 863–878.<br />
Batty, M. (1994) A chronicle of scientific planning: The anglo-american modeling experience. Journal of the<br />
American Planning Association 60, 7–16.<br />
Batty, M., Longley, P. and Fotheringham, S. (1989) Urban growth and form: Scaling, fractal geometry, and<br />
diffusion-limited aggregation. Environment and Planning A 21, 1447–1472.<br />
Batty, M. and Xie, Y. (1994) From cells to cities. Environment and Planning B 21, S31–S48.<br />
Berling-Wolff, S. and Wu, J. (2004) Urban growth models: A historical review. Ecological Research 19, 119–129.<br />
Breuste, J., Feldmann, H. and Uhlmann, O., eds. (1998) Urban Ecology. <strong>Springer</strong>, Berlin.<br />
Clarke, K.C., Hoppen, S. and Gaydos, L. (1997) A self-modifying cellular automaton model of historical urbanization<br />
in the San Francisco Bay Area. Environment and Planning B 24, 247–261.<br />
Congalton R.G. and Green, G. (1999) Assessing the Accuracy of Remotely Sensed Data: Principles and Practices.<br />
Lewis Publishers, Boca Raton.<br />
Costanza, R. and Maxwell, T. (1994) Resolution and predictability: An approach to the scaling problem. Landscape<br />
Ecology 9, 47–57.
MODELING URBAN LANDSCAPE DYNAMICS 239<br />
Couclelis, H. (1985) Cellular worlds: A framework for modeling micro-macro dynamics. Environment and Planning<br />
A 17, 585–596.<br />
Ellfman, T. (1997) Infill: The Cure for Sprawl? Accessed 8 November 2002, www.urbanfutures. org/abstract.cfm.<br />
Foresman, T.W., Pickett, S.T.A. and Zipperer, W.C. (1997) Methods for spatial and temporal land use and land<br />
cover assessment for urban ecosystems and application in the Greater Baltimore-Chesapeake Region. Urban<br />
Ecosystems 1, 201–216.<br />
Gammage, G., Jr. (1998) Phoenix in Perspective: Reflection on Developing the Desert. Herberger Center for<br />
Design Excellence, Arizona State University, Tempe AZ.<br />
Gordon, P., Richardson, H., Donghwan, A. and O’Brien, T. (2000) The Economic Effects of Arizona’s Proposed<br />
Citizen’s Growth Management Initiative. www.azchamber.com/commerce/Gordon.pdf.<br />
Grant, W., Pedersen, E.K. and Marin, S.L. (1997) Ecological & Natural Resource Management Systems Analysis<br />
and Simulation. John Wiley & Sons, Inc., New York.<br />
Gustafson, E.J. (1998) Quantifying landscape spatial pattern: What is the state of the art? Ecosystems 1, 143–156.<br />
Guhathakurta, S., ed. (2003) Integrated Land Use and Environmental Models. <strong>Springer</strong>, Berlin.<br />
Harris, B. (1985) Urban simulation models in regional science. Journal of Regional Science 25, 545–567.<br />
Harris, B. (1994) The real issues concerning Lee’s ”requiem”. Journal of the American Planning Association 60,<br />
31–34.<br />
Jelinski, D.E. and Wu, J. (1996) The modifiable areal unit problem and implications for landscape ecology.<br />
Landscape Ecology 11, 129–140.<br />
Jenerette, D.G. and Wu, J. (2001) Analysis and simulation of land-use change in the Central Arizona–Phoenix<br />
Region. Landscape Ecology 16, 611–626.<br />
Kirtland, D., Gaydos, L., Clarke, K., DeCola, L., Acevedo, W. and Bell, C. (1994) An analysis of human-induced<br />
land transformations in the San Francisco Bay/Sacramento Area. World Resources Review 6, 206–217.<br />
Knowles-Yanez, K., Morizt, C., Fry, J., Bucchin, M., Redman, C.L. and McCartney, P. (1999) Historic Land Use<br />
Team: Phase I Report on Generalized Landuse. Central Arizona Phoenix LTER: Phoenix, Arizona, USA.<br />
Landis, J.D., Monzon, J.P., Reilly, M. and Cogan, C. (1998) Development and Pilot Application<br />
of the California Urban and Biodiversity Analysis (CURBA) Model. http://gis.esri.com/ library/userconf/proc98/PROCEED/TO600/PAP571/P571.htm.<br />
Lee, D.B., Jr. (1973) Requiem for large-scale models. Journal of the American Institute of Planners 40, 163–178.<br />
Lee, D.B., Jr. (1994) Retrospective on large-scale urban models. The Journal of the American Planning Association<br />
60, 35–40.<br />
Lee, J., Tian, L., Erickson, L.J. and Kulikowski, T.D. (1998) Analyzing growth-management policies with geographical<br />
information systems. Environment and Planning B 25, 865–879.<br />
Luck, M. and Wu, J. (2002) A gradient analysis of the landscape pattern of urbanization in the Phoenix metropolitan<br />
area of USA. Landscape Ecology 17, 327–339.<br />
Maricopa County Comprehensive Plan (1997) www.maricopa.gov/planning/compln/ COMPLAN.asp.htm<br />
McGarigal, K. and Marks, B.J. (1995) FRAGSTATS: Spatial Pattern Analysis Program for Quantifying Landscape<br />
Structure. Gen. Tech. Rep. PNW-GTR-351. Pacific Northwest Research Station, USDA-Forest Service,<br />
Portland.<br />
Morrison Institute For Public Policy (2000) Hits and Misses: Fast Growth in Metropolitan Phoenix. School of<br />
Public Affairs, Arizona State University. www.asu.edu/copp/morrison.<br />
O’Neill, R.V., Krummer, J.R., Gardner, R.H., Sugihara, G., Jackson, B., DeAngelis, D.L., Milne, B.T., Turner,<br />
M.G., Zygmunt, B., Christensen, S.W., Dale, V.H. and Graham, R.L. (1988) Indices of landscape pattern.<br />
Landscape Ecology 1, 153–162.<br />
Oreskes, N., Shrader-Frechette, K. and Belitz, K. (1994) Verification, validation, and confirmation of numerical<br />
models in the earth sciences. Science 263, 641–646.<br />
Pickett, S.T.A., Burch, J., Dalton, S.E., Foresman, T.W., Grove, J.M. and Rowntree, R. (1997) A conceptual<br />
framework for the study of human ecosystems in urban areas. Urban Ecosystems 1, 185–199.<br />
Pickett, S.T.A. and Cadenasso, M.L. (1995) Landscape ecology: Spatial heterogeneity in ecological systems.<br />
Science 269, 331–334.<br />
Pickett, S.T.A., Cadenasso, M.L., Grove, J.M., Nilon, C.H., Pouyat, R.V., Zipperer, W.C. and Costanza, R. (2001)<br />
Urban ecological systems: Linking terrestrial ecological, physical, and socioeconomic components of metropolitan<br />
areas. Annual Review of Ecology and Systematics 32, 127–157.
240 BERLING-WOLFF AND WU<br />
Pontius, Jr., R.G. (2002) Statistical methods to partition effects of quantity and location during comparison of<br />
categorical maps at multiple resolutions. Photogrammetric Engineering & Remote Sensing 68, 1041–1049.<br />
Pontius, Jr., R.G. and Batchu, K. (2003) Using the relative operating characteristic to quantify certainty in prediction<br />
of location of land cover change in India. Transactions in GIS 7, 467–484.<br />
Pontius, Jr., R.G., Agrawal, A. and Huffaker, D. (2003) Estimating the uncertainty of land-cover extrapolations<br />
while constructing a raster map from tabular data. Journal of Geographic Systems 5, 253–273.<br />
Rykiel, E.J., Jr. (1996) Testing ecological models: The meaning of validation. Ecological Modelling 90, 229–244.<br />
Shao, G.F., Wu, W.C., Wu, G., Zhou, X. H. and Wu, J. (2003) An explicit index for assessing the accuracy of cover<br />
class areas. Photogrammetric Engineering and Remote Sensing 69, 907–913.<br />
Turner, M.G. (1987) Spatial simulation of landscape changes in Georgia: A comparison of 3 transition models.<br />
Landscape Ecology 1, 29–36.<br />
Turner, M.G. (1989) Landscape ecology: The effect of pattern on process. Annual Review of Ecology and Systematics<br />
20, 171–197.<br />
Turner, M.G., Costanza, R. and Sklar, F. (1989) Methods to evaluate the performance of spatial simulation models.<br />
Ecological Modelling 48, 1–18.<br />
Turner, S.J., O’Neill, R.V., Conley, W., Conley, M.R. and Humphries, H.C. (1991) Pattern and scale: Statistics<br />
for landscape ecology. In Quantitative Methods in Landscape Ecology (M.G. Turner and R.H. Gardner, eds.),<br />
pp. 17–49. <strong>Springer</strong>-Verlag, New York.<br />
Wegener, M. (1994) Operational urban models—state of the art. Journal of the American Planning Association<br />
60, 17–29.<br />
White, R. and Engelen, G. (1993) Cellular automata and fractal urban form: A cellular modelling approach to the<br />
evolution of urban land-use patterns. Environment and Planning A 25, 1175–1199.<br />
White, R. and Engelen, G. (1994) Cellular dynamics and gis: Modelling spatial complexity. Geographical Systems<br />
1, 237–253.<br />
Wu, F.(1998) Simulating urban encroachment on rural land with fuzzy-logic-controlled cellular automata in a<br />
geographical information system. Journal of Environmental Management 53, 293–308.<br />
Wu, J.(2004) Effects of changing scale on landscape pattern analysis: Scaling relations. Landscape Ecology 19,<br />
125–138.<br />
Wu,J.and David, J.L. (2002) A spatially explicit hierarchical approach to modeling complex ecological systems:<br />
Theory and applications. Ecological Modelling 153, 7–26.<br />
Wu,J.and Hobbs, R. (2002) Key issues and research priorities in landscape ecology: An idiosyncratic synthesis.<br />
Landscape Ecology 17, 355–365.<br />
Wu, J., Jelinski, D.E., Luck, M. and Tueller, P. (2000) Multiscale analysis of landscape heterogeneity: Scale<br />
variance and pattern metrics. Geographic Information Sciences 6, 6–19.<br />
Wu, J.and Loucks, O.L. (1995) From balance of nature to hierarchical patch dynamics: A paradigm shift in<br />
ecology. Quarterly Review of Biology 70, 439–466.<br />
Wu,J.and Marceau, D. (2002) Modeling complex ecological systems. Ecological Modelling 153, 1–6.<br />
Wu, J., Shen, W., Sun, W. and Tueller, P.T. (2002) Empirical patterns of the effects of changing scale on landscape<br />
metrics. Landscape Ecology 17, 761–782.<br />
Zipperer, W.C., Wu, J., Pouyat, R.V. and Pickett, S.T.A. (2000) The application of ecological principles to urban<br />
and urbanizing landscapes. Ecological Applications 10, 685–688.