Entire volume - Eawag
Entire volume - Eawag
Entire volume - Eawag

You also want an ePaper? Increase the reach of your titles
YUMPU automatically turns print PDFs into web optimized ePapers that Google loves.
pressure over the Azores) cause polar air<br />
to be transported southward over Europe,<br />
resulting in extremely cold winters there [2].<br />
This occurred, for instance, in January 1963,<br />
when both the Lake of Zurich and Lake<br />
Constance froze over – a very rare event<br />
indeed.<br />
Analyses of historical data<br />
records<br />
The timing of break-up of ice on lakes is<br />
highly dependent on the air temperatures<br />
prevailing during winter and spring (see also<br />
article on p. 19 of this issue). Since this is<br />
when the climatic influence of the NAO is<br />
at its greatest, it is likely that the NAO will<br />
determine to some extent the interannual<br />
variability in the timing of break-up of the<br />
lakes that lie within its extensive geographic<br />
range of influence. This hypothesis was<br />
investigated for various lakes distributed<br />
throughout the Northern Hemisphere for<br />
which long series of observations of the<br />
timing of break-up exist [3–6]. Here we will<br />
look at four representative lakes: Kallavesi<br />
(Finland), Lej da San Murezzan (or Lake of<br />
St. Moritz, Switzerland), Lake Baikal (Siberia)<br />
and Lake Mendota (Wisconsin, USA).<br />
Whether there really is an association between<br />
the NAO and the timing of break-up<br />
of these four lakes was investigated by correlating<br />
the time series of the calendar dates<br />
of their break-up with seasonal NAO indices.<br />
In general, any correlation obtained would<br />
be expected to be negative, since high NAO<br />
indices are associated with mild winters,<br />
presumably resulting in early break-up, and<br />
vice-versa. To find out additionally how the<br />
degree of influence of the NAO has varied<br />
through time, correlations were computed<br />
for a series of overlapping 50-year historical<br />
data windows, beginning with 1865–1914<br />
and ending with 1947–1996.<br />
The correlation coefficients obtained are<br />
illustrated in the form of two-dimensional<br />
contour plots in Fig. 3. In each plot, the<br />
correlation coefficient is shown as a function<br />
both of the season for which the NAO index<br />
was computed and of the historical data<br />
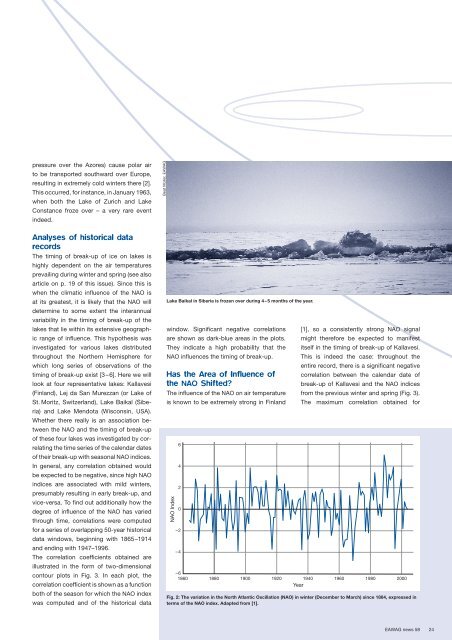
Beat Müller, EAWAG<br />
Lake Baikal in Siberia is frozen over during 4–5 months of the year.<br />
window. Significant negative correlations<br />
are shown as dark-blue areas in the plots.<br />
They indicate a high probability that the<br />
NAO influences the timing of break-up.<br />
Has the Area of Influence of<br />
the NAO Shifted?<br />
The influence of the NAO on air temperature<br />
is known to be extremely strong in Finland<br />
NAO Index<br />
6<br />
4<br />
2<br />
0<br />
–2<br />
–4<br />
[1], so a consistently strong NAO signal<br />
might therefore be expected to manifest<br />
itself in the timing of break-up of Kallavesi.<br />
This is indeed the case: throughout the<br />
entire record, there is a significant negative<br />
correlation between the calendar date of<br />
break-up of Kallavesi and the NAO indices<br />
from the previous winter and spring (Fig. 3).<br />
The maximum correlation obtained for<br />
–6<br />
1860 1880 1900 1920 1940 1960 1980 2000<br />
Year<br />
Fig. 2: The variation in the North Atlantic Oscillation (NAO) in winter (December to March) since 1864, expressed in<br />
terms of the NAO index. Adapted from [1].<br />
EAWAG news 58 24