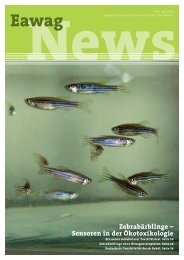
Entire volume - Eawag
Entire volume - Eawag
Entire volume - Eawag

You also want an ePaper? Increase the reach of your titles
YUMPU automatically turns print PDFs into web optimized ePapers that Google loves.
The CRIMEA Project<br />
This is one of the questions researchers<br />
from ten European research institutes and<br />
universities – including EAWAG – are seeking<br />
to answer within the framework of the<br />
CRIMEA project (Contribution of high intensity<br />
gas seeps in the Black Sea to methane<br />
emission to the atmosphere). CRIMEA<br />
specifically aims to:<br />
map the methane sources in the Black<br />
Sea,<br />
quantify the escaping fluids and gases,<br />
describe the active methane-decomposing<br />
bacteria on the seabed and in the water<br />
column,<br />
quantify the methane turnover, and<br />
characterize the physical, biological, and<br />
chemical processes involved during the rise<br />
of the methane to the sea surface.<br />
The First Black Sea Expedition<br />
In June 2003, we undertook the first Black<br />
Sea expedition on the Ukrainian ship “Prof.<br />
Vodyanitsky”. Our objectives included investigating<br />
two different methane sources,<br />
one at a depth of 90 m and the other at<br />
1980 m. The existence of these sources<br />
could be identified using what is known as<br />
gas bubble imaging. For comparison purposes,<br />
measurements were also conducted<br />
at two reference sites with no methane<br />
sources. The Black Sea is 80 m deep at the<br />
Methane<br />
molecules<br />
Water<br />
molecules<br />
Fig. 1: Structure of methane hydrate.<br />
27 EAWAG news 58<br />
shallower of the two reference sites, and<br />
1660 m deep at the other.<br />
The Path of Methane through<br />
the Water Column<br />
The first step involved finding answers to<br />
two questions [3]: how high are the methane<br />
concentrations immediately above the<br />
emission sites, and how does the methane<br />
behave during its rise through the water<br />
columns of differing lengths? To answer<br />
these questions, a special probe, a rosette<br />
sampler, was used to take water samples<br />
above the two methane sources and at the<br />
two reference sites. The rosette is comprised<br />
of 12 10-liter sampling bottles which<br />
can be closed off by a signal from the ship<br />
at different depths.<br />
Preliminary results show that the methane<br />
concentrations are highest directly above<br />
the two emission sites (Fig. 2A + B). The<br />
concentrations change very little during the<br />
first 40 m above the shallow site, and during<br />
the first 1500 m above the deeper site.<br />
At the deep methane source, a significant<br />
decrease in methane concentration only<br />
occurs in the upper 500 m of the water<br />
column.<br />
A Methane concentration (nM)<br />
B<br />
0 200 400 600 800<br />
0<br />
Water depth (m)<br />
20<br />
40<br />
60<br />
80<br />
100<br />
Water depth (m)<br />
To obtain the water samples we used a rosette sampler<br />
with 12 sampling bottles which could be closed<br />
off at different depths by a signal from the ship.<br />
We had expected to find much lower<br />
methane concentrations at the reference<br />
sites than at the emission sites. In the shallow<br />
zone this is in fact the case: there the<br />
methane concentrations at the reference<br />
site were on average 10 times lower than in<br />
the water column above the methane<br />
source (Fig. 2A). The methane concentrations<br />
found over the deep emission site,<br />
however, do not differ significantly from<br />
those found over the corresponding reference<br />
site. This was surprising, and we wondered<br />
whether our measuring technique,<br />
which involved the detection of methane<br />
using a gas chromatograph with a flame<br />
ionization detector, was capable of distinguishing<br />
such a low concentration difference.<br />
1000<br />
1500<br />
2000<br />
2500<br />
0<br />
0<br />
500<br />
Methane concentration (nM)<br />
5000 10,000<br />
15,000<br />
Fig. 2: Methane concentrations in the water columns above two methane sources (dark-blue curves) and the respective<br />
reference sites with no methane emission (light-blue curves). (A) in the shallow zone, (B) in the deep-water<br />
zone.<br />
EAWAG