Sample Examination One - La Jolla High School
Sample Examination One - La Jolla High School
Sample Examination One - La Jolla High School

You also want an ePaper? Increase the reach of your titles
YUMPU automatically turns print PDFs into web optimized ePapers that Google loves.
Section I<br />
Saxnple Exarnination <strong>One</strong><br />
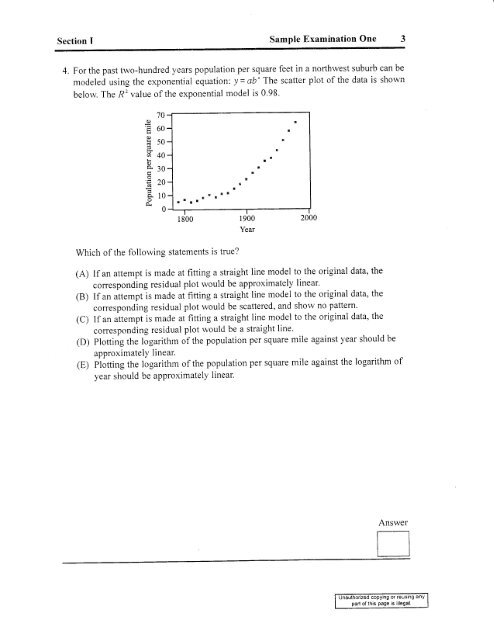
4. For the past two-hundred years population per square feet in a northwest suburb can be<br />
modeled using the exponential equation: | = ab' The scatter plot of the data is shown<br />
below The R2 value of the exponential model is 0.98.<br />
c.)<br />
!<br />
d<br />
6)<br />
70<br />
60<br />
50<br />
40<br />
Which of the following statements is true?<br />
30<br />
2A<br />
10<br />
0<br />
1800 1900 2uuu<br />
(A) tf an attempt is made at fitting a straight iine model to the original data, the<br />
corresponding residual plot would be approximately linear'<br />
(B) If an attempt is made at fitting a straight line model to the original data, the<br />
corresponding residual plot would be scattered, and shorv no pattem.<br />
(C) lf an attempt is made at fitting a straight line model to the original data, the<br />
corresponding residual plot would be a straight line'<br />
(D) plotting the logarithm of the population per square mile against year should be<br />
approximatelY linear.<br />
(g) plotting the logarithm of the population per square mile against the logarithm of<br />
year should be approximately linear.<br />
Year<br />
Answer<br />
tt<br />
II<br />
copying or reuslng any<br />
parl of this page is illegal